Difference of percentage of population of Hindus in 2005 and 2008 is:
1 20%
2 15%
3 25%
4 30%
Answer : 2. "15%"
Related Solutions
निम्न आरेख 2005 से 2008 के दौरान एक नगर में कुल जनसंख्या की तुलना में हिन्दुओ, सिखों और मुसलमानों की जनसंख्या का प्रतिशत दर्शाता है।
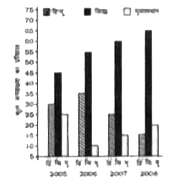
2005 से 2008 में हिन्दुओ की जनसंख्या के प्रतिशत का अंतर है
View SolutionThe following graph shows the percentage of population of Hindus, Sikhs and Muslims to the total population in a city during 2005 to 2008. The percentage difference of Hindu population in 2005 to 2008 is
View SolutionThe following graph shows the percentage of population of Hindus, Sikhs and Muslims to the total population in a city during 2005 to 2008. The percentage decrease in the population of Hindus from 2005 to 2008 is
View Solutionनिम्न आरेख 2005 से 2008 के दौरान एक नगर में कुल जनसंख्या की तुलना में हिन्दुओ, सिखों और मुसलमानों की जनसंख्या का प्रतिशत दर्शाता है।
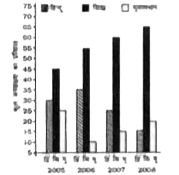
यदि 2008 में हिन्दुओ की कुल संख्या 12 लाख थी, तो 2008 में मुसलमानों की संख्या (लाख में ) थी
View SolutionThe following graph shows the percentage of population of Hindus, Sikhs and Muslims to the total population in a city during 2005 to 2008. If the total number of Hindus in 2008 was 12 lakhs, then the number of Muslims (in lakhs) in 2008 was
View SolutionThe following graph shows the percentage of population of Hindus, Sikhs and Muslims to the total population in a city during 2005 to 2008. If the total population in 2007 was 80 lakhs, then the number of Hindus (in lakhs) in 2007 was
View SolutionFollowing table givesd about the percentage change of the population in a particular town for given years. Go through the chart given and answer the questions that follow :
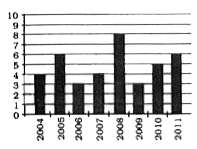
What is the percentage increase in population of the town from 2005 to 2008 ?
View SolutionThe population of a town increase at the rate of every year. Find the population of the town in the year 2008, if it's population in 2005 was 200,00.
View Solutionनिमिन्लिखित तालिका दिए गए वर्षो में किसिस नगर की जनसख्या के प्रतिसत परिवर्तन को दर्शाती है! दिए गए चार्ट को पढ़े और पर्सन उतर दे!
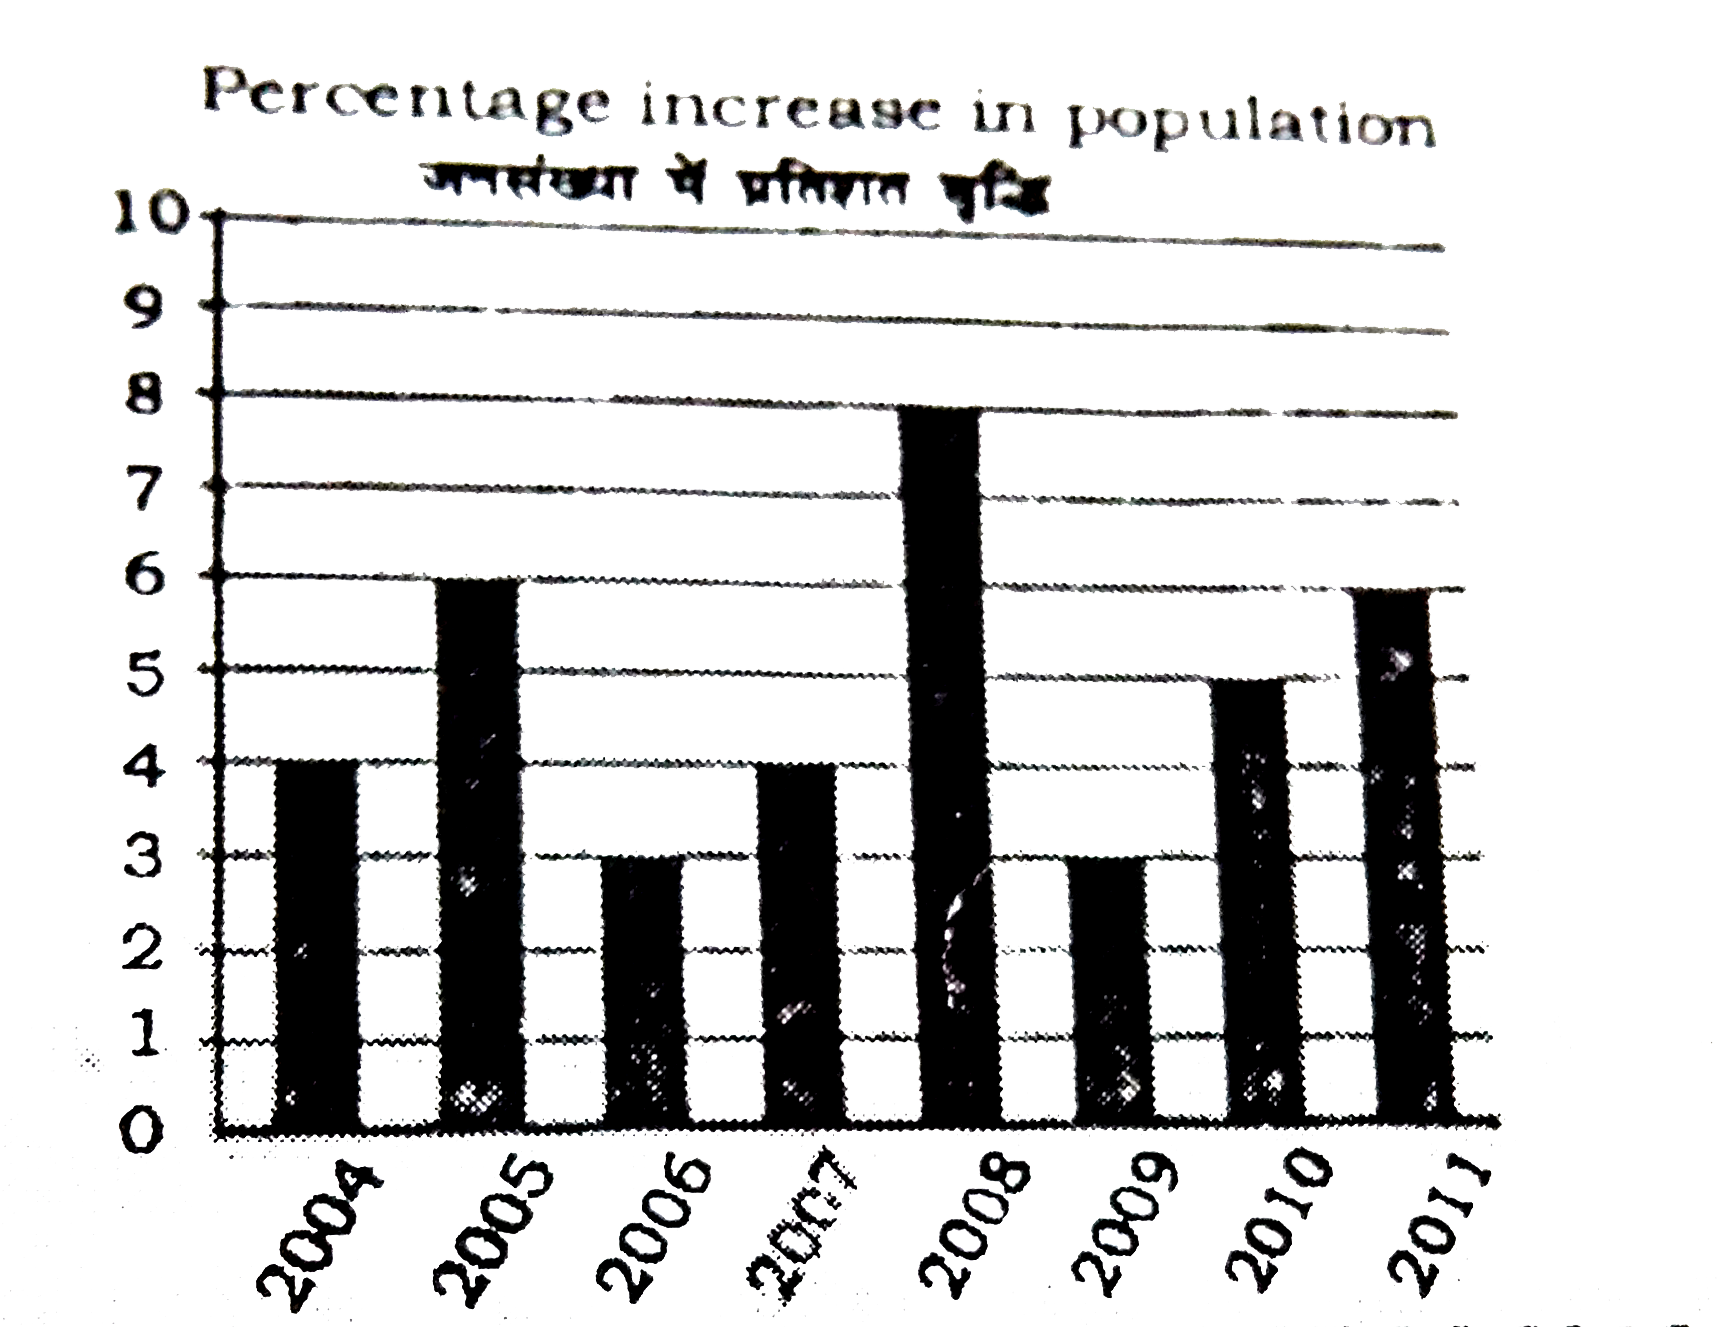
2005 से 2008 तक नगर की जनसँख्या विर्धि का प्रतिसत क्या था?
View SolutionThe following bar diagram shows the percentage of Hindus, Sikhs and Muslims in a state during the years from 2004 to 2007 . Examine the bar diagram and answer the following questions .
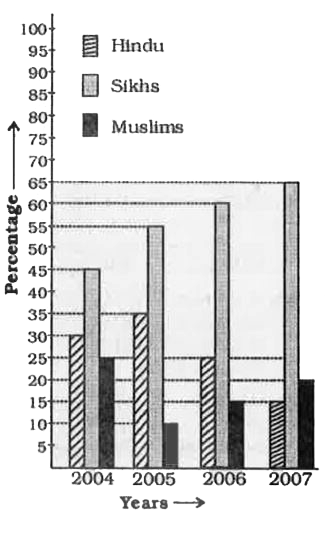
If the total population of the state in 2005 was 5 million. then the Hindu population was [1 million = 10,00,000]
View SolutionThe following bar diagram shows the percentage of Hindus, Sikhs and Muslims in a state during the years from 2004 o 2007. Examine the bar diagram and answer the following questions.
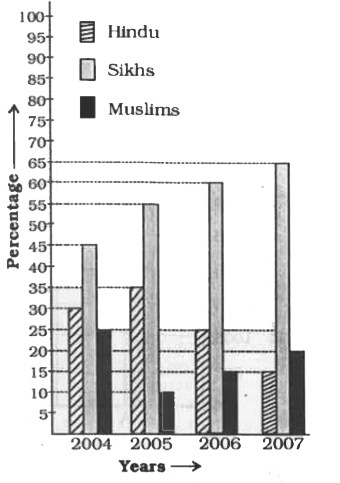
If the total population of the state in 2005 was 5 million, then the Hindu population was [1 million = 10,00,000]
View SolutionThe population of a place increased to 54,000 in 2003 rate of 5 % per annum what would be its population in 2005 ?
View SolutionGiven below is a bar diagram showing the percentage of Hindus, Sikhs and muslims in a state during the years 1989 to 1992.
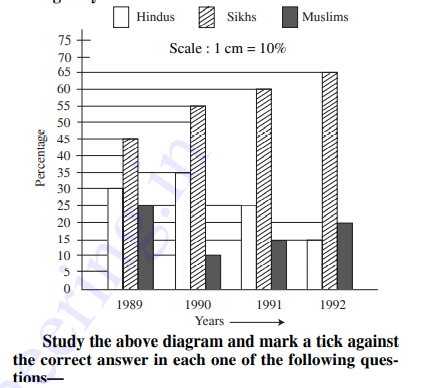
If the total population of the state in 1990 is 1 million, then the hindus population was -----
View SolutionGiven below is a bar diagram showing the percentage of Hindus, Sikhs and muslims in a state during the years 1989 to 1992.
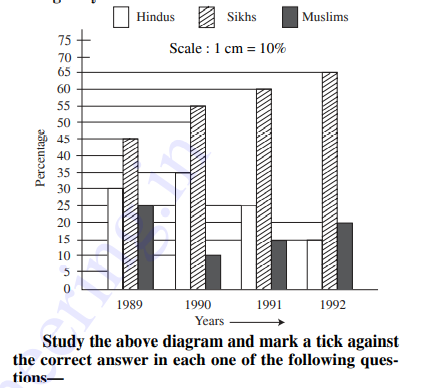
If the population of the state in 1989 be 6 lakhs, then what is the total population of hindus and muslims in this year ?
View SolutionAccording to the Hindu Succession Amendment Act, 2005
View SolutionAccording to the Hindu Succession (Amendment) Act, 2005
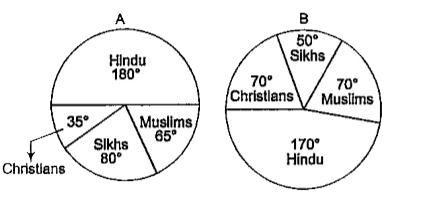
View SolutionFollowing two pie diagrams show the religion were distribution of workers in two states.
The percentage difference between Hindu population in state A and Muslims population in state B is
View SolutionGiven below is a bar diagram showing the percentage of Hindus, Sikhs and muslims in a state during the years 1989 to 1992.
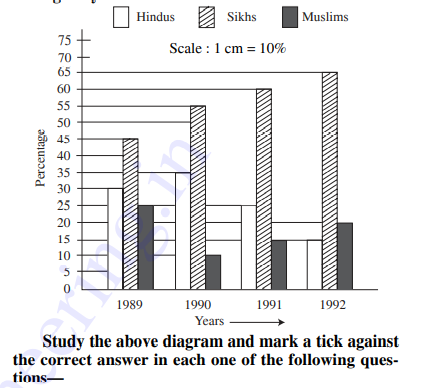
What percentage was the decrease in hindus population from 1989 to 1992 ?
View Solutionकोष्ठक में से सही शब्द चुनकर रिक्त स्थान को भरिए
2001 की जनगणना के अनुसार भारत में हिन्दू धर्मालंबियों की आबादी देश की कुल आबादी का प्रतिशत थी। (80.5,70.5)
View SolutionThe following bar graph shows the number of students in Arts, Science and Commerce subjects in a college for the year 2004-2005 to 2007-2008. study the graph Find the percentage of students in Science subject in the session 2005-2006.
View Solution