For which models was the percentage variation in production from 2007 to 2008 the maximum?
1 B and C
2 C and D
3 D and E
4 A and B
Answer : 4. "A and B "
Related Solutions
The bar chart given below shows the percentage distribution of the production of various models of a ,mobile manufacturing company in 2007 and 2008. The total production in 2007 was 35 lakh mobile phones and in 2008 the production was 44 lakh. Study the chart and answer the following questions.
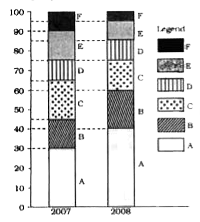
For which models was the percentage variation in production from 2007 to 2008 the maximum ?
View SolutionThe bar chart given below shows the percentage distribution of the production of various models of a ,mobile manufacturing company in 2007 and 2008. The total production in 2007 was 35 lakh mobile phones and in 2008 the production was 44 lakh. Study the chart and answer the following questions.
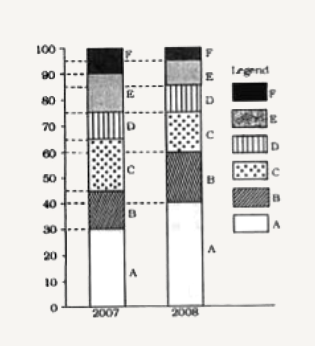
What was the difference in the number of B type mobiles produced in 2007 and 2008 ?
View SolutionYear by a mobile manufacturer in the column diagram given below. 2007 And 2008 The percentage distribution of mobiles of different models is shown. Year 2007 Total production of mobile phones in 35 was a million and 2008 In that 44 was a million. Percentage of six different types of mobiles manufactured by a company in two years Year 2007 From 2008 Which models produced the maximum percentage of variance till date?
View SolutionThe bar chart given below shows the percentage distribution of the production of various models of a mobile manufacturing company in 2007 and 2008 The total production in 2007 was 35 lakh mobile phones and in 2008 the production was 44 lakh Study the chart and answer the following questions
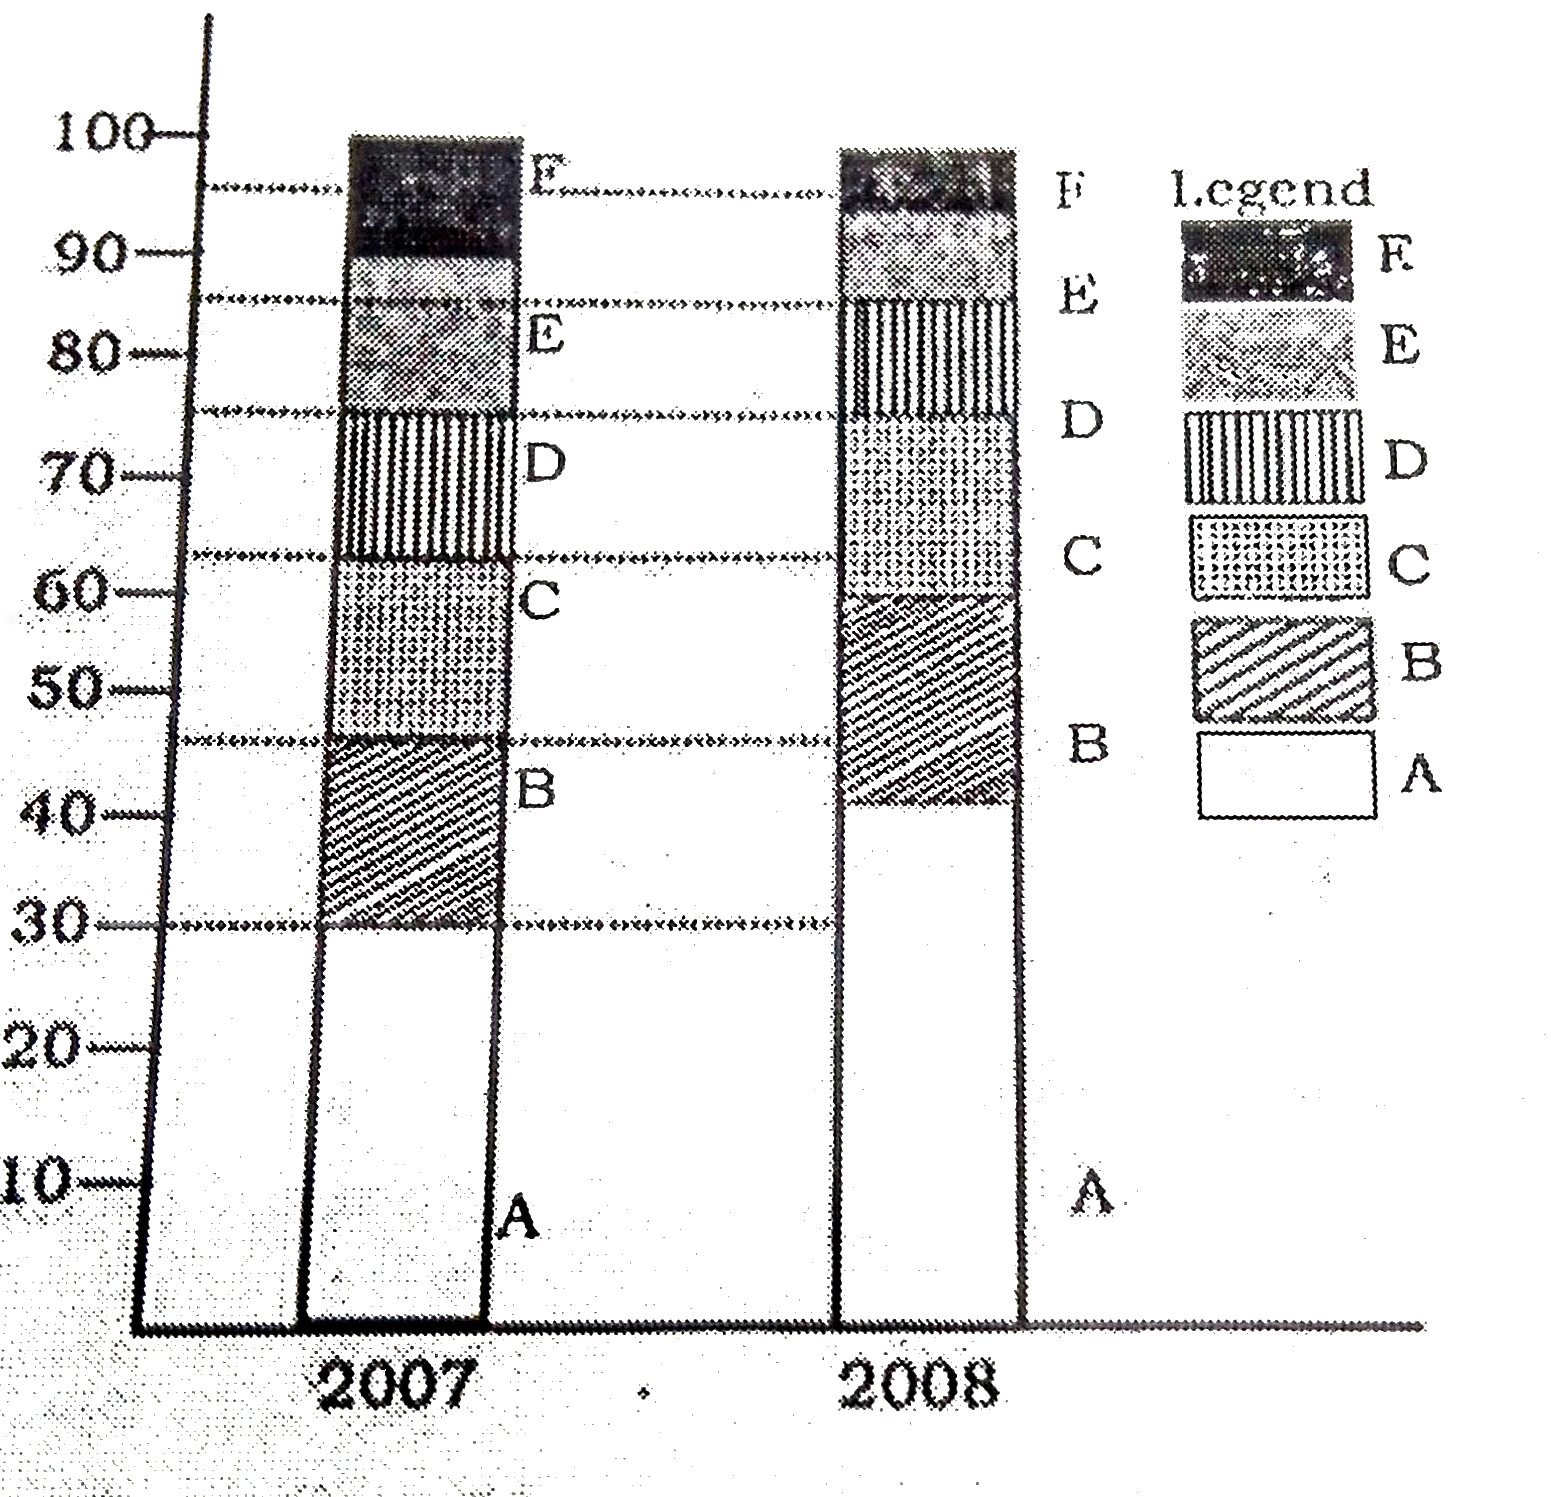
निम्न में से किस नमूनों का वर्ष 2007 से 2008 तक उत्पादन प्रतिशत का अंतर अधिकतम है ।
View SolutionIn which year was the percentage of production of Company to the production of Company , the maximum? (a) 2006 (b) 2007 (c) 2008 (d) 2009 (e) 2010
View SolutionFor which of the following years, the percentage rise or fall in production from the previous year is the maximum for Company ? (a) 2007 (b) 2008 (c) 2009 (d) 2010 (e) 2007 and 2010
View SolutionThe bar chart given below shows the percentage distribution of the production of various models of a mobile manufacturing company in 2007 and 2008 The total production in 2007 was 35 lakh mobile phones and in 2008 the production was 44 lakh Study the chart and answer the following questions
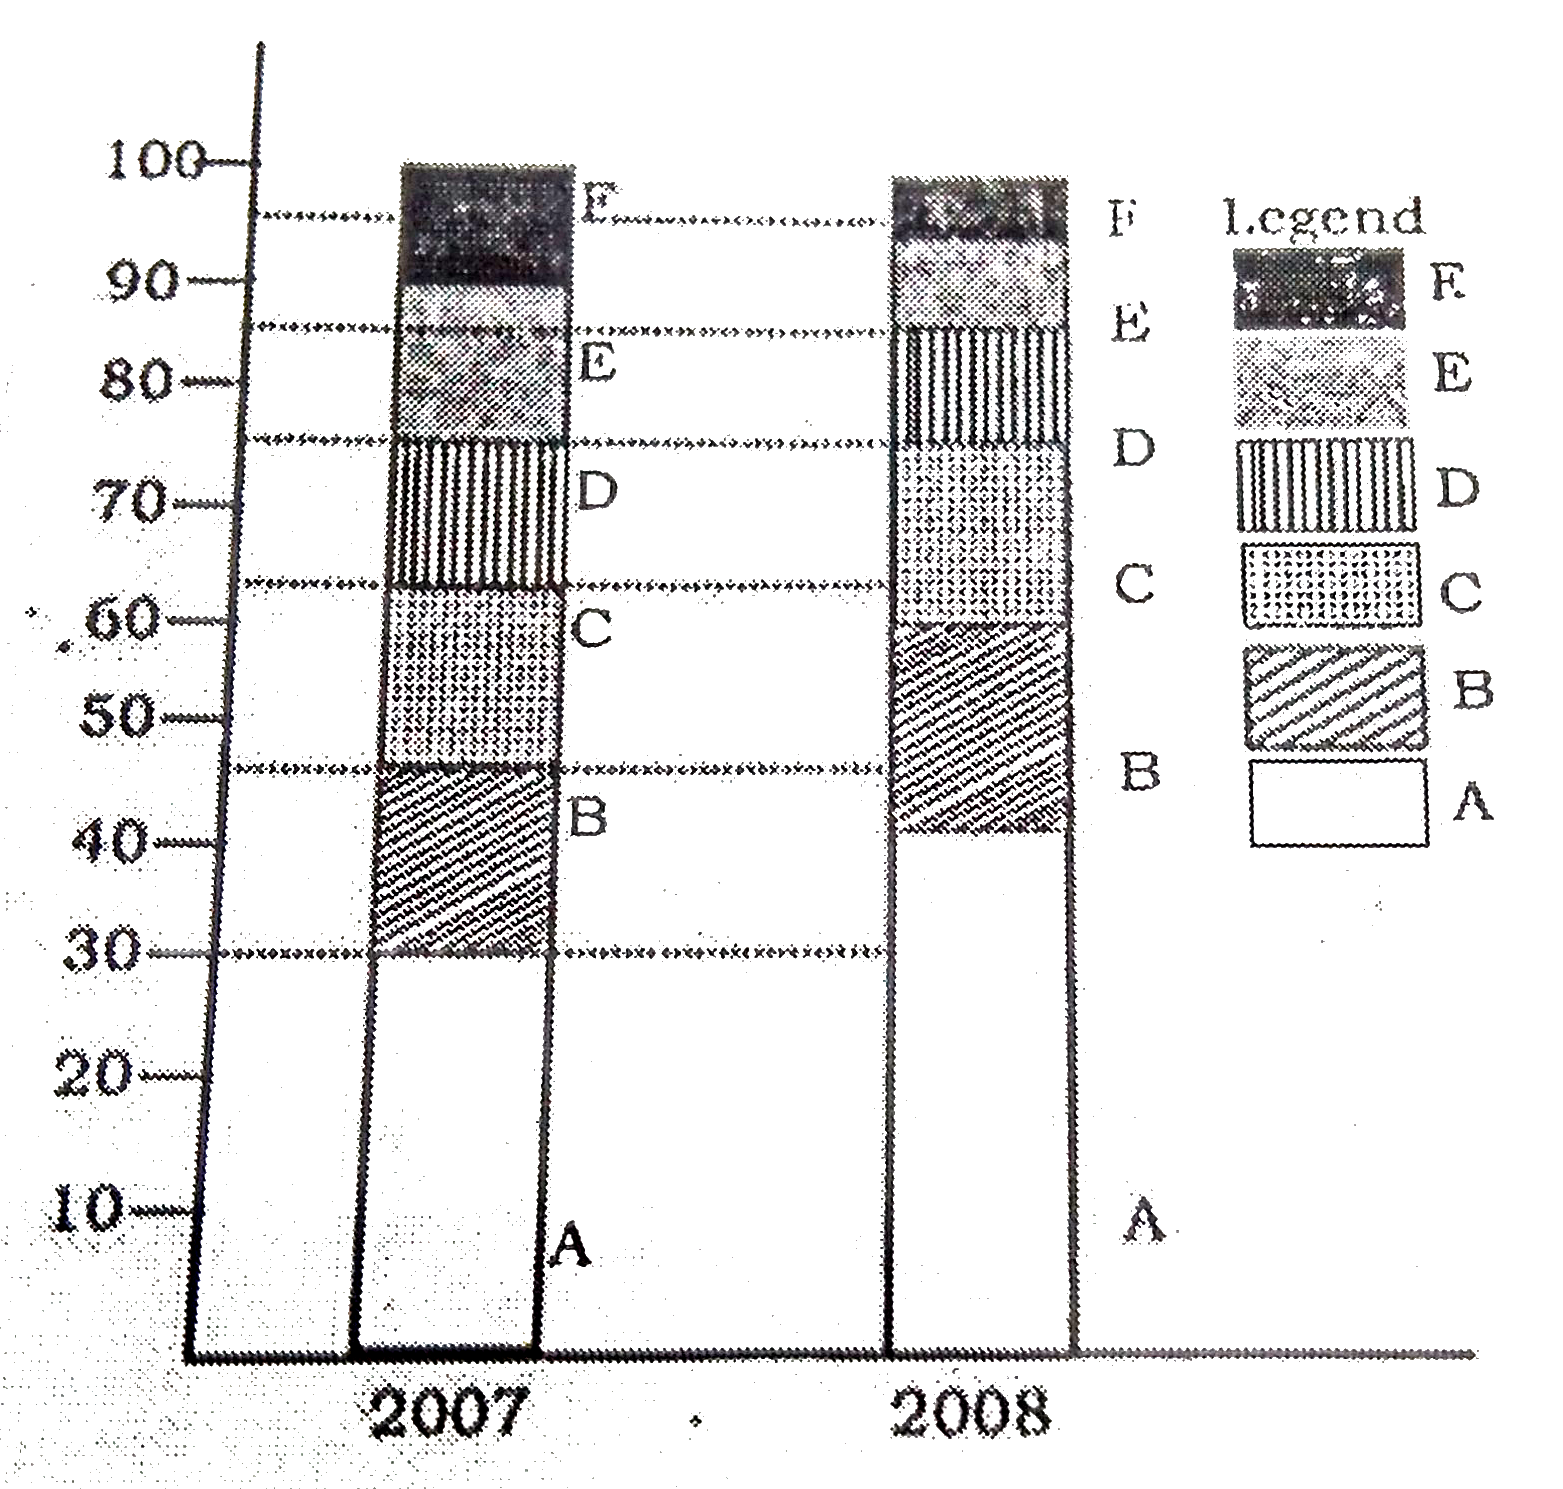
यदि A प्रकार के नमूनों का वर्ष 2008 तथा 2007 में उत्पादन प्रतिशत समान हो तो वर्ष 2008 में A प्रकार के नमूनों का कुल उत्पादन कितना था ।
View SolutionYear by a mobile manufacturer in the column diagram given below. 2007 And 2008 The percentage distribution of mobiles of different models is shown. Year 2007 Total production of mobile phones in 35 was a million and 2008 In that 44 was a million. Percentage of six different types of mobiles manufactured by a company in two years if year 2008 Percentage production of A type mobiles in a year 2007 If the year was equal to 2008 What would be the production of A type mobiles in
View SolutionThe bar chart given below shows the percentage distribution of the production of various models of a ,mobile manufacturing company in 2007 and 2008. The total production in 2007 was 35 lakh mobile phones and in 2008 the production was 44 lakh. Study the chart and answer the following questions.
If the percentage production of A type mobiles in 2008 was same as that in 2007, then the number of A type mobiles produced in 2008 would have been
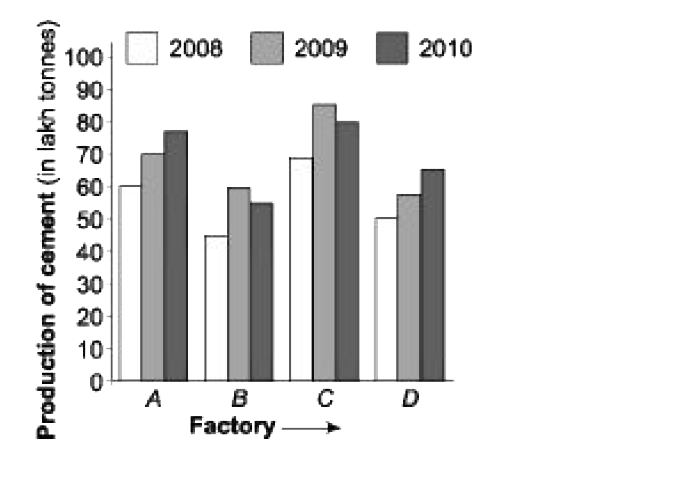
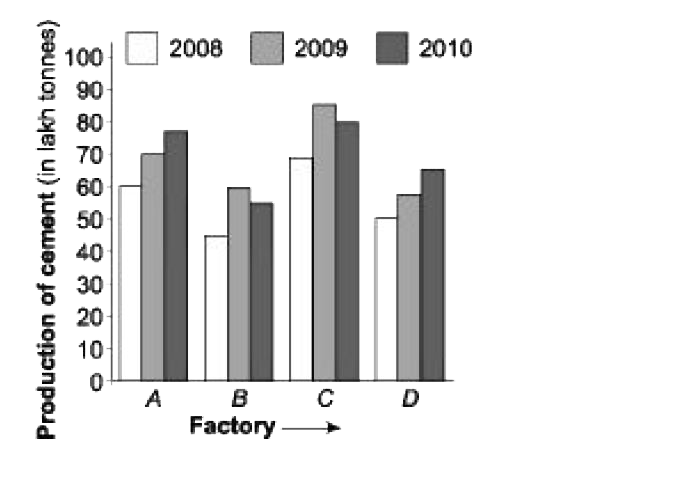
View SolutionWhich of the four factories has recorded the maximum percentage growth in production of cement from 2008 to 2009?
View SolutionThe bar chart given below shows the percentage distribution of the production of various models of a mobile manufacturing company in 2007 and 2008 The total production in 2007 was 35 lakh mobile phones and in 2008 the production was 44 lakh Study the chart and answer the following questions
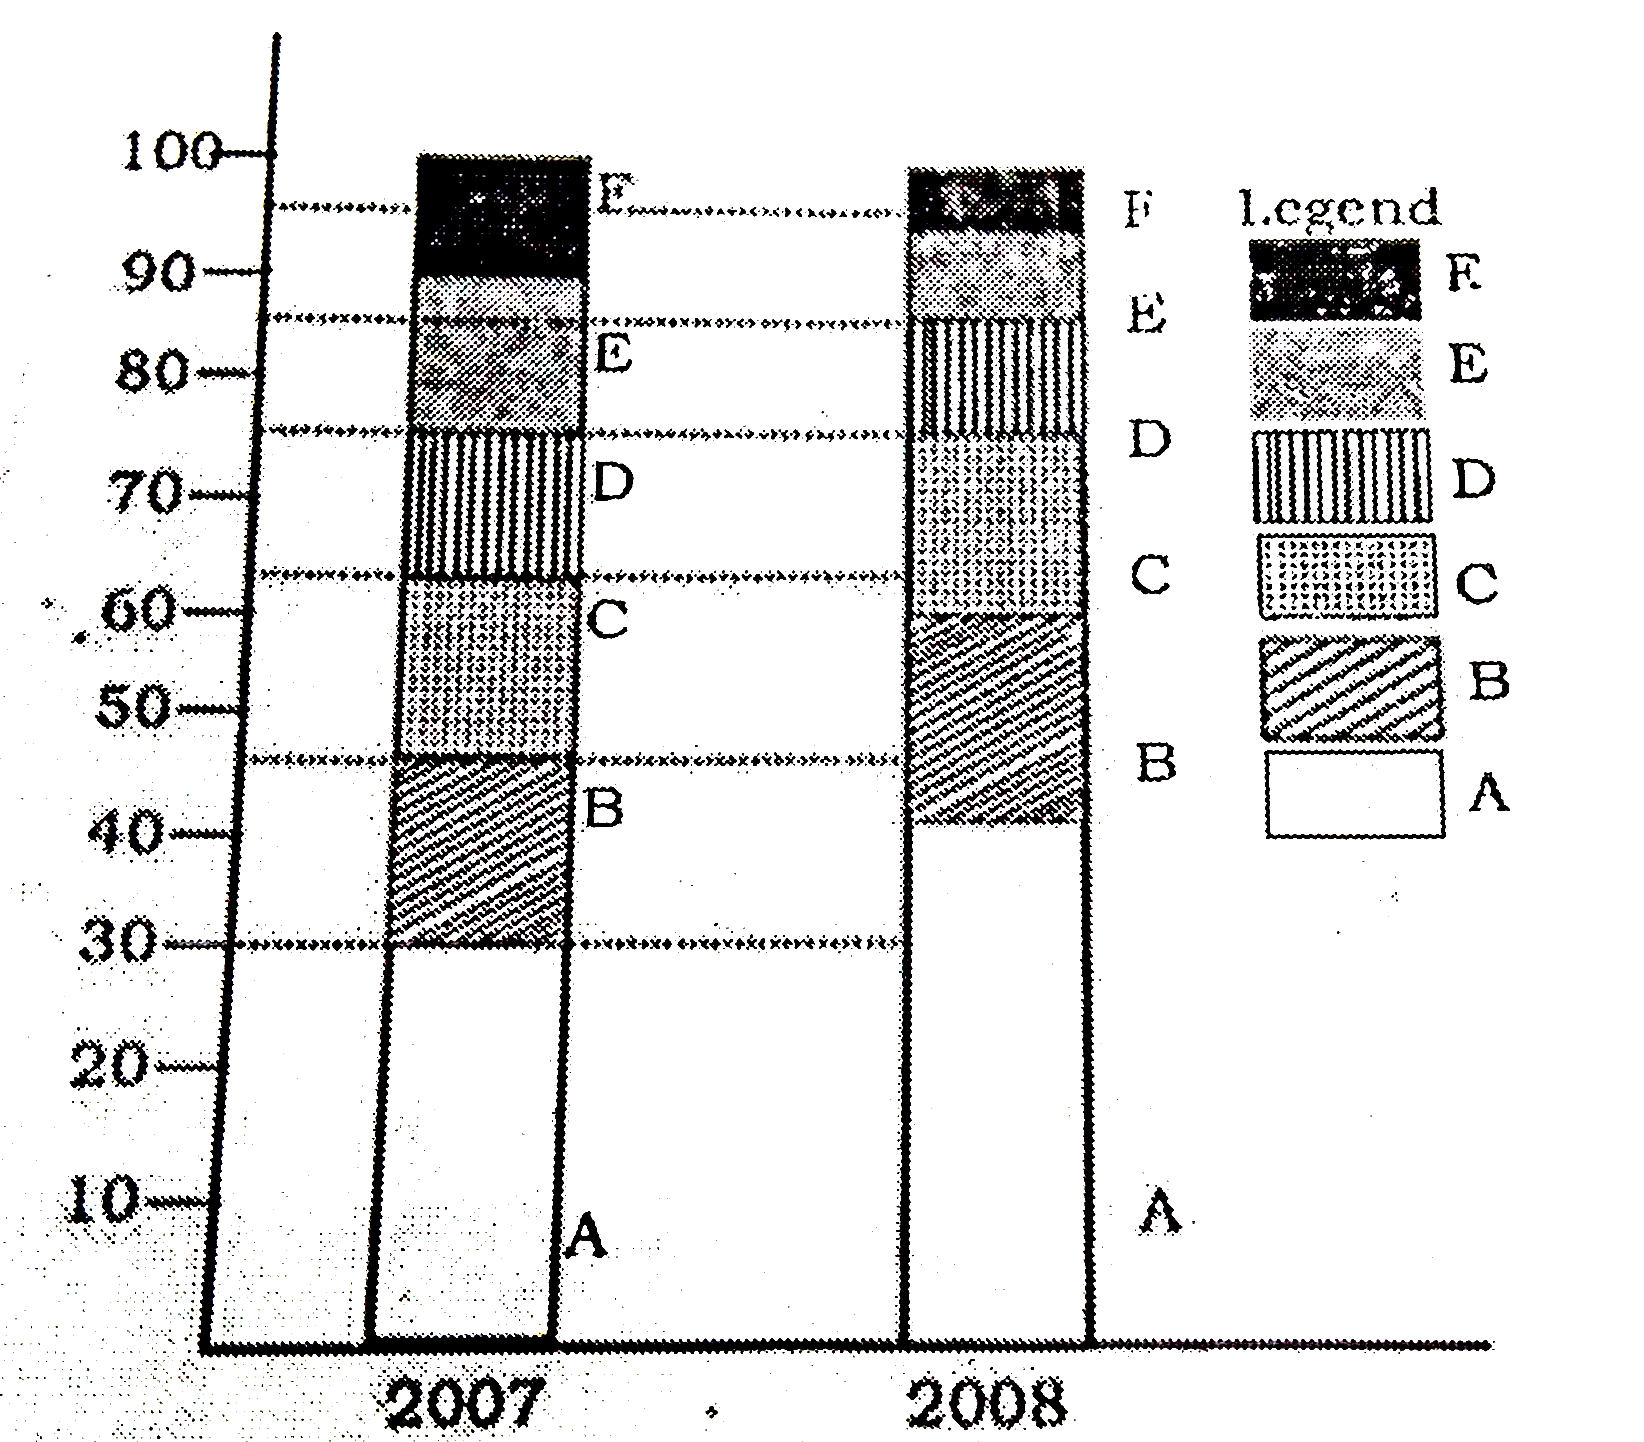
B प्रकार के नमूनों के उत्पादन की संख्या में वर्ष 2007 तथा 2008 में कितना अंतर हो ।
View SolutionYear by a mobile manufacturer in the column diagram given below. 2007 And 2008 The percentage distribution of mobiles of different models is shown. Year 2007 Total production of mobile phones in 35 was a million and 2008 In that 44 was a million. Percentage of six different types of mobiles manufactured by a company in two years Year 2007 What is the total number of mobiles of models A, B and E manufactured in India?
View SolutionYear by a mobile manufacturer in the column diagram given below. 2007 And 2008 The percentage distribution of mobiles of different models is shown. Year 2007 Total production of mobile phones in 35 was a million and 2008 In that 44 was a million. Percentage of six different types of mobiles manufactured by a company in two years Year 2007 and year 2008 What was the difference in the number of B type mobiles manufactured in
View SolutionThe bar graph given below shows the production (in tonnes) of rice of a country for the year to ?
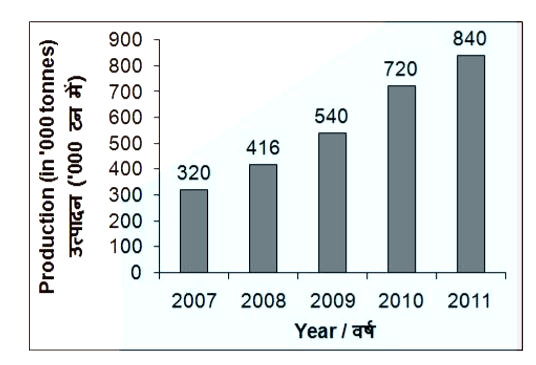
How much is the percentage increase in the production of rice in the year in comparison to year ?
View SolutionMr. Jones total annual gross salary, which was Rs. 10 lakhs per year in 2007 was reduced by 10% in 2008. In 2007 his family expenditure for food items was 40% of the total annual gross salary. The prices of average food items increased by 5% between 2007 and 2008. Assuming that the family consumed the same amount of food in 2008, the percentage expenditure on food items, calculated on total annual gross salary in 2008, is b. c. d.
View SolutionLet f(x)=(2007^(x))/(2007^(x)+sqrt(2007)) Then find the value of quad 2007^(x)+sqrt(2007)(1)/(2)+f((2)/(2008))+f((3)/(2008))+...+f((2007)/(2008))
View SolutionThe percentage increase in production of cement by factor B from 2008 to 2009 is about
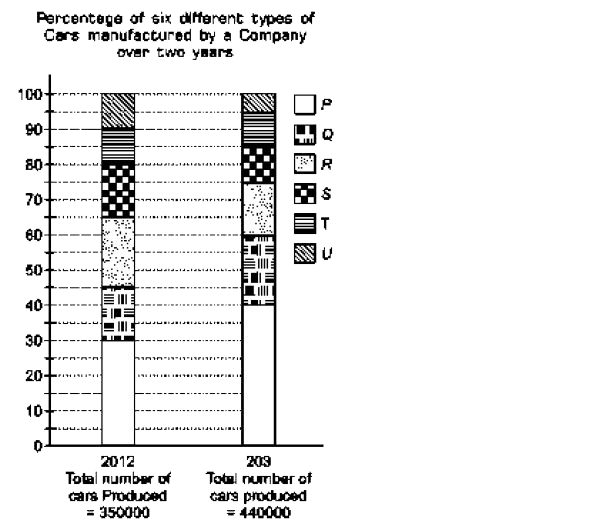
View SolutionFor which model the percentage rise/ fall in production from 2012 to 2013 was minimum?
View SolutionThe bar chart given below shows the percentage distribution of the production of various models of a mobile manufacturing company in 2007 and 2008 The total production in 2007 was 35 lakh mobile phones and in 2008 the production was 44 lakh Study the chart and answer the following questions
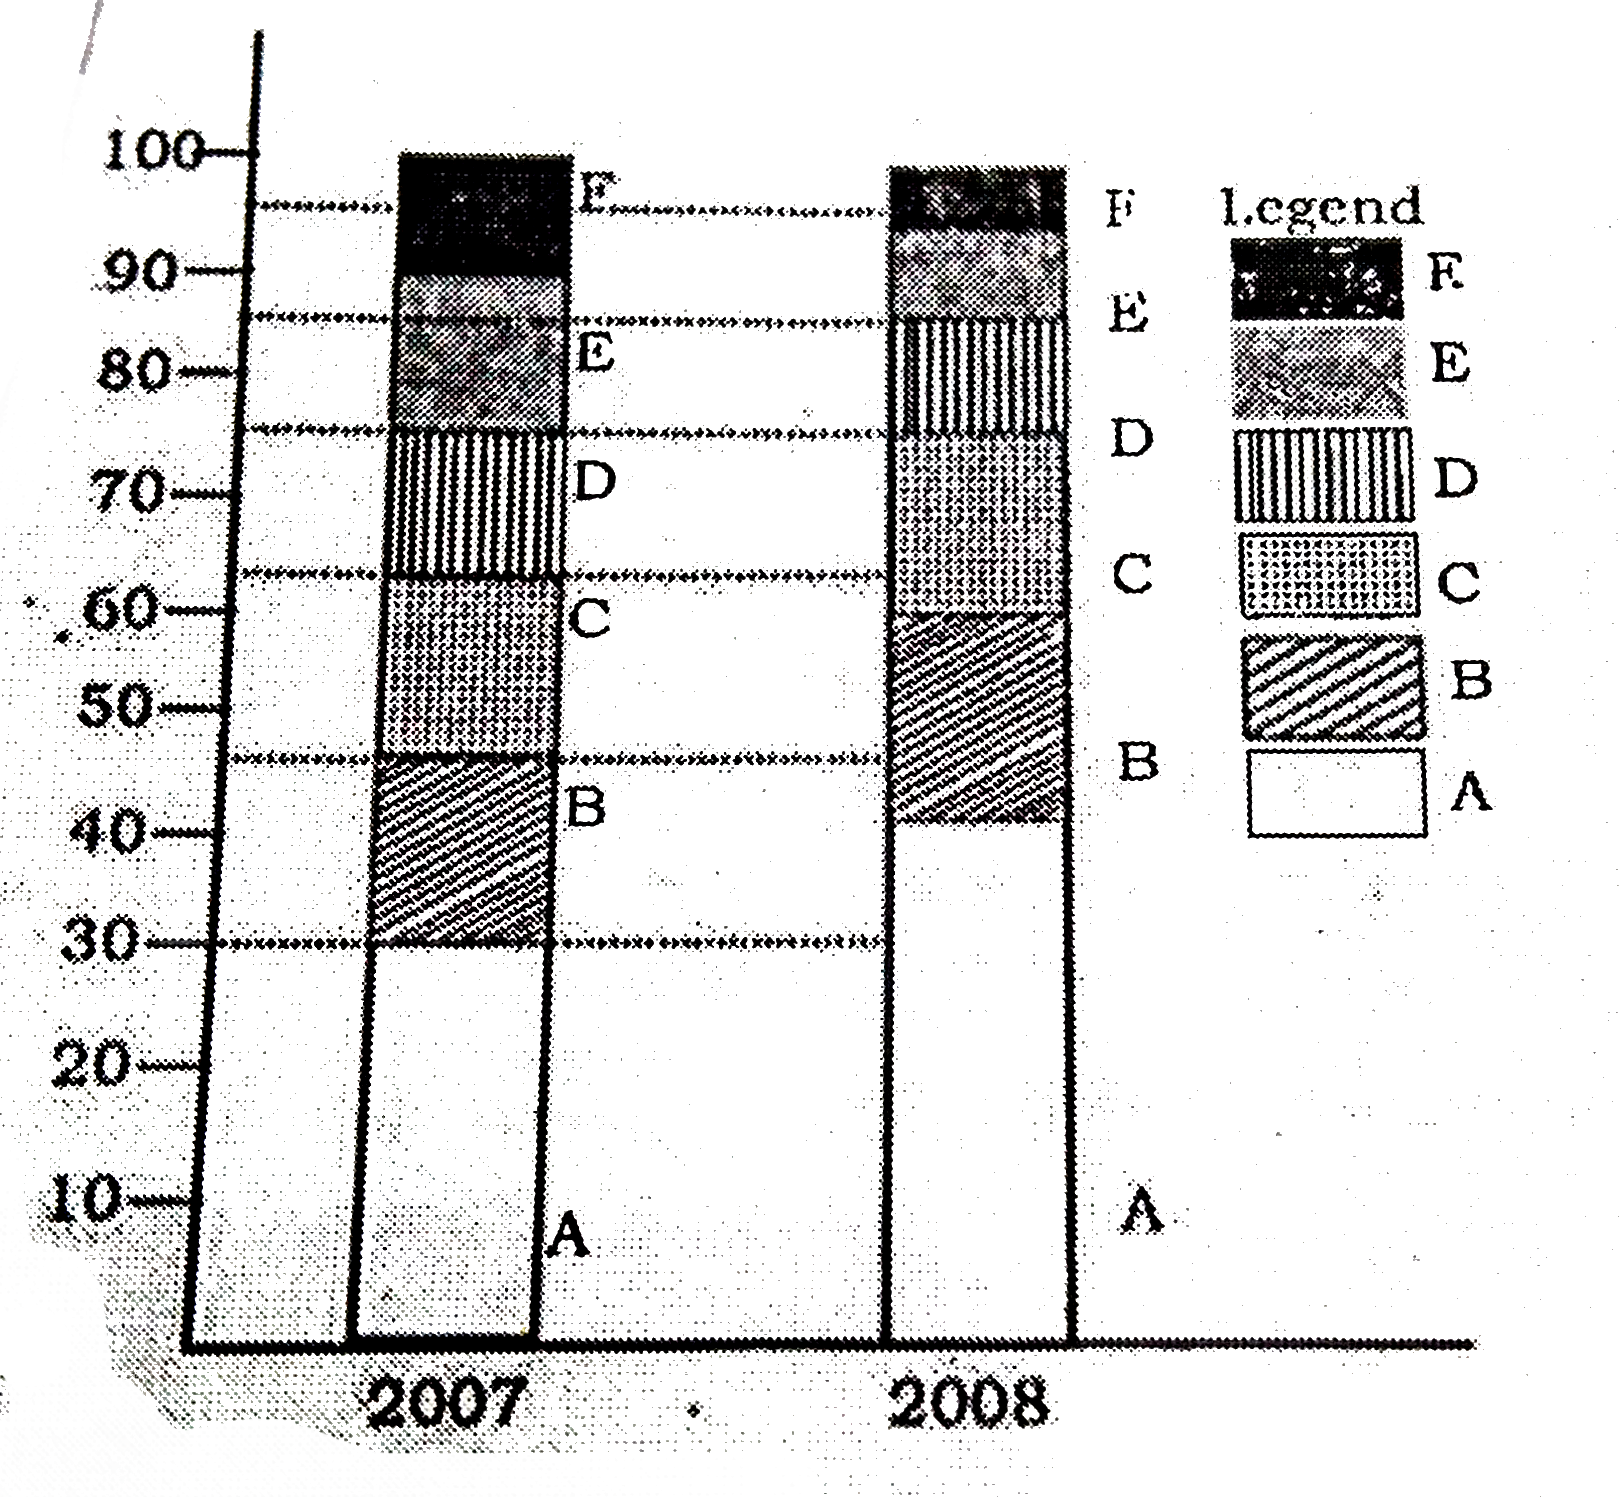
वर्ष 2007 में मॉडल A, B तथा E का कुल उत्पादन कितना है ।
View SolutionThe percentage of the total production of flavour R in 2007 and 2008 with respect to the production of flavour P in 2005 and 2006 is : वर्ष 2007 तथा 2008 में गन्ध R का कुल उत्पादन, वर्ष 2005 तथा 2006 में गन्ध P के उत्पादन की तुलना में कितने प्रतिशत रहा है?
View Solution