If the difference between the two expenditures is represented by 180 0 in the pie-chart then these expenditures possibly are:
1 Binding Cost and Promotion Cost
2 Paper Cost and Royalty
3 Binding Cost and Printing Cost
4 Paper Cost and Printing Cost
Answer : 4. "Paper Cost and Printing Cost"
Related Solutions
The following pie diagram show the expenditure incurred on the preparation of a book by a publisher under various heads - (A)paper 20 percent (B) printing 35% (C) binding canvassing designing etc. 30% (D)miscellaneous 10% (E)royalty 15%
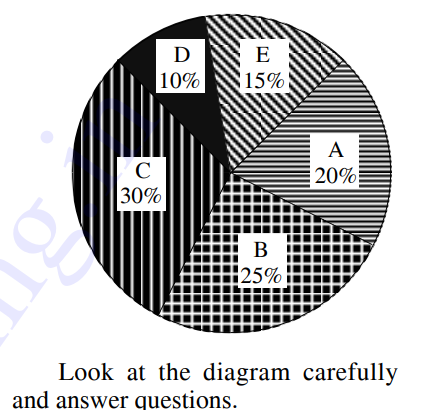
If the difference between two expenditures be represented by in the pie-diagram these expenditures are ----View SolutionGiven pie chart shows the expenditure of a country If the total expenditure of thecountry is Rs 180 crores, then what is the expenditure on agriculture ?Security
View SolutionThe given pie chart shows the expenditure in crores on each game. In the given pie chart, what is the difference between the expenditure on cricket and football?
View SolutionThe given pie chart depicts the expenditure incurred in crores towards each sport. In the given pie chart what is the difference between the expenditure incurred on cricket on football
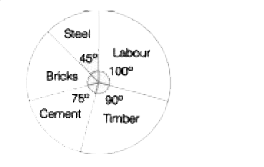
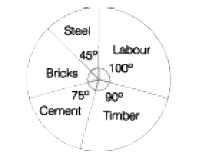
View SolutionThe following pie chart represents a total expenditure of 540000 on different items in constructing a flat in a town. The expenditure (in ?) on bricks is
 View Solution
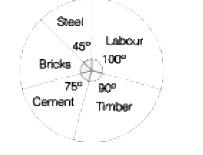
The following pie chart represents a total expenditure of 540000 on different items in constructing a flat in a town. Which is the item of maximum expenditure?
 View Solution
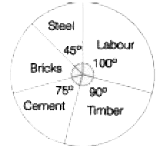
The following pie chart represents a total expenditure of 540000 on different items in constructing a flat in a town. The expenditure (inT)on cement is
 View Solution
The following pie chart represents a total expenditure of 540000 on different items in constructing a flat in a town. The expenditure on bricks is less than the expenditure on timber (in ?)
 View Solution
The given pie chart shows expenditure on different type of sport in a particular year . Study the pie chart and answer the question below
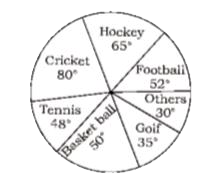
IF in a year the expenditure on sport was 18000000 then expenditure on tennis was how much more than expenditure on golf.View SolutionThe pie-chart given in Figure, represents the expenditure on different items in constructing a flat in a metro city.
(i)Find the percentage expenditure on different items by reading the pie-chart. (ii) If the cost of flat is Rs. 5,40,000, Find the following: (i)The expenditure incurred on steel and cement separately. (ii)Difference of expenditure incurred on timber and bricks.View SolutionThe given pie chart shows the expenditure in crores on each game. In the given pie chart, what is the ratio of expenditure between Hockey and Gymnastics?
View SolutionThe given pie chart depicts the expenditure incurred in crores towards each sport. In the given pie chart what is the ratio of expenditure between hockey and gymnastics?
View SolutionThe following pie chart shows percentage expenditure of a country on different heads .The total expenditure is Rs. 1,680 (in billions).Study the chart and answer the question. The central angle of the sector representing expenditure on Subsidy is :
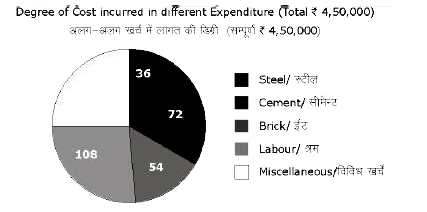
View SolutionIn the given pie chart the expenditure on steel is what percent of the expenditure on cement
 View Solution
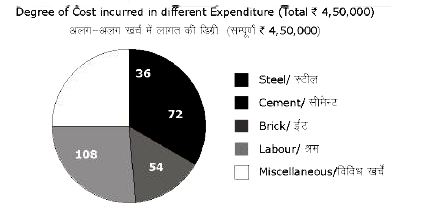
दिए गए पाई चार्ट में, स्टील पर किया गया सीमेंट पर किये गए व्यय का कितना प्रतिशत है ?
 View Solution
The expenditure of a person on various items for a month was as follows - In the pie chart representing these figures, who will be the sector showing expenditure on other items?
View SolutionThe pie-chart shown in Figure represents the expenditures of a family on different items.If the total annual income of the family is Rs.75,000, Find the expenditure on children education and also find savings by reading the pie-chart.
View SolutionThe given pie chart shows expenditure on different type of sport in a particular year . Study the pie chart and answer the question below
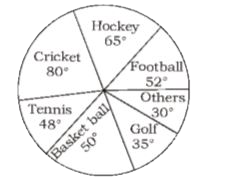
IF total expenditure on sport was Rs 24000000 then total expenditure on cricket and football will beView SolutionThe given pie chart shows expenditure on different type of sport in a particular year. Study the pie chart and answer the question below
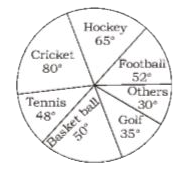
Expenditure on hockey was how much percent more than expenditure on basketball.View SolutionRead the following pie-chart carefully and andswer the question.
Degree of amount incurred in different Expenditure Total Expenditure = Rs. 43,200
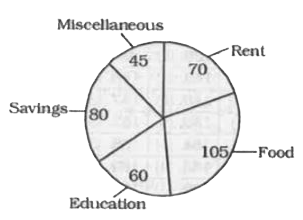
In the given pie-chart, what is the total expenditure on rent?View Solution
