Study the pie - chart carefully to answer the questions below : The Pie chart shows the percentage quantity of fruits at two fruit shops A and B 1. What is th
null
null
null
null
Answer : Explanation :1. Answer : 1 Explanation : Quantity of Guava at Shop A = 1200×10100 = 120
Related Solutions
The following pie chart shows the percentage quantity of fruits at two fruit shops A and B. If the price of apple is Rs50 per kg and that of orange of is Rs 25 kg. then what is the ratio their costs at shop A ?
View SolutionThe given pie-chart, shows the percentage distribution of the expenditure incurred in publishing a book. Study the pie-chart and the answer the questions based on it
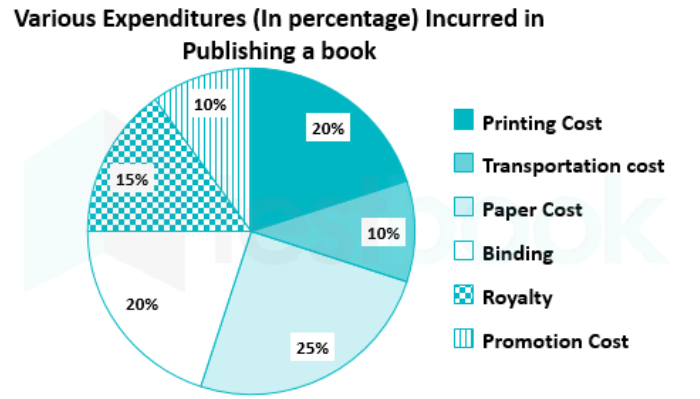
In the given pie-chart by what percentage the Promotion cost on the book is less than the Paper cost?
View SolutionThe given pie chart shows the percentage distribution of the expenditure incurred in publishing a book study the pie chart and the answer the question based on it.
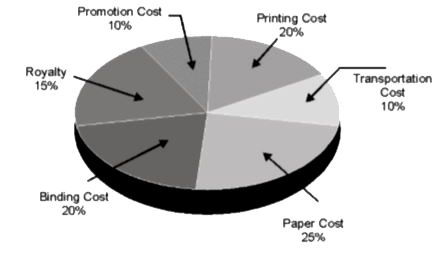
In the given pie chart by what percentage the promotion cost on the book is less than the paper cost?
View SolutionThe given pie chart shows the percentage distribution of the expenditure incurred in publishing a book study the pie chart and the answer the question based on it. IN the given pie chart, by what percentage the royalty on the book is less than the printing cost
View SolutionStudy the following pie chart carefully and answer the questions. The pie chart represents the percentage of people involved in various occupations.
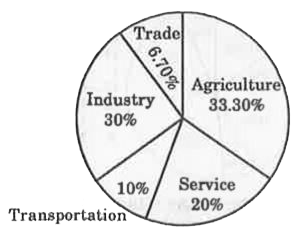
The ratio of the people involved in service to that in industry is
View SolutionStudy the following pie chart carefully and answer the questions. The pie chart represents the percentage of people involved in various occupations.
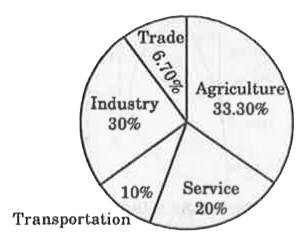
The angle made by the people involved in service in the given pie-chart is
View SolutionStudy the following Pie-Chart carefully to answer the questions given below.
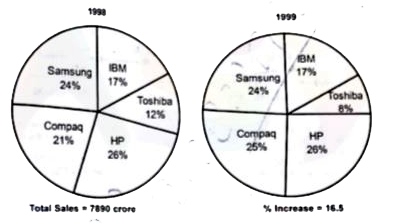
The percentage increase/decrease in the sales of Toshiba in 1999 is approximately-
View SolutionStudy the given pie chart carefully and answer the question based on it. Pie chart show below gives the expenditure (in percentage) on various items and savings of a family during a month. On which item, the expenditure was minimum ?
View SolutionStudy the given pie chart carefully and answer the question based on it. Pie chart show below gives the expenditure (in percentage) on various items and savings of a family during a month. Expenditure on which item is equal to the total savings of the family ?
View SolutionStudy the given pie chart carefully and answer the question based on it. Below pie chart given the expenditure (in percentage) on various items and savings of a family during a month. Expenditure on which item is equal to the total savings of the family?
View SolutionThe given pie chart shows the percentage distribution of 450 employees in an organisation. Study the pie chart and answer the question that follows. What is the number of employees working in departmetn B?
View Solutionदिए गए पाई चार्ट में 150 दाताओं के ब्लड ग्रुप A,B,O,AB के आंकडों को दर्शाया गया है । पाई चार्ट का अध्ययन कीजिए और प्रश्नों का उत्तर दीजिए
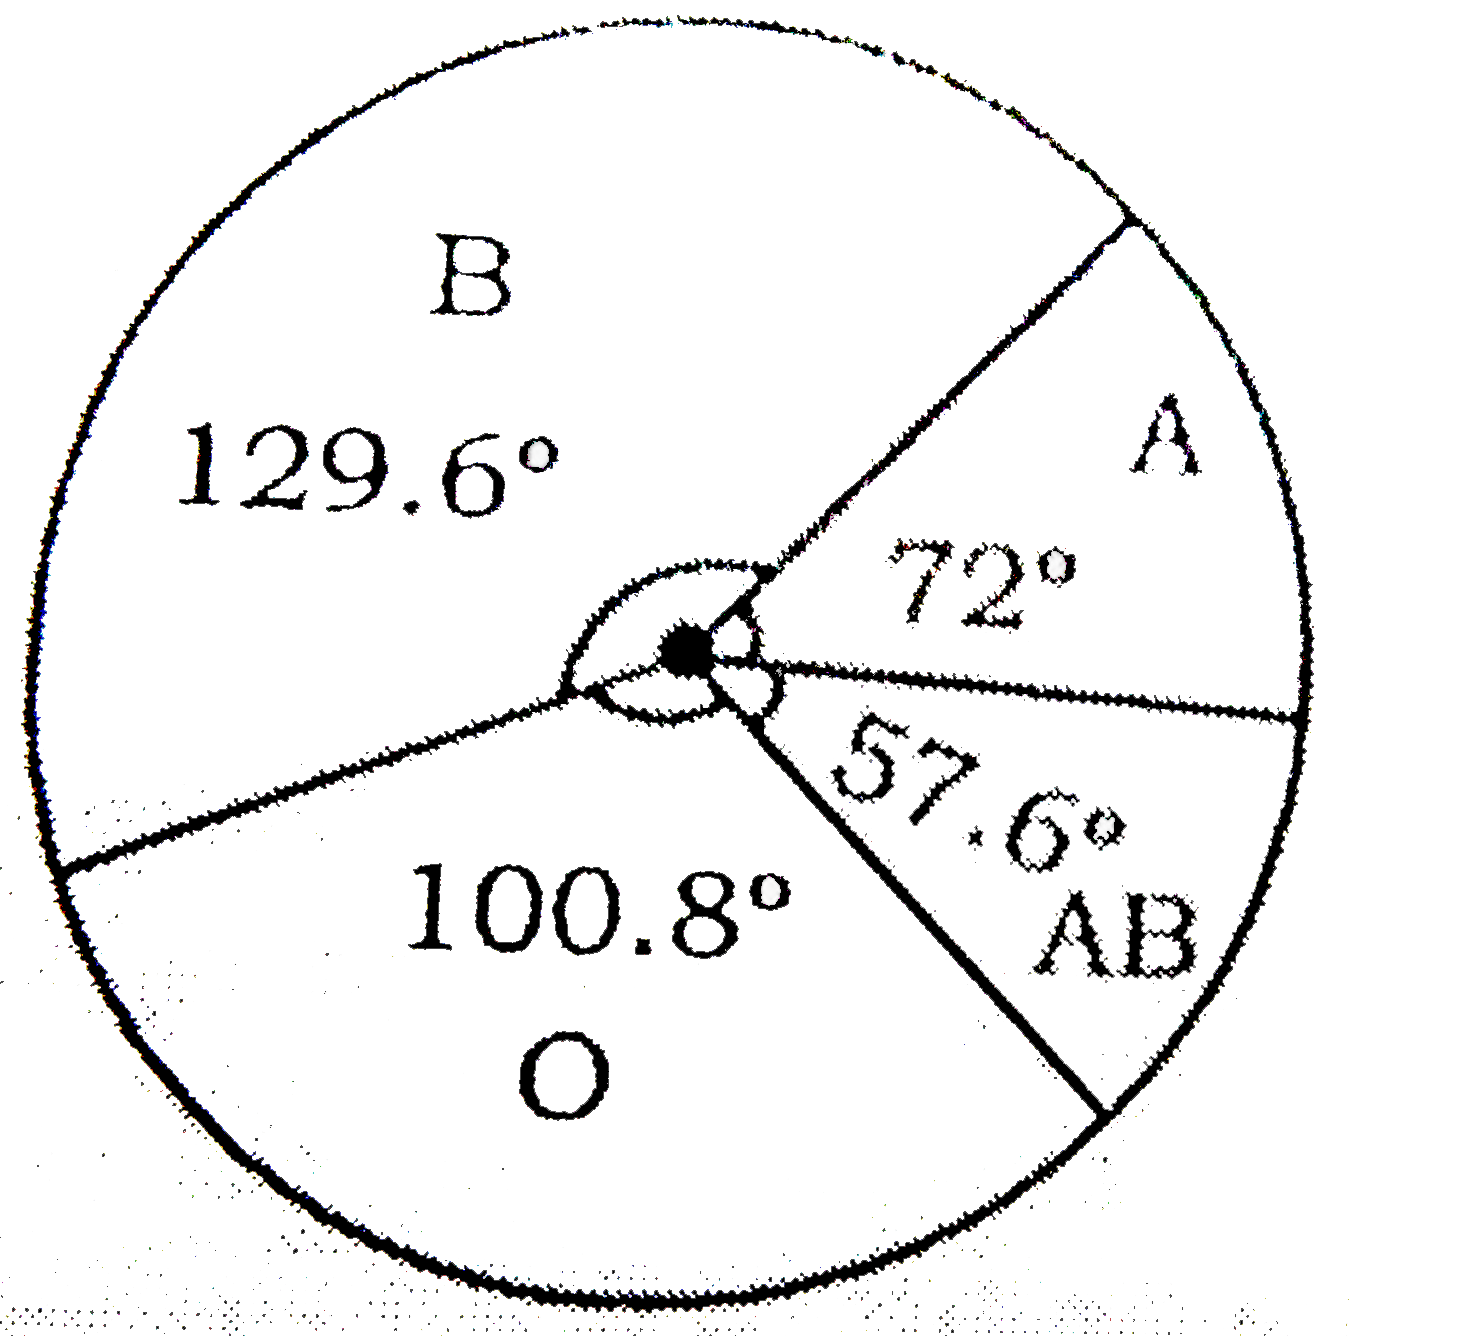
ऐसे दाताओं का प्रतिशत बताइए जिनका ब्लड ग्रुप है ?
View SolutionStudy the Pie chart carefully and answer the questions.
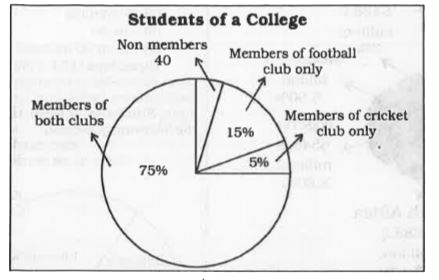
Percentage of students who are not members of any club is :
View SolutionStudy the following Pie-Chart carefully to answer the questions given below.
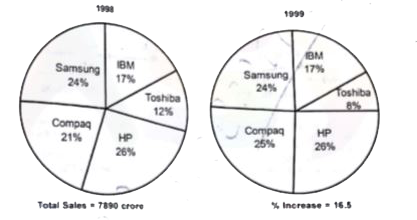
IBM's sales in 1998 is what percentage of the sales of Samsung in 1999 ?
View Solutionनिम्नलिखित पाई -चार्ट में विभीनन व्यवसायों को प्रतिशत दर्शाया गया है। पाई - चार्ट का ध्यानपूर्वक अध्ययन कीजिये और प्रशन संख्या 485, से 488, का उतर दीजिये। लोगो की कुल संख्या =20000,
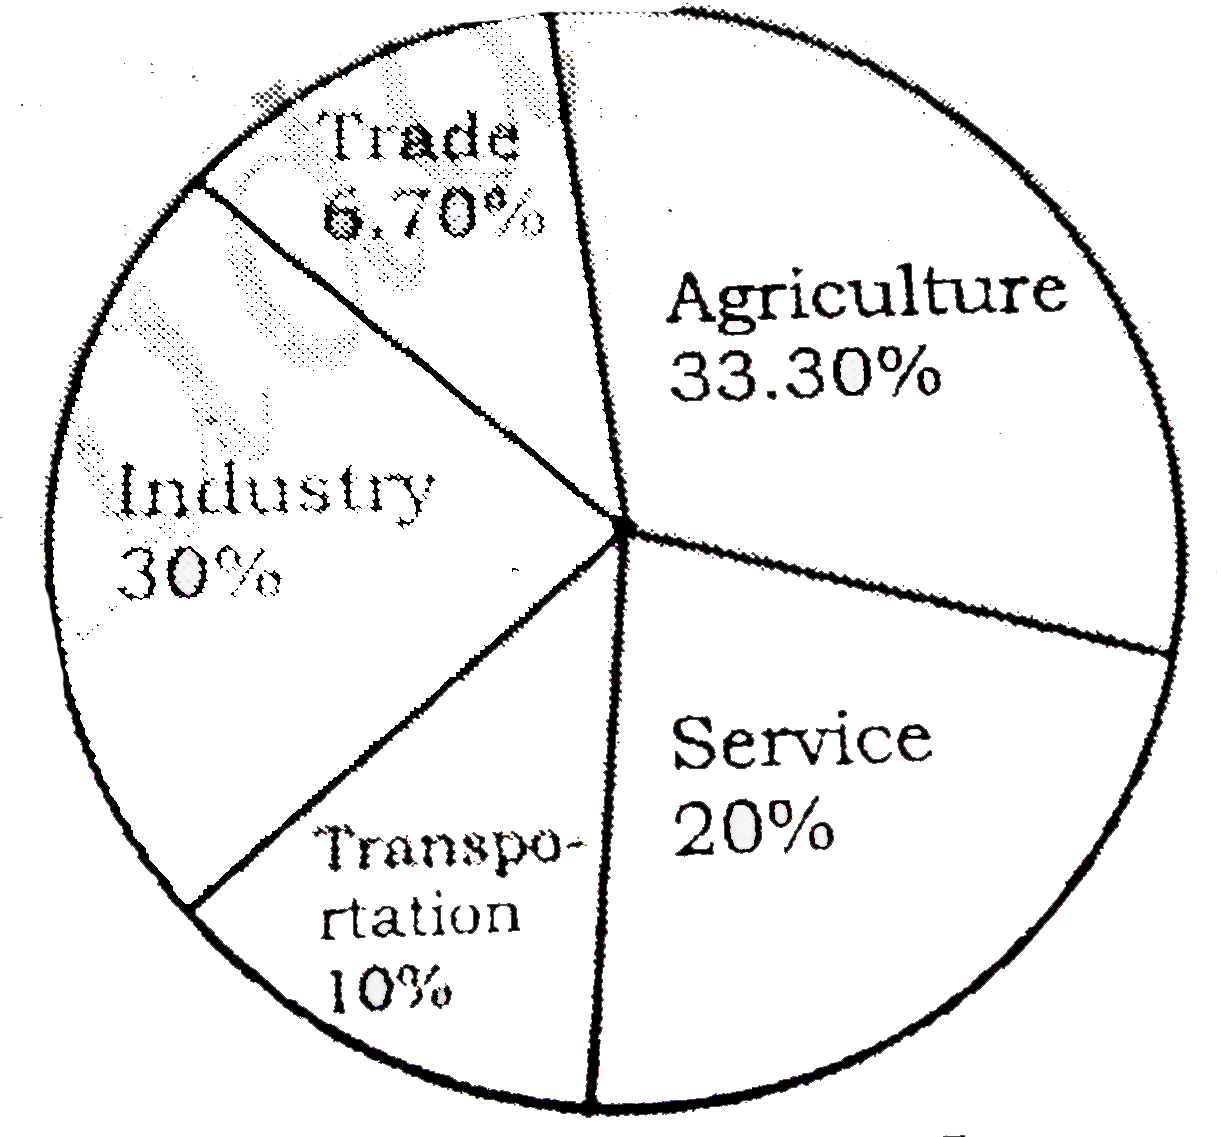
व्यापार की तुलना में सेवा में शामिल लोगो की संख्या कितनी है?
View SolutionThe pie chart given below shows the expenditure on various items and savings of a family during the year 2009. Study the pie chart and answer these questions. The percentage of the income which was spent on clothing, education of children and transport together is-
View SolutionStudy the chart and answer the question based, on the pie chart. The pie chart given below shows expenditures incurred by a family on various items and savings in a month. Savings of the family is ₹ 8,000 in a month. What is the total expenditure of the family for the month ?
View SolutionThe following questions arfe based on the pie-chart given below. Study the pie-chart and answer the questions.
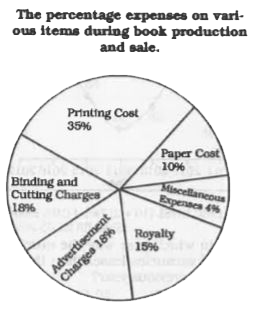
If the 'Printing-Cost' is Rs 17500, the royality paid is
View SolutionThe following questions arfe based on the pie-chart given below. Study the pie-chart and answer the questions.
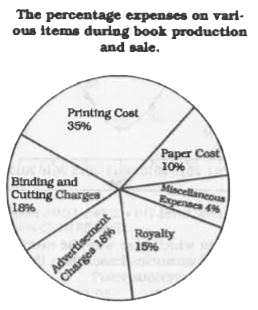
The central angle for the sector on ''Paper-Cost'' is
View SolutionPie charts shows the expenses on various heads in construction of a house. Study the pie-chart.
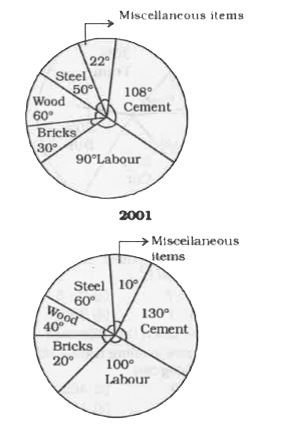
What percentage of the total amount is being spent on cement in 1991 ?
View Solution