Direction 47-50:The following pie chart shows proportion of the population of seven villages n 2009. Study the pie chart and answer question that follows: If the following poverty line population of
1 18500
2 20500
3 22000
4 20000
Answer : 3. "22000"
Related Solutions
The following pie chart shows proportion of population of seven villages in 2009. Study the pie chart and answer the questions that follow :
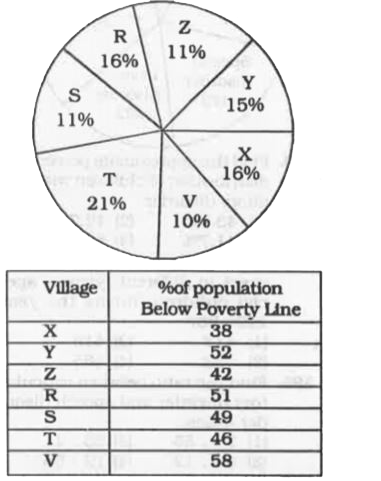
If ratio of the below poverty line population of the village 'T' to that of the below poverty line population of village 'Z' is
View SolutionThe following pie chart shows proportion of population of seven villages in 2009. Study the pie chart and answer the questions that follow :
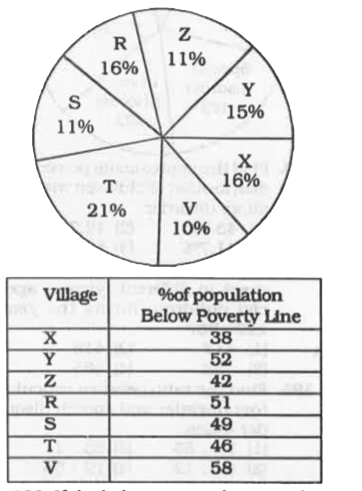
If the population of the village 'R' is 32000, then the below poverty line population of village 'Y' is
View SolutionThe following pie chart shows proportion of population of seven villages in 2009. Study the pie chart and answer the questions that follow :
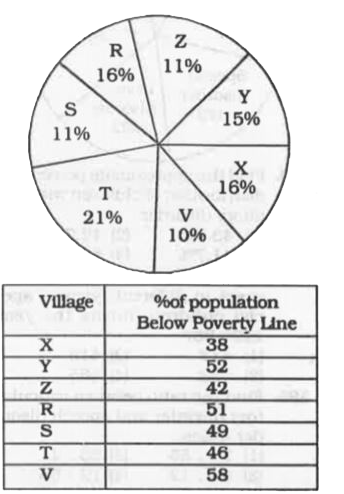
If the below poverty line population of the village 'X' is 12160, then the population of village 'S' is
View Solutionनिम्नलिखित पाइ-चार्ट में 2009 में सात गॉवो की आबादी का अनुपात दर्शाया गया है । पाइ-चार्ट का अधयन कीजिये और निम्नलिखित प्रशनो का उत्तर दीजिये ?
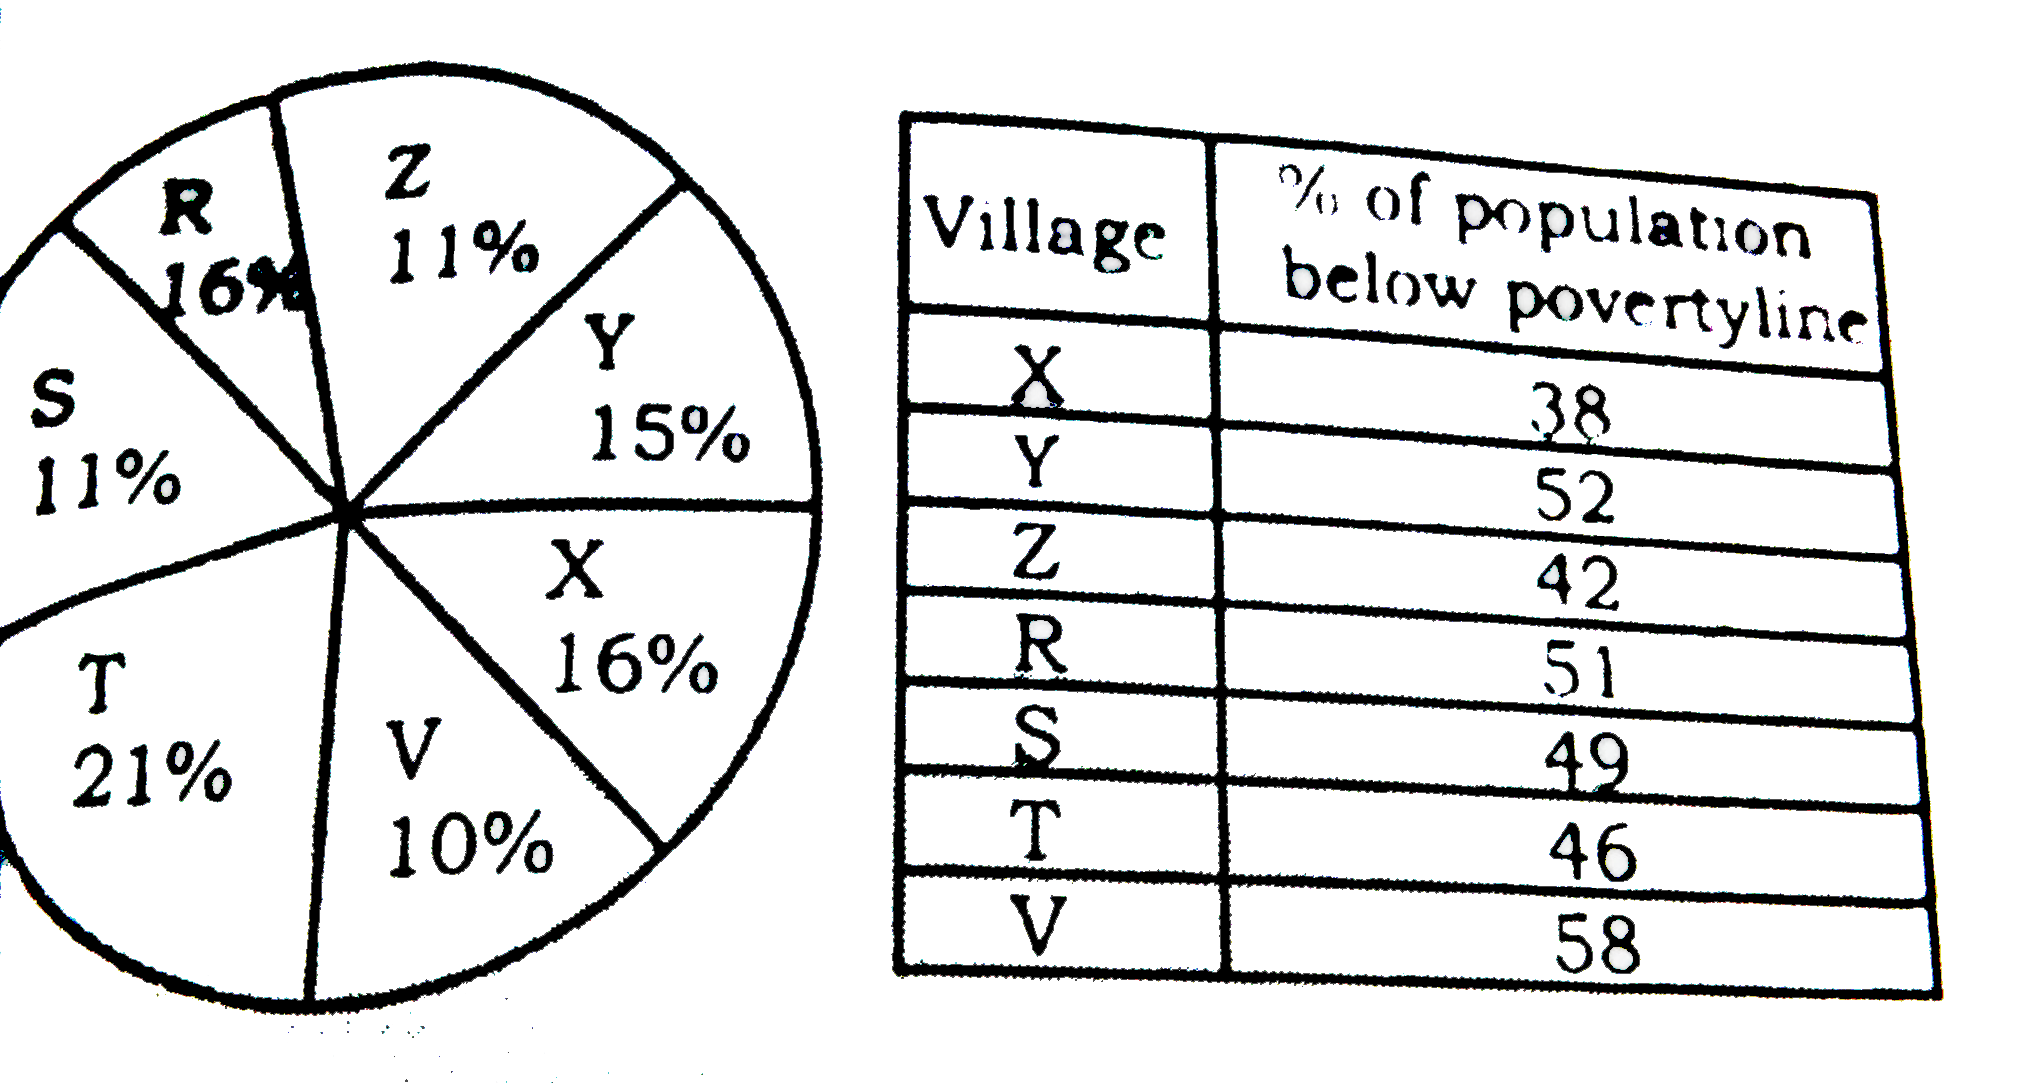
गॉव 'T' की गरीबी रेखा से नीचे की आबादी तथा गॉव 'Z' की रेखा से नीचे की आबादी का अनुपात कितना है ?
View Solutionनिम्नलिखित पाइ-चार्ट में 2009 में सात गॉवो की आबादी का अनुपात दर्शाया गया है । पाइ-चार्ट का अधयन कीजिये और निम्नलिखित प्रशनो का उत्तर दीजिये ?
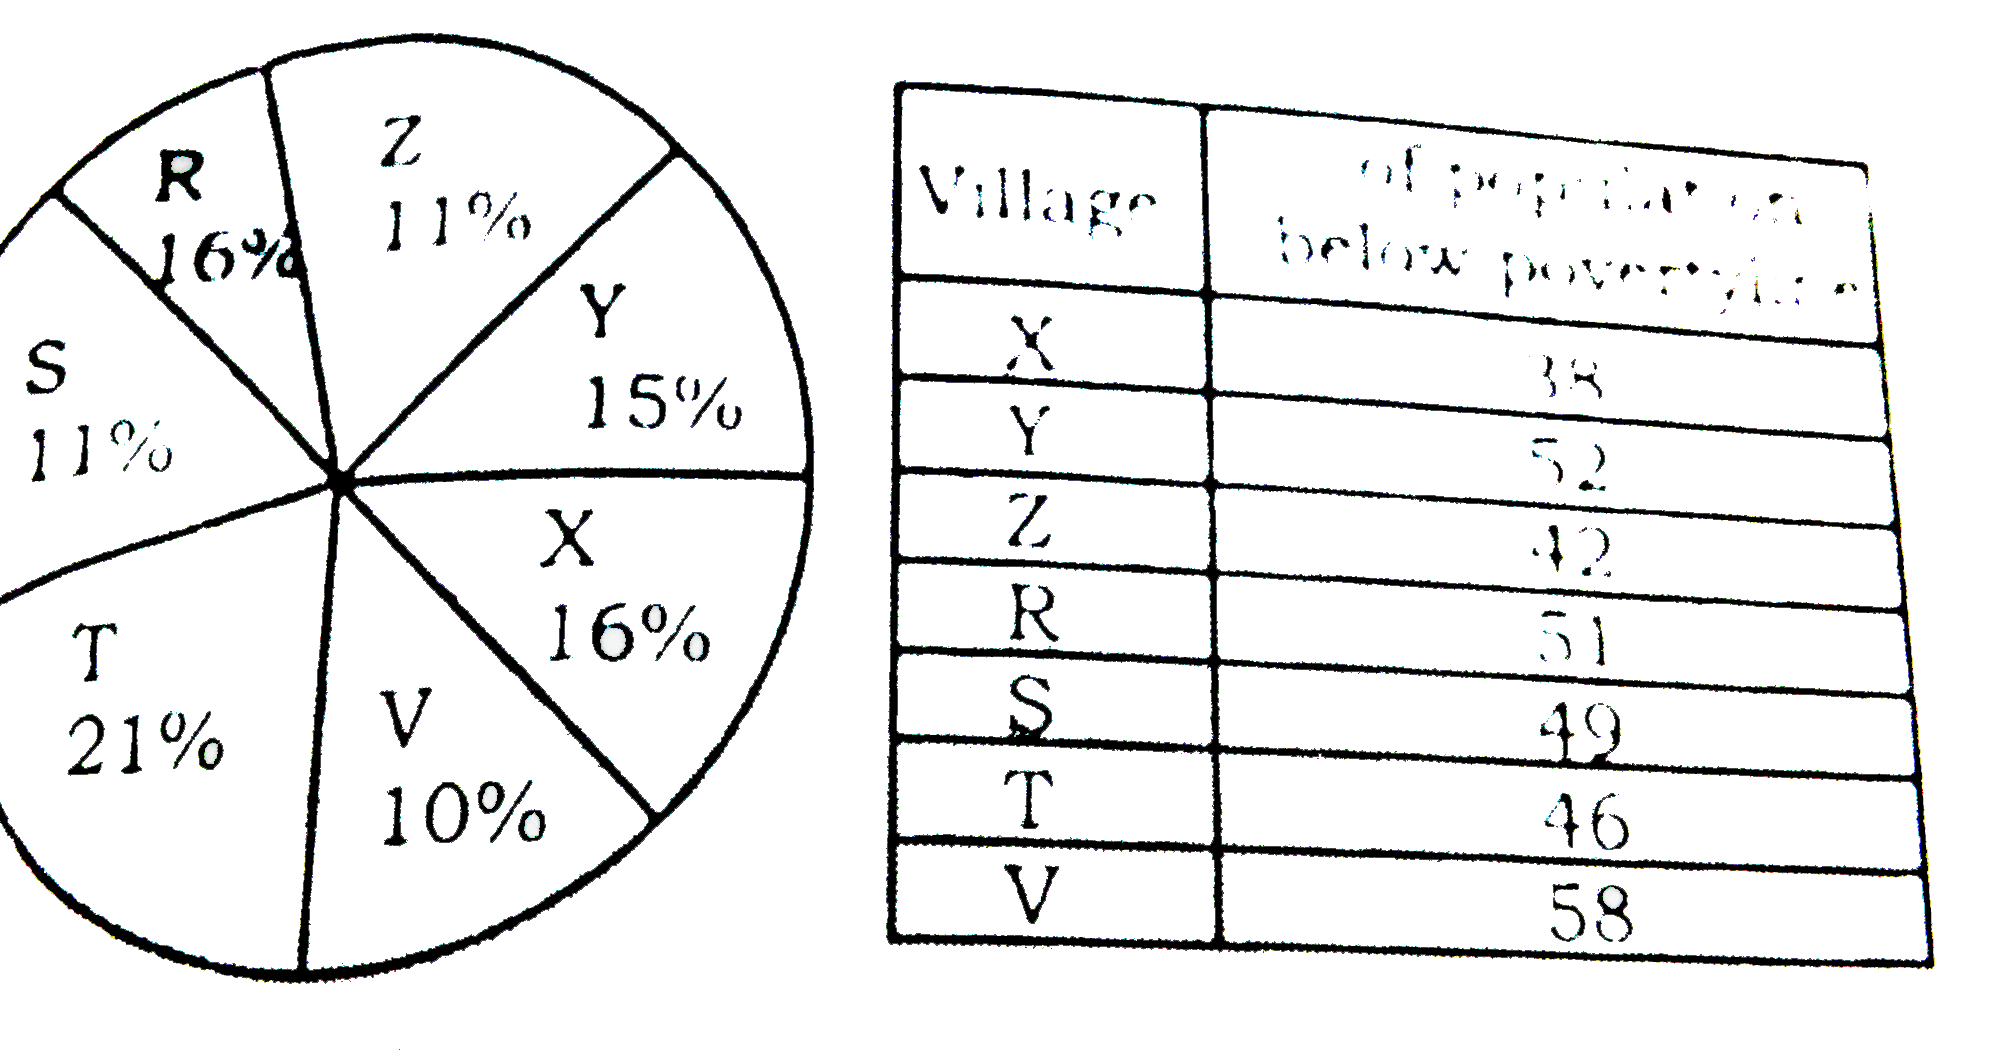
यदि गॉव 'R' की आबादी 32000 है तो गॉव 'Y' की गरीबी रेखा से नीचे की आबादी कितनी है ?
View Solutionनिम्नलिखित पाइ-चार्ट में 2009 में सात गॉवो की आबादी का अनुपात दर्शाया गया है । पाइ-चार्ट का अधयन कीजिये और निम्नलिखित प्रशनो का उत्तर दीजिये ?
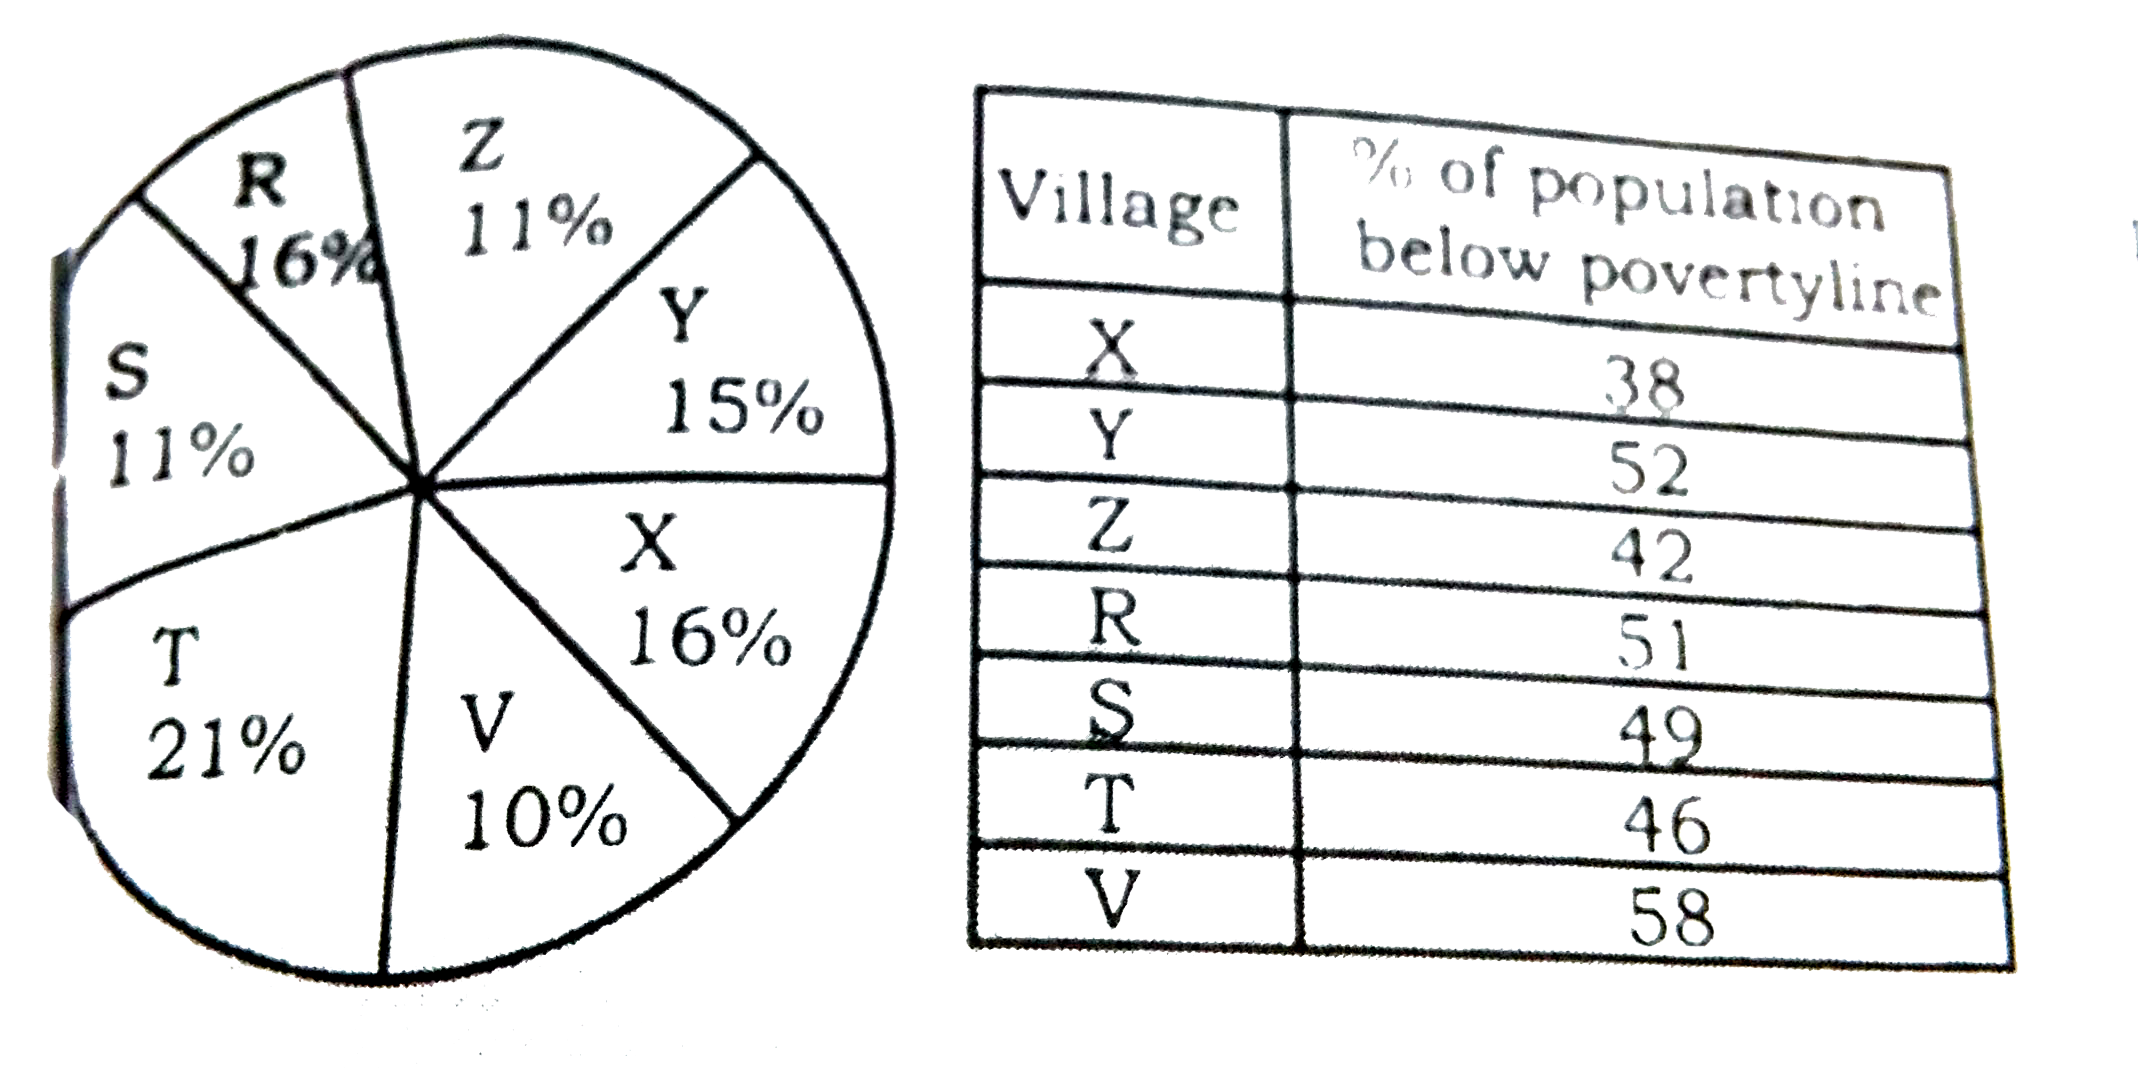
यदि गॉव 'X' की गरीबी रेखा से नीचे की आबादी 12160 है तो गॉव 'S' की आजादी कितनी होगी ?
View SolutionThe following pie chart shows proportion of population of seven villages in 2009. Study the pie chart and answer the questions that follow :
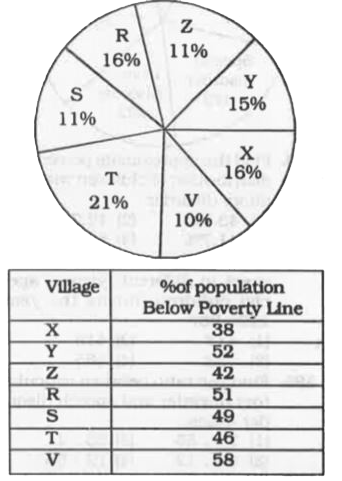
In 2010, the population of 'Y' and 'V' increases by 10% each and the percentage of population below poverty line remains unchanged for all the villages. If in 2009, the population of villages Y was 30,000, then the below poverty line population of village 'V' in 2010 is ____
View Solutionनिम्नलिखित पाइ-चार्ट में 2009 में सात गॉवो की आबादी का अनुपात दर्शाया गया है । पाइ-चार्ट का अध्ययन कीजिये और निम्नलिखित प्रशनो का उत्तर दीजिये ?
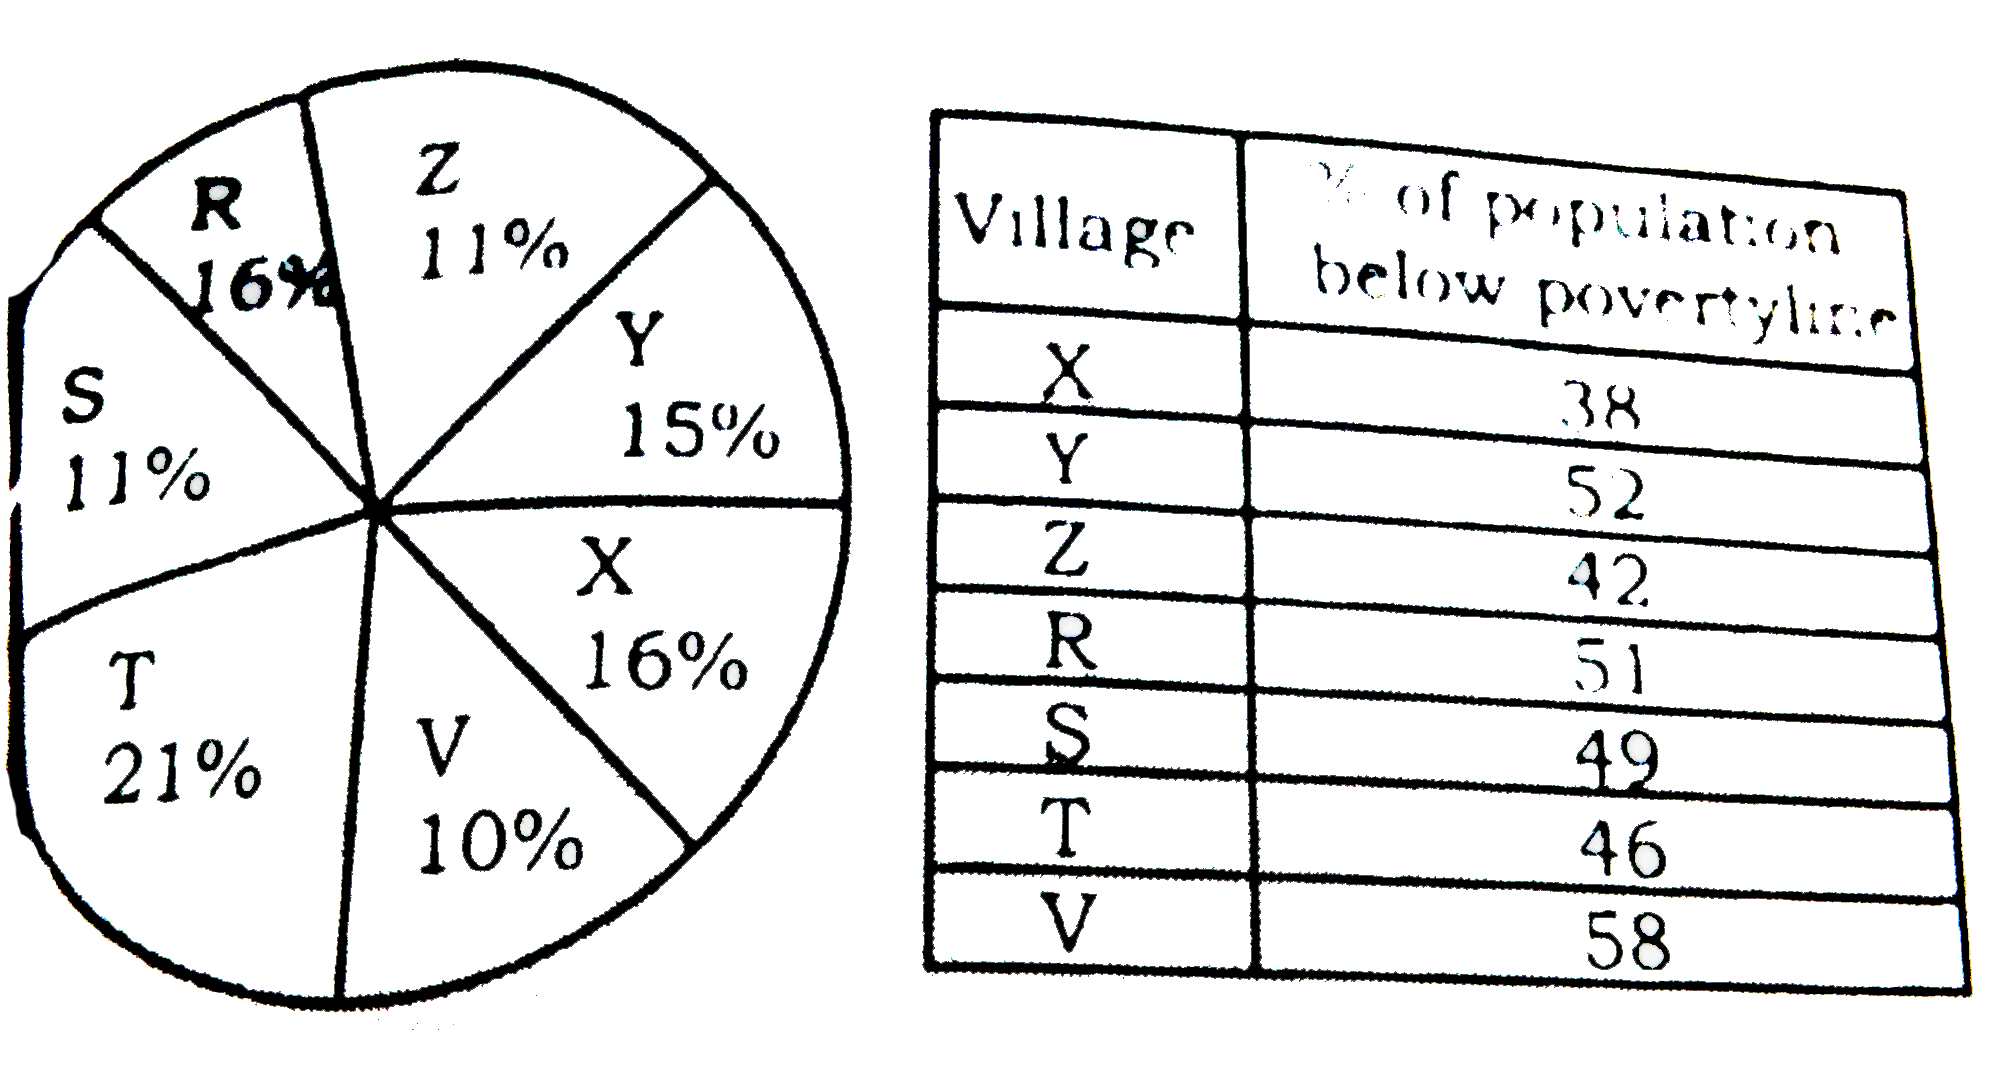
2010, में 'Y' और 'V' गॉवो की आबादी 10%, बढ़ जाती है और सभी गॉवो की गरीबी रेखा से नीचे की आबादी का प्रतिसत अप्ररीवर्तित रहता है यदि 2009, में गॉवो 'Y' की आबादी 30,000, थी, तो 2010, में गॉवो 'V' की गरीबी रेखा से नीचे की आबादी कितनी है ?
View SolutionDirections : The Paichart shows Distribution of Spacial Childern Population the year 1994-96. Study the pie-chart and answer the following questions
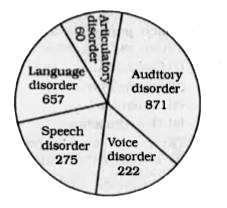
What is the respective ratio between language disorder and the average pf the remaining disorder cases?
View SolutionThe pie-chart shows Distribution of Special Children Population during the year 1994-96. Study the pie-chart and answer the following questions.
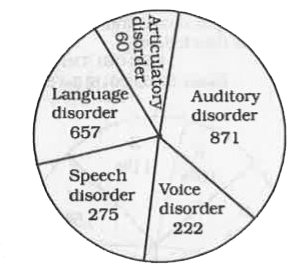
Find the ratio between articulatory disorder and speech disorder cases.
View SolutionDirections : The Paichart shows Distribution of Spacial Childern Population the year 1994-96. Study the pie-chart and answer the following questions
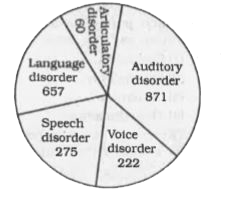
Find the ratio between atrticulatory diorder and speech disorder cases.
View SolutionDirections: The given pie-charts compares the total population and the female population of six countries, Australia, Canada, Germany, India, USA and Philippines. The first pie chart gives the percentage distribution of the total population of the six countries, while, the second pie chart gives the percentage distribution of the female population of the six countries. Study the pie-charts and answer the questions that follow. If the total number of females in India and USA is equal to the total population of the Philippines, then what is the ratio of the number of males in Australia to the number of females in Canada?
View SolutionFollowing is the pie-chart showing the spendings of a family on various items in a particular year Study the pie chart and answer questions. Angle of the pie chart representing the expenditure on entertainment is
View SolutionThe population of a city is 8000. They have various types of occupation which is given below by the pie-chart. Study the pie-chart and answer the given questions. How much percent are in service sector from the total population?
View SolutionThe population of a city is 8000. They have various types of occupation which is given below by the pie-chart. Study the pie-chart and answer the given questions. How much population percent is less in industry sector than in agriculture sector?
View SolutionThe following pie-chart shows the study-time of different subjects of a student in a day. Study the pie-chart and answer the following questions
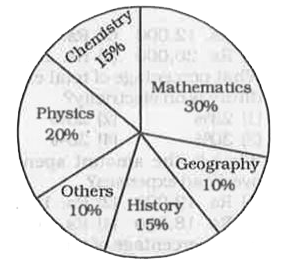
If the student studied 10 hours in a day, then he / she studied mathematics for
View SolutionThe following pie-chart shows the study-time of different subjects of a student in a day. Study the pie-chart and answer the following questions
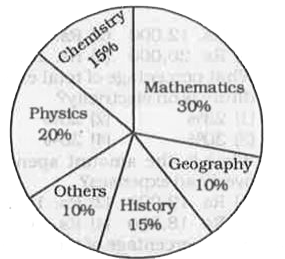
The time spent to study history and chemistry is 4 hours 30 minutes, Then the student studied physics for
View SolutionThe following pie-chart shows the study-time of different subjects of a student in a day. Study the pie-chart and answer the following questions
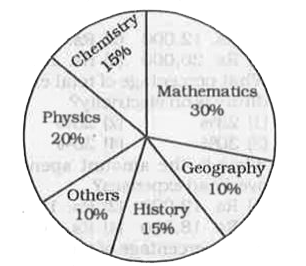
If the student studied chemistry for 3 hours, then he / she studied geography for
View Solutionनिर्देश :- केंद्र सरकार द्वारा अर्जित राजस्व वृत्त चार्ट (पाई चार्ट ) में दर्शाया गया है इस चार्ट का अध्ययन करे और निम्नलिखित 4 प्रश्नो के उत्तर दे ।
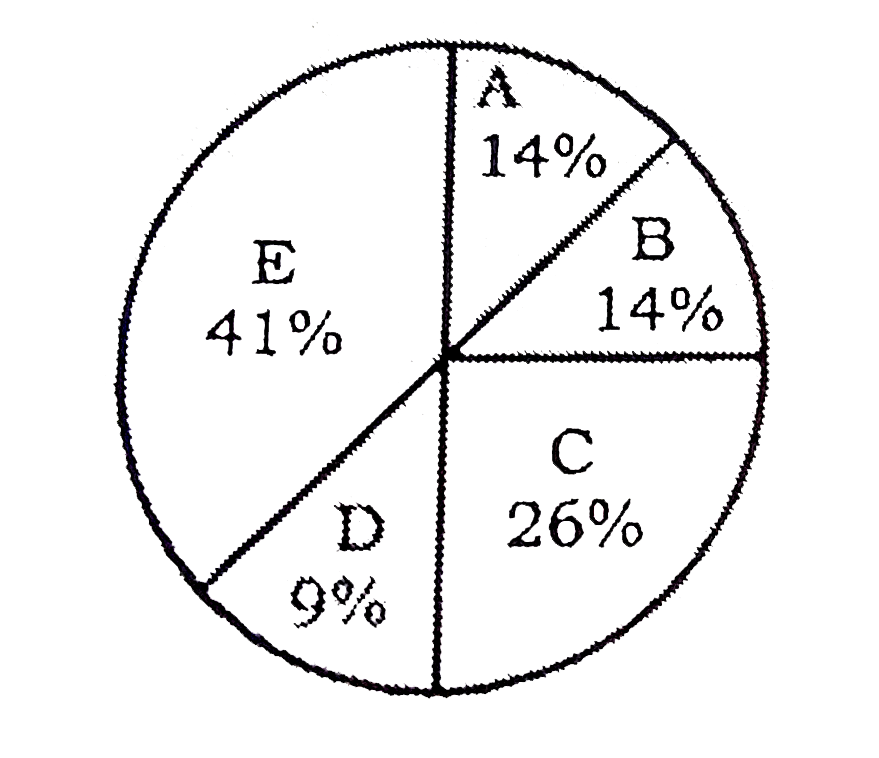
View Solutionनिर्देश :- केंद्र सरकार द्वारा अर्जित राजस्व वृत्त चार्ट (पाई चार्ट ) में दर्शाया गया है इस चार्ट का अध्ययन करे और निम्नलिखित 4 प्रश्नो के उत्तर दे ।
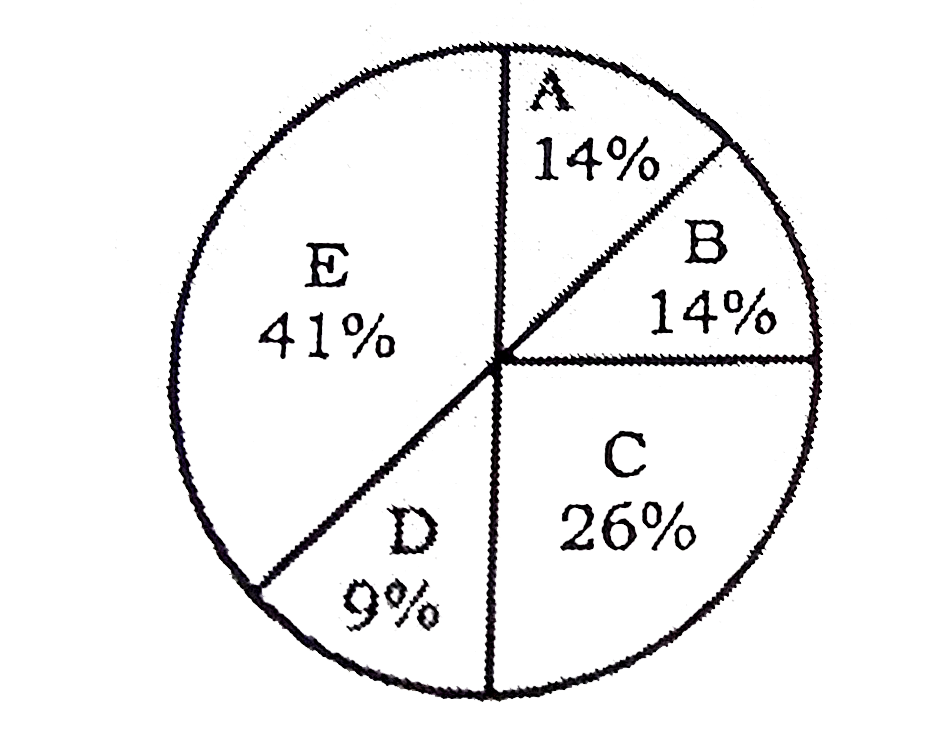
View Solution