Study the following pie-charts to answer the following questions : The pie-charts show the expenditure of two companies A and B Which are Rs.50 lakh and Rs.60
null
null
null
null
Answer : Explanation :1. Answer : 3 Explanation : Expenditure of Company B = 60 lakh Income of
Related Solutions
The pie chart shows the breakup of expenditure of a manufacturing company for the year 2017. Study the diagram and answer the following questions.
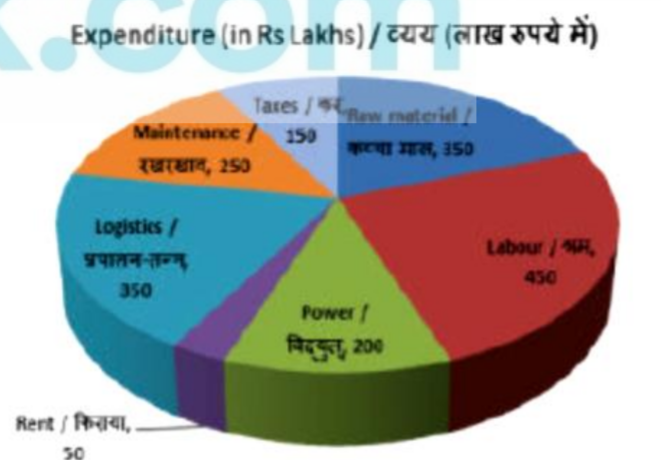
What is the total expenditure (in Rs lakhs)?
View SolutionThe pie chart shows the breakup of expenditure of a mining company for the year 2017. Study the diagram and answer the following questions.
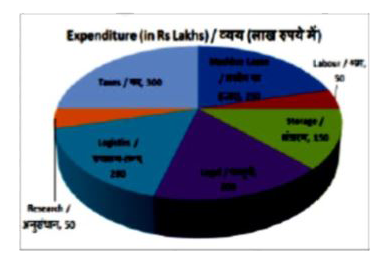
What is the total expenditure (in Rs lakhs)?
View SolutionThe pie chart shows the breakup of expenditure of a software company for the year 2017. Study the diagram and answer the following questions.
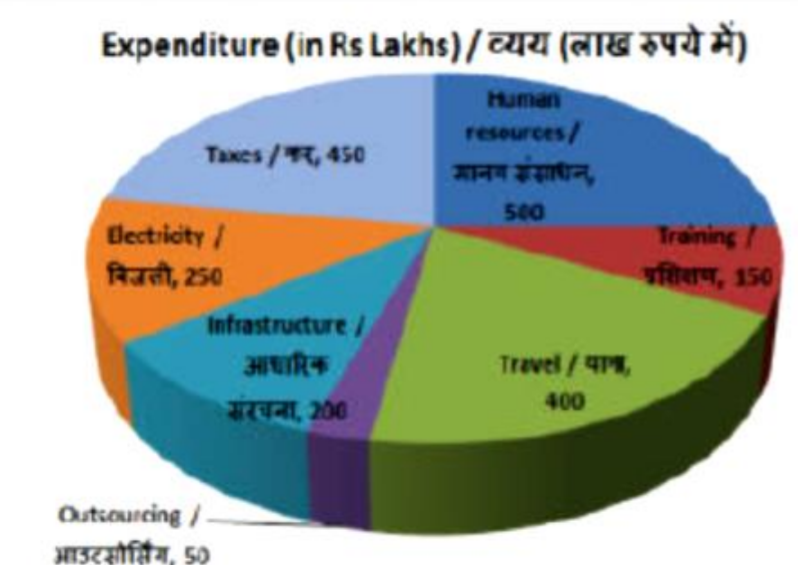
What is the total expenditure (in Rs lakhs)?
View SolutionThe pie chart shows the breakup of expendoture of a manufacturing company for the year 2017. Study the diagram and answer the following questions.
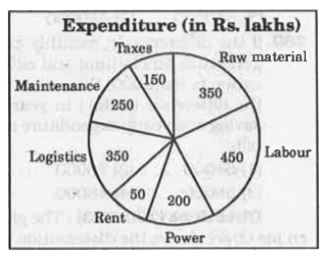
What is the total expenditure (in Rs. lakhs)?
View SolutionThe pie chart shows the breakup of expendoture of a software company for the year 2017. Study the diagram and answer the following questions.
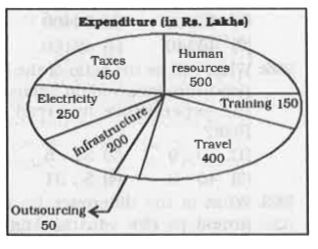
What is the total expenditure (in Rs. lakhs)?
View SolutionThe pie chart shows the breakup of expenditure of a college for the year 2017. Study the diagram and answer the following questions. What is the total expenditure (in Rs lakhs)?
View SolutionThe pie-chart given here shows expenditures incurred by a family on various items and their savings, which amounts to Rs 8,000 in a month.
Study the chart and answer the questions based on the pie-chart
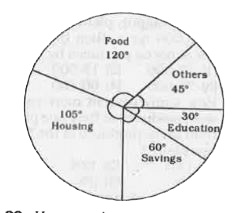
How much expenditure is incurred on education ?
View SolutionDirections : The pie-chart given below shows expenditure incurred by a family on various items and their savings. Study the chart and answer the questions based on the pie-chart
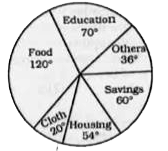
The ratio of expenditure on food to saving is :
View SolutionThe pie-chart given here shows expenditures incurred by a family on various items and their savings, which amounts to Rs 8,000 in a month.
Study the chart and answer the questions based on the pie-chart
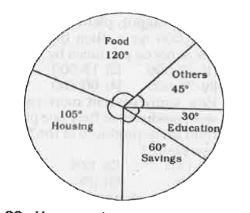
What is the total expenditure of the family for the month ?
View SolutionThe pie-chart shows the breakup in percent age of the various expenses of a Company. Study the diagram and answer the following questions.
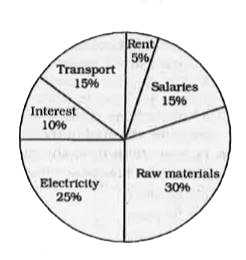
If the total expenses of the company are Rs 50 crores. The total expenditure (in Rs. Crores) on transport and electricity is:
View SolutionStudy the pie chart and answer the given questions.
The total expenditure of a company for a particular month is Rs. 60000. The various heads of expenditure I to IV are indicated in a pie chart given below. These heads are :
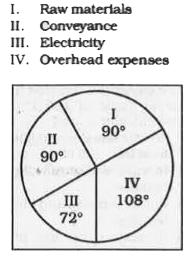
Total expenditure on conveyance is :
View SolutionStudy the following pie chart and answer the question. Pie chart shows the various expenditures of Company XYZ in Q 3 2015. If the total number of different departments in the company is Rs. 120 lakh crores have been spent, then how much was spent in the interest of the loan (in lakh crores)
View SolutionThe pie chart shows the break up of expenditure of a trading company for the year 2017. Study the diagram and answer th following questions.
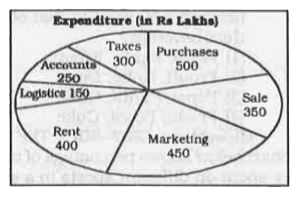
What is the total expenditure (in Rs. lakhs) ?
View SolutionThe following pie chart shows percentage expenditure of a country on different heads .The total expenditure is Rs. 1,680 (in billions).Study the chart and answer the question. The total amount of expenditure for education and Health (in billions Rs. )is:
View SolutionThe following pie-chart shows the market share of four companies S, T, U and V. Total market is worth Rs. 72 crores. Study the pie-chart and answer the questions.
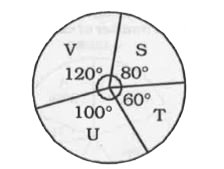
The company having maximum market share is
View SolutionThe following pie-chart shows the market share of four companies S, T, U and V. Total market is worth Rs.72 crores. Study the pie-chart and answer the questions
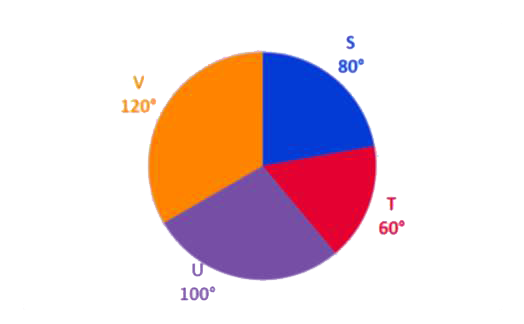
The company having maximum market share is
View SolutionStudy the following pie chart and answer the question that follows The pie chart shows company XYZ expenditure on various heads for Q3 2015. If the company the spent a total of Rs 120 lakhs crores on the various heads, then how much was spent on loan interest
View SolutionStudy the pie-chart and answer the questions. The pie-chart gven below shows the expenditure incurred in bringing out a book by a publisher.
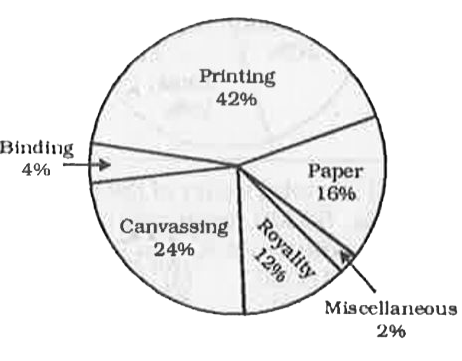
If miscellaneous expenditures amount of Rs. 12000, the expenditure on canvassing will be
View SolutionThe given pie chart shows expenditure on different type of sport in a particular year . Study the pie chart and answer the question below
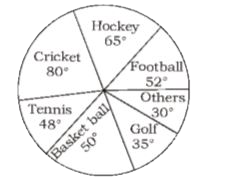
IF total expenditure on sport was Rs 24000000 then total expenditure on cricket and football will be
View SolutionThe following questions arfe based on the pie-chart given below. Study the pie-chart and answer the questions.
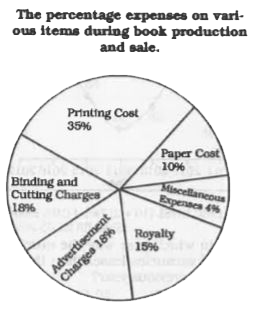
If the 'Printing-Cost' is Rs 17500, the royality paid is
View Solution