What was the difference between the average amount invested in raw materials during the given period and the average value of sales of finished goods during this period?
1 Rs. 62.5 lakh
2 Rs. 68.5 lakh
3 Rs. 71.5 lakh
4 Rs. 77.5 lakh
Answer : 4. "Rs. 77.5 lakh"
Related Solutions
Study the following graph and answer the given questions
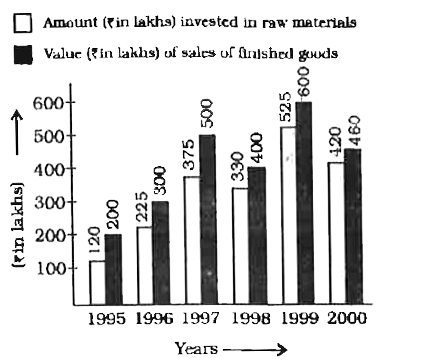
What was the difference between the average amount invested in raw materials during the given period and the average value of sales of finished goods during this period ?
View SolutionWhat was the difference between the average amount invested in raw materials during the given period and the average value of sales of finished goods during this period? (a) 62.5 lakhs (b) Rs 68.5 lakhs (c) Rs 71.5 lakhs (d) Rs 77.5 lakhs (e) Rs 83.5 lakhs
View Solutionनीचे दिए गए दो दण्ड आरेखों में से, पहला कंपनी द्वारा पिछले कुछ वर्षो में कच्चे माल के क्रय पर निवेश की गई धनराशि (लाख रुपए में ) प्रदर्शित करता है और दूसरा पिछले कुछ वर्षो में कंपनी द्वारा बेचे गए तैयार माल के मूल्यों (लाख रुपए में ) को प्रदर्शित करता है।
कच्चे माल में निवेश की गई धनराशि (लाख रुपए में )
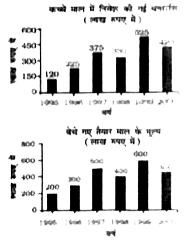
से के दौरान कच्चे माल पर निवेश की गई औसत धनराशि और से की इसी अवधि के दौरान तैयार माल की बिक्री के औसत मूल्य में अंतर क्या था ?
View SolutionOut of the two bar diagrams given below, the first shows the amount (in lakh rupees) invested by the company on the purchase of raw materials during the last few years and the second shows the value of finished goods sold by the company in the last few years (in lakh rupees) in ) displays. Amount invested in raw material (in lakhs of rupees) 1997 From 2000 the average amount invested on raw materials during the period and 1997 From 2000 What was the difference in the average price of finished goods sold during the same period?
View SolutionOut of the two bar graphs given below, the first shows the amount (in Rs lakhs) invested by the company on the purchase of raw materials during the last few years and the second shows the value of finished goods sold by the company (Rs lakhs) in the last few years. in) displays. What was the difference between the average amount invested on raw materials during 1997 to 2000 and the average sale price of finished goods during the same period from 1997 to 2000?
View SolutionOut of the bar graphs provided below one shows the amount invested a company in purchasing raw material over the year and the other shows the values of finished goods sold by the company over the years what was the difference between the average amount invested in raw materials during 1997 to 2000 and the average value of sales of finished goods during the same period 1997 to 2000
View SolutionStudy the following graph and answer the given questions
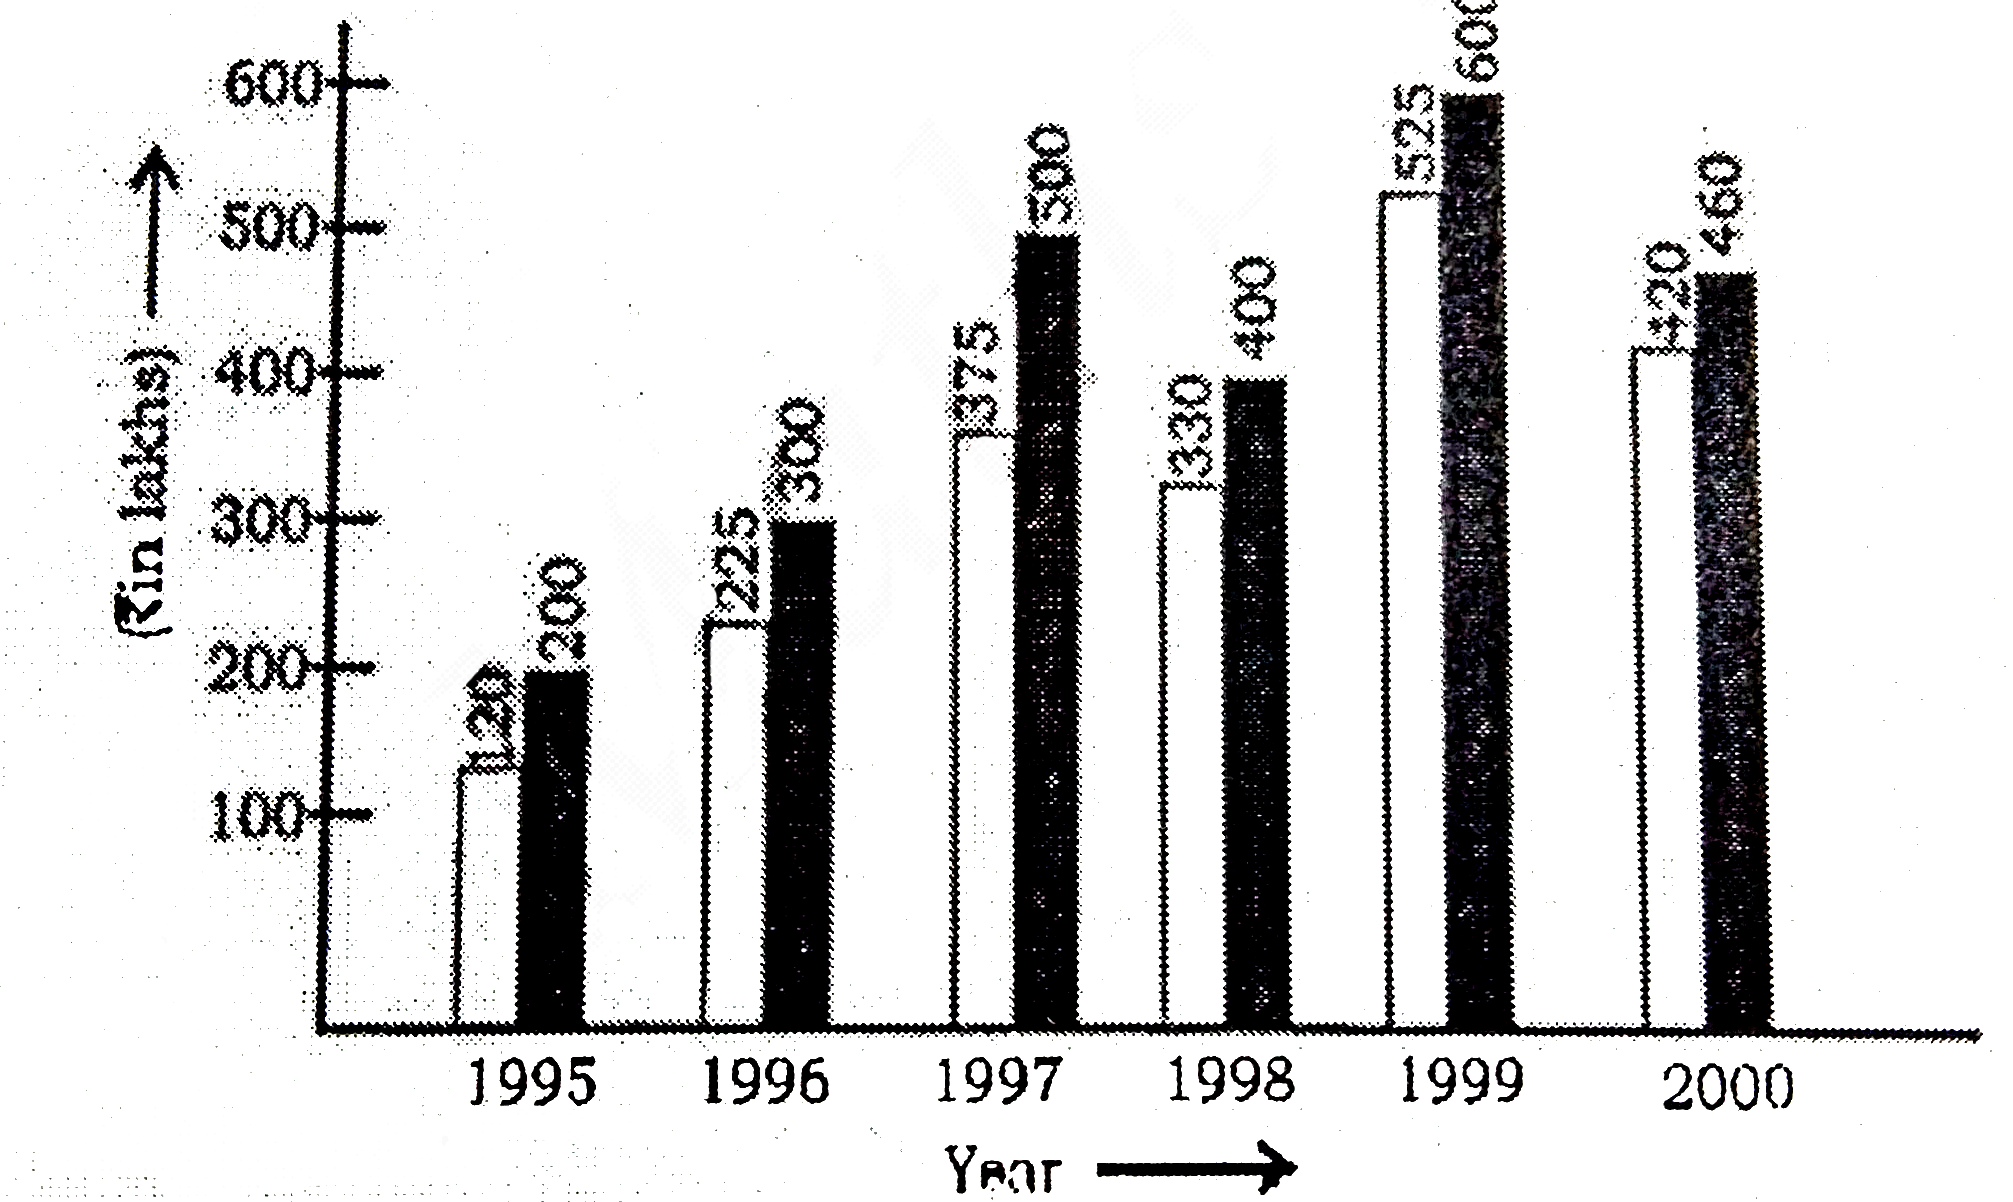
दिए गए समयांतराल में कच्चे माल पर किया गया औसत निवेश तथा फिनिशिंग गुड्स की औसत बिक्री कीमत में अंतर बताये ।
View SolutionThe maximum difference between the amount invested in raw materials and the value of sales of finished goods was during the year (a) 2005 (b) 2006 (c) 2007 (d) 2008 (e) 2009
View SolutionThe value of sales of finished goods in 2009 was approximately what percent of the average amount invested in raw materials in the years 2007, 2008 and 2009? (a) 33% (b) 37% (c) 45% (d) 49% (e) 53%
View Solutionनिम्न बार ग्राफ वर्षों में किसी कंपनी दवारा कच्चे माल की खरीद में निवेशित राशि (1 लाख में) और वर्षों में कंपनी दद्वारा बेचे गए तैयार माल के मूल्यों (र लाख में) को दर्शाता है।
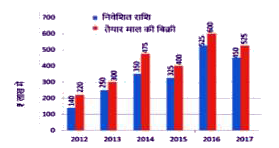
2013 से 2015 तक कच्चे माल की खरीद के लिए निवेशित कुल राशि और 2014, 2016 और 2017 में तैयार माल की कुल बिक्री का अनुपात ज्ञात करें।
View SolutionWhat is approximate average quantity sold during the period 2004-2011?
View SolutionStudy the graph and answer the questions
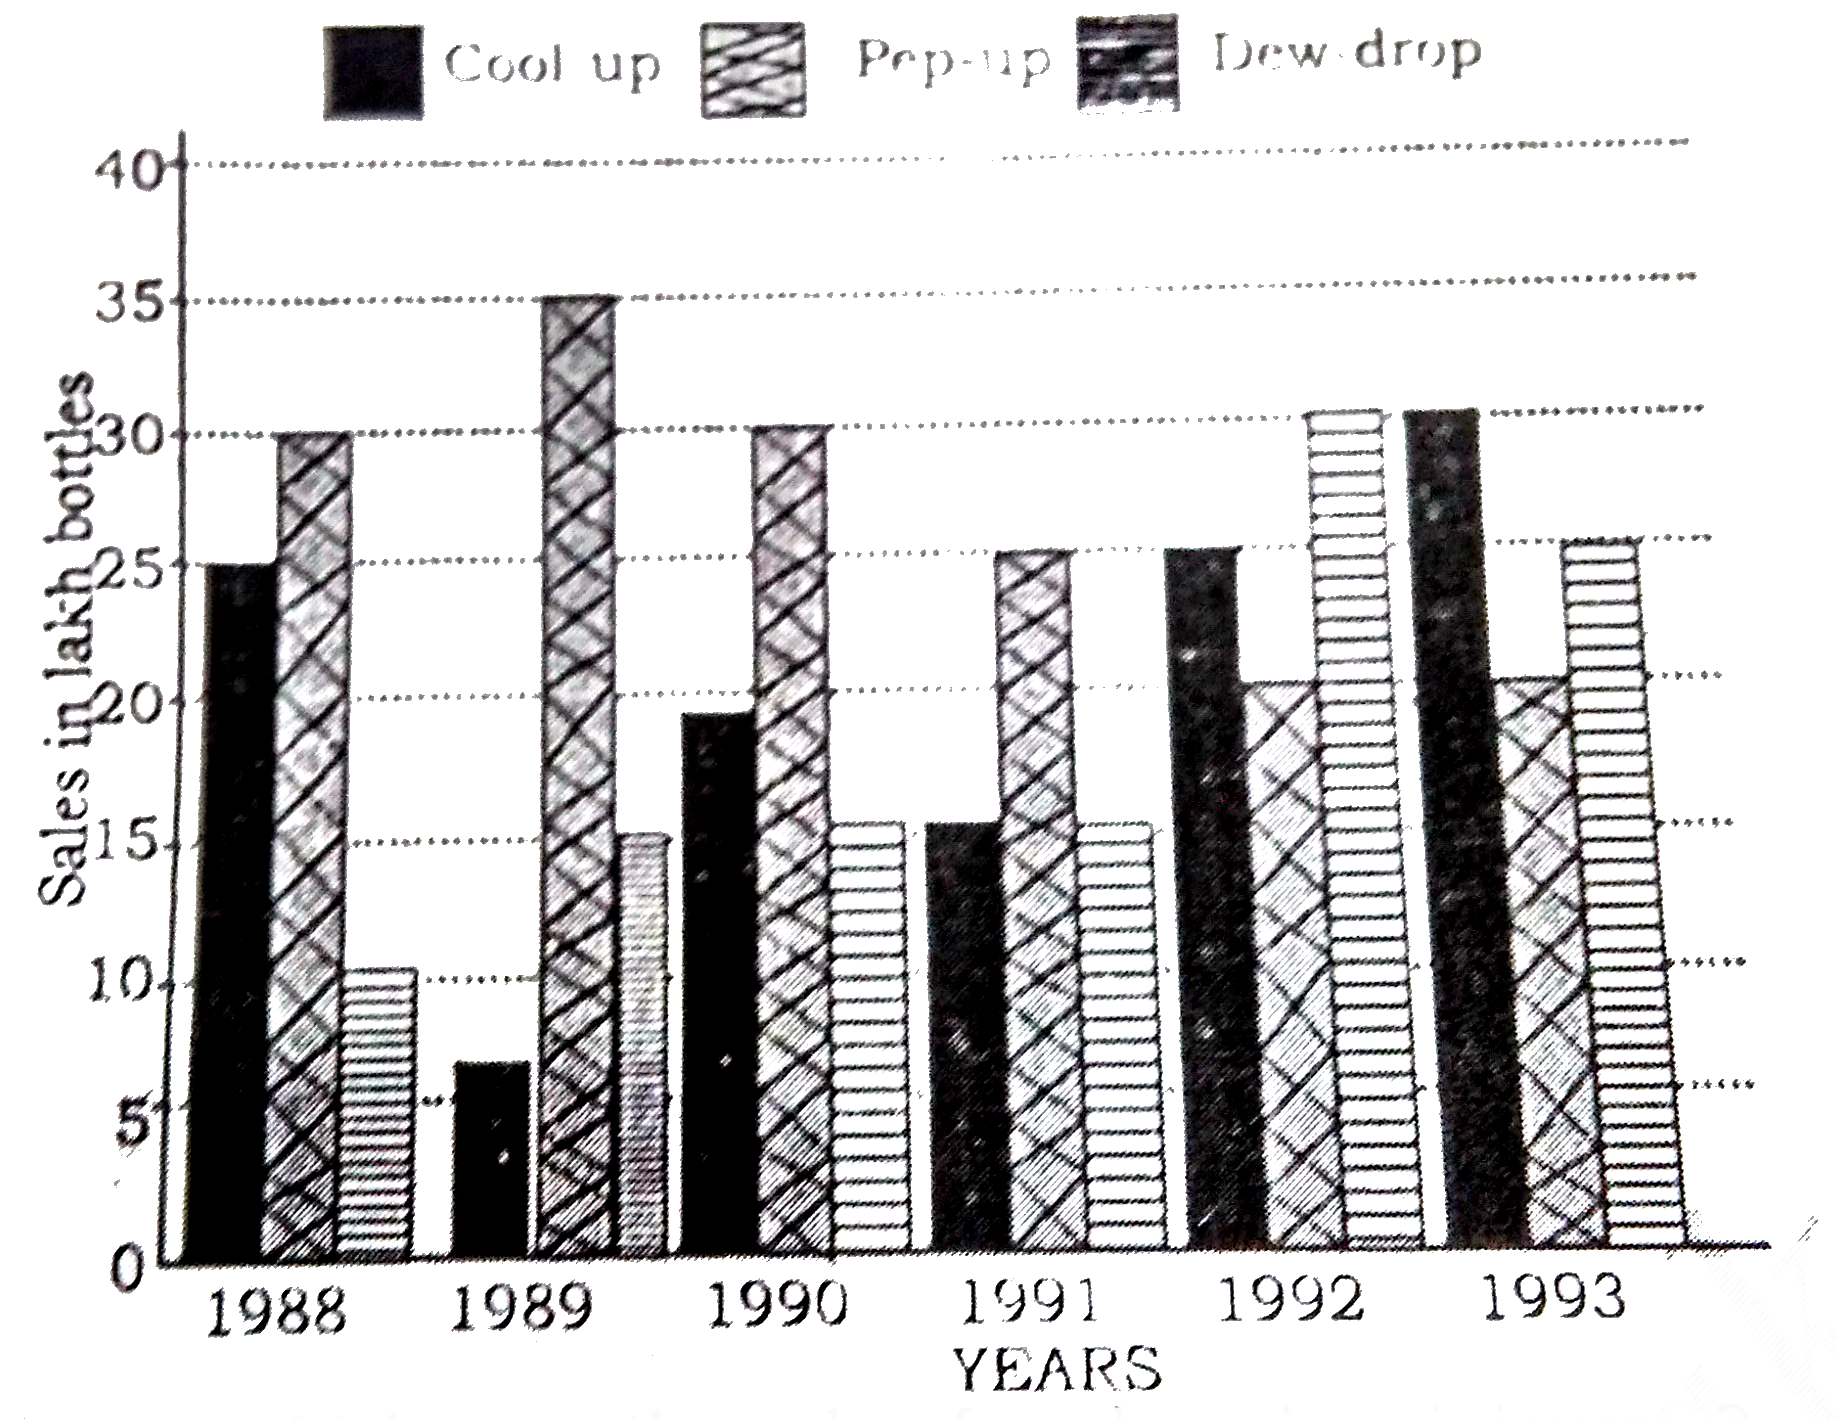
समयावधि 1988-1993 के दौरान किस सॉफ्ट ड्रिंक की औसत वार्षिक बिक्री सर्वाधिक रही ।
View SolutionStudy the graph and answer the questions
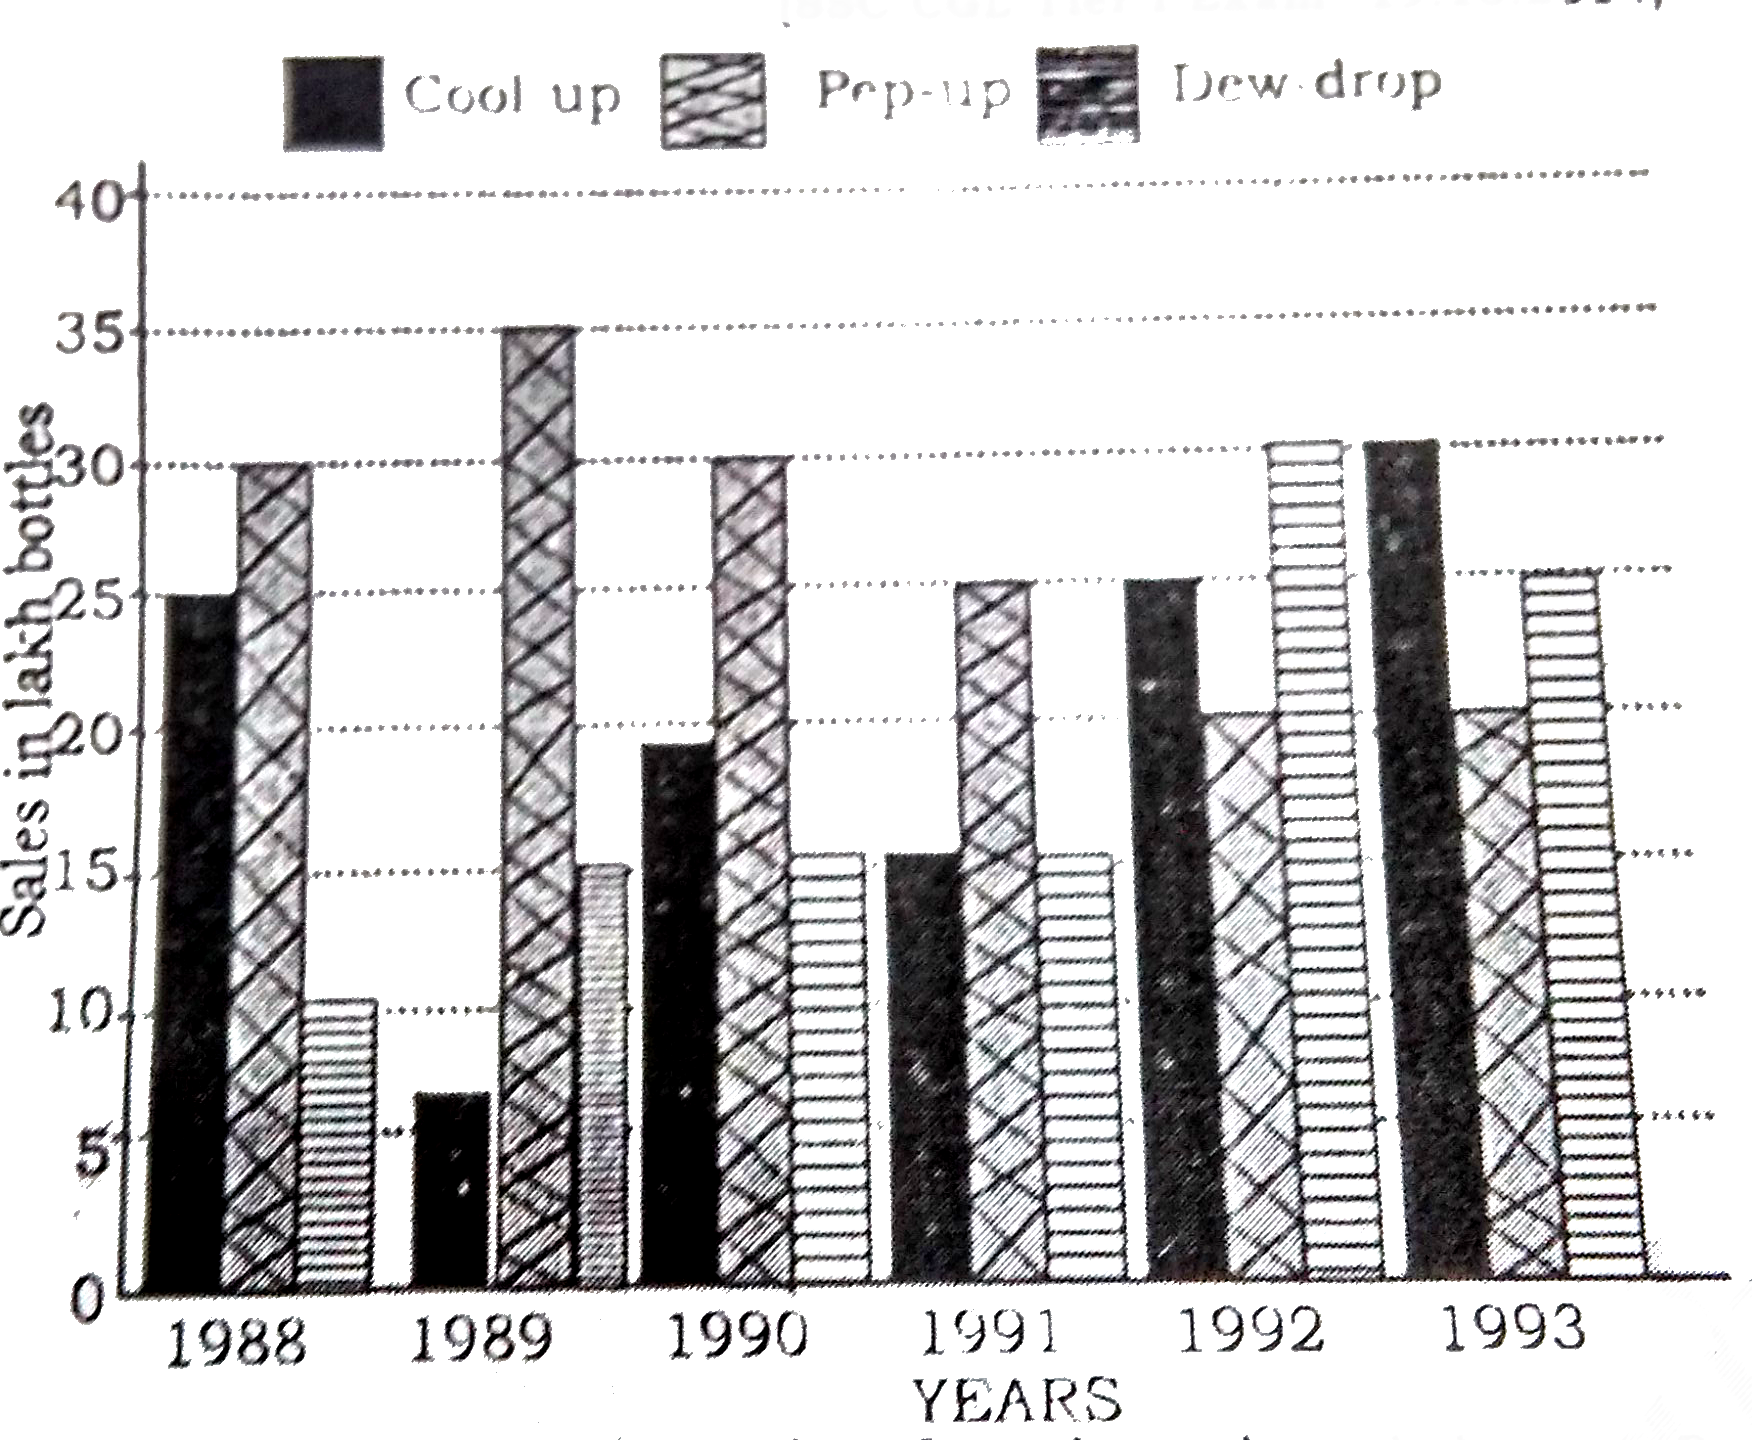
वर्ष 1988-1993 की समयावधि में किस पैकी औसत बिक्री न्यूनतम रही ।
View SolutionStudy the graph and answer the questions.
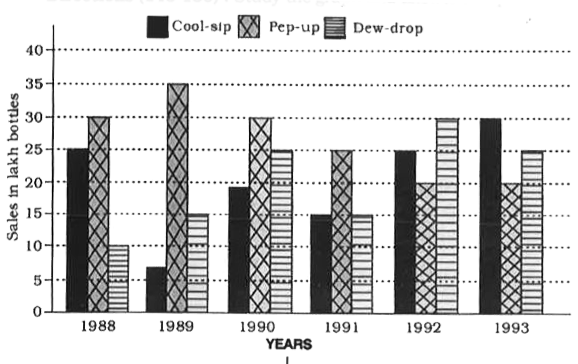
In case of which soft drink was the average annual sale maximum during the period 1988 - 1993 ?
View SolutionStudy the graph and answer the questions.
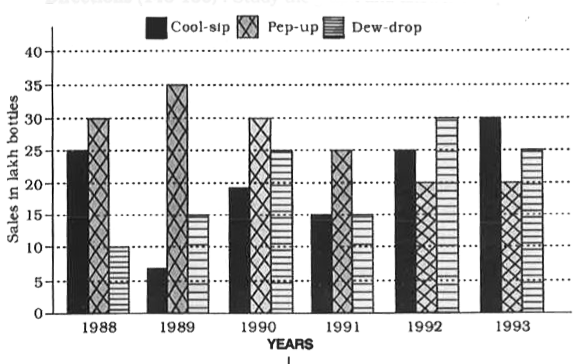
In case of which soft drink was the average annual sale minimum during the period 1988- 1993 ?
View SolutionStudy the graph and answer the questions.
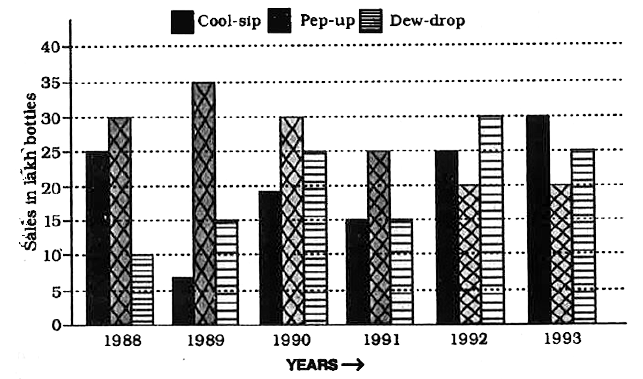
In case of which soft drink was the average annual sale maximum during the period 1988-1993 ?
View SolutionStudy the graph and answer the questions.

In case of which soft drink was the average annual sale minimum during the period 1988- 1993 ?
View Solution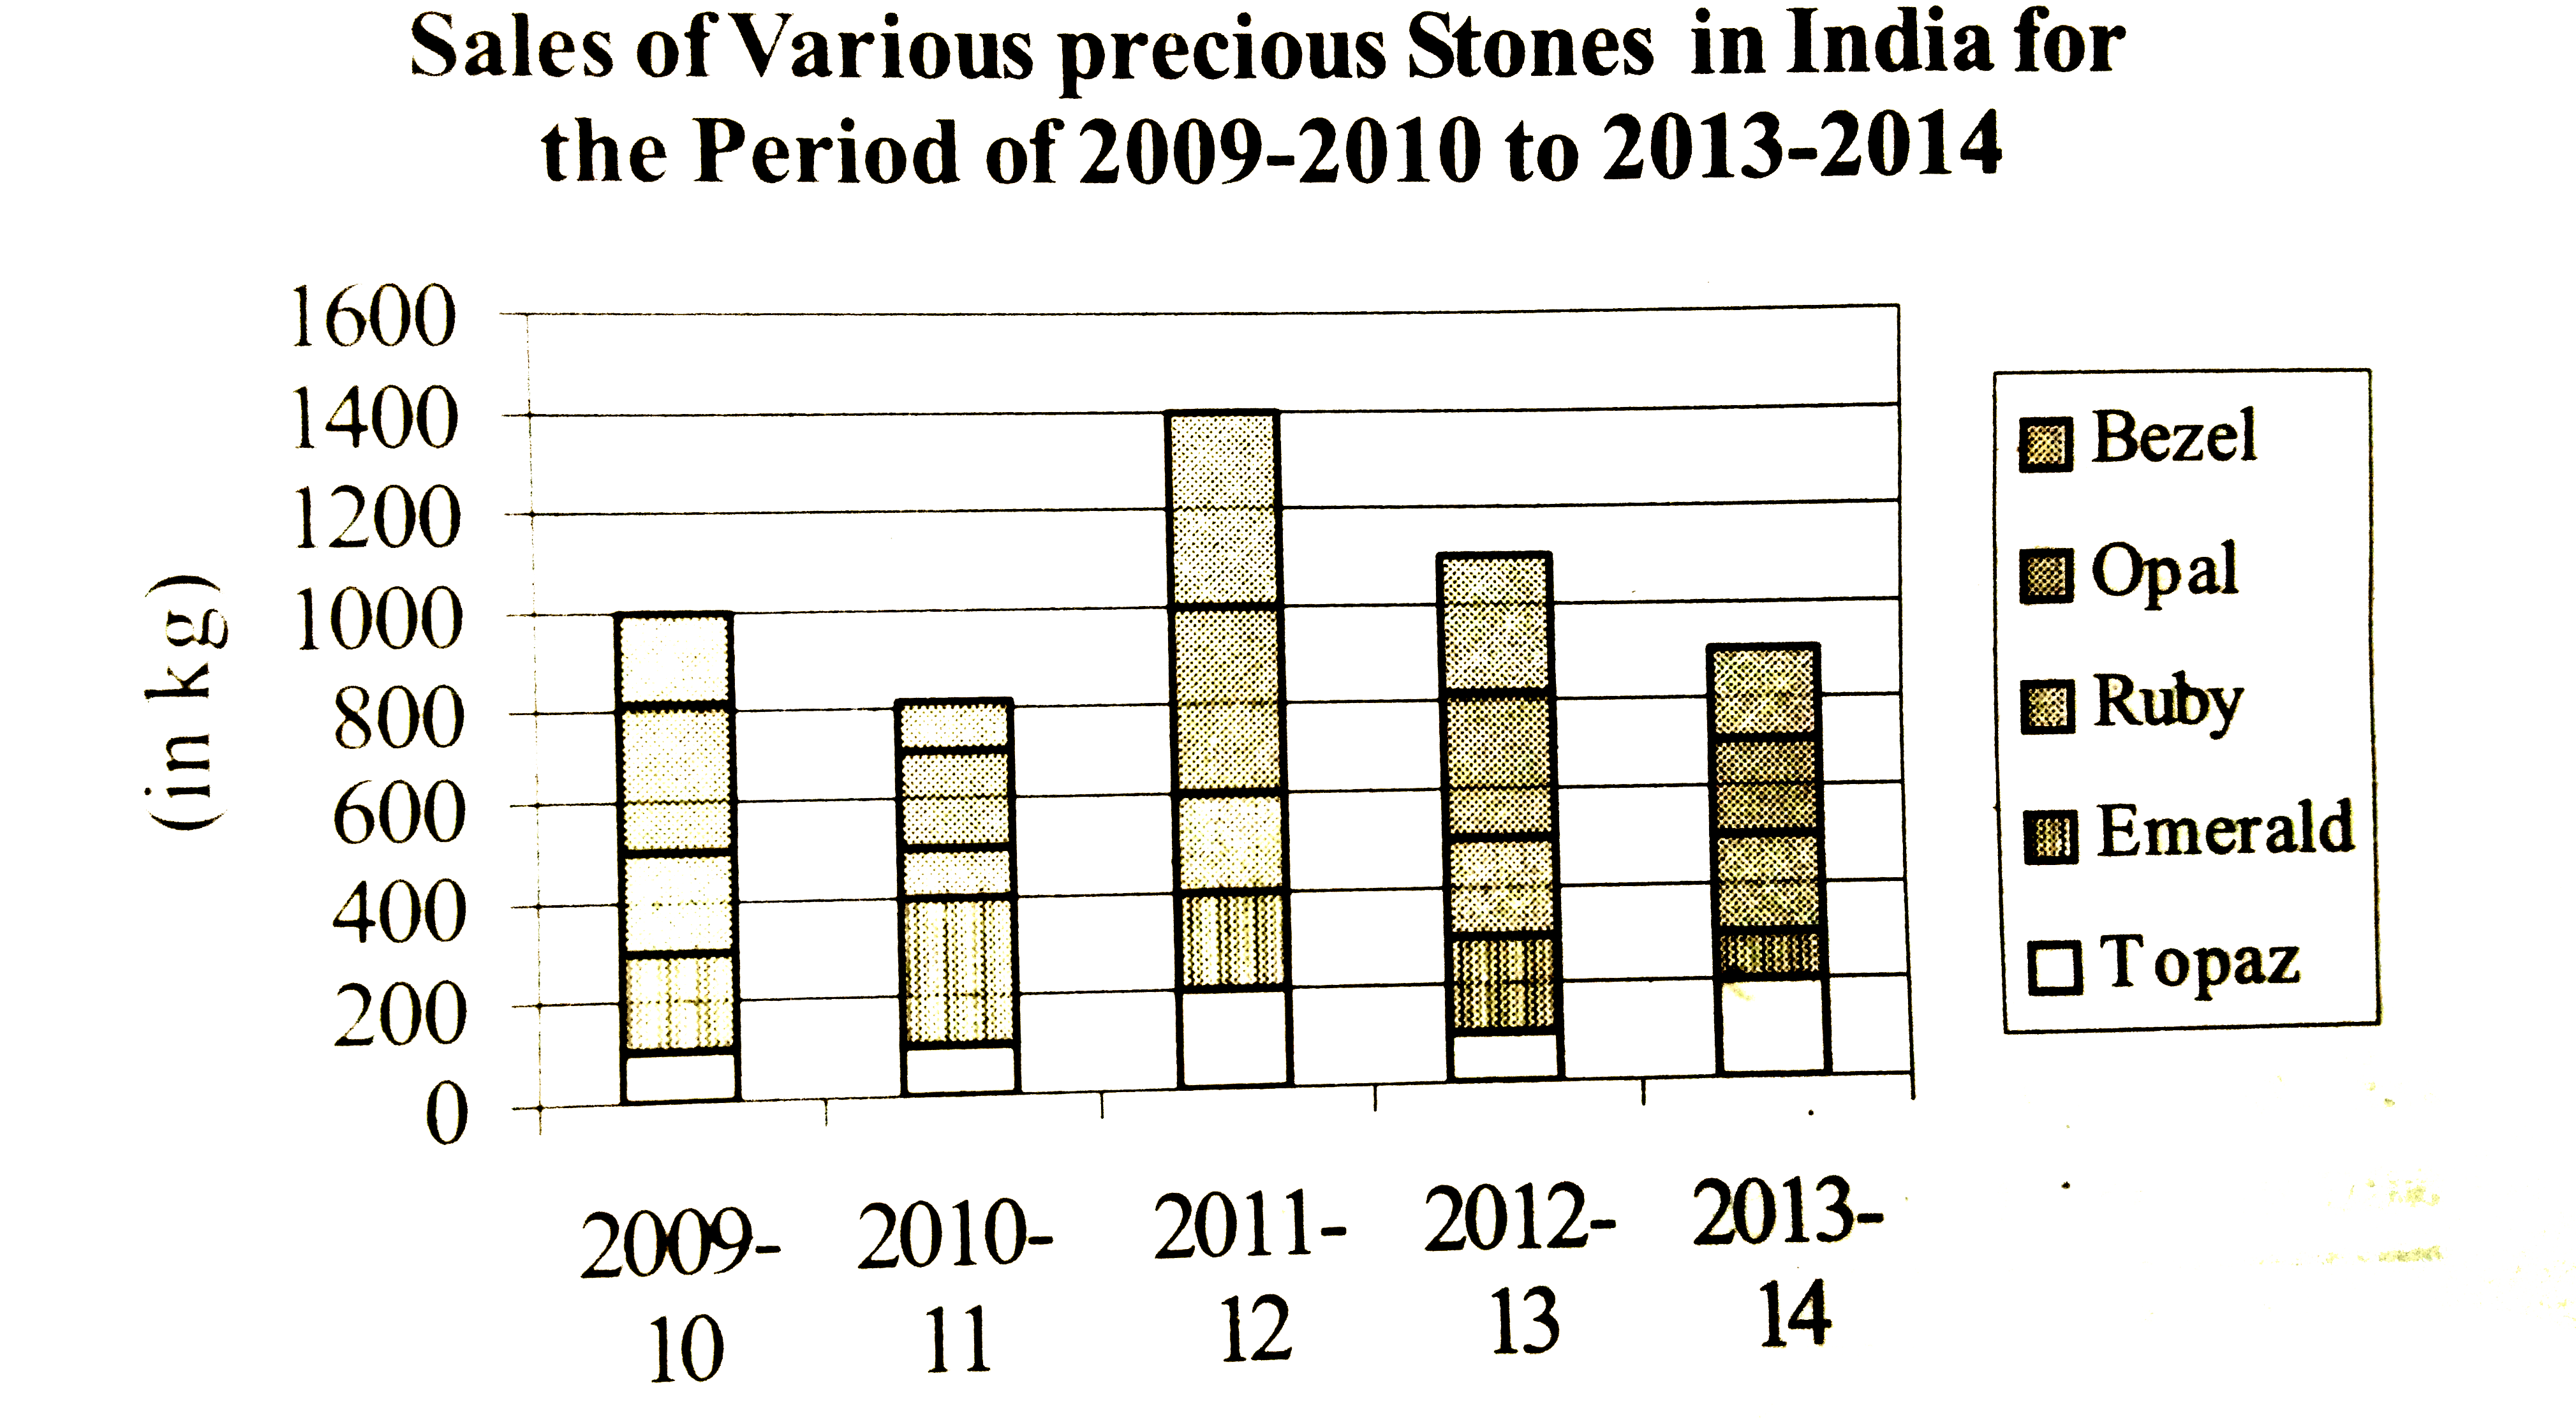
By what percent is the average annual sales of Eamerald for the given period more than the sales of Opal in 2012-13?
View SolutionThe average salary per year during period 2001-2006 is
View SolutionWhat is the average sales per month by A during January-March 2018?
View Solution