The current i in an induction coil varies with time t according to the graph shown in the figure. Which of the following graphs shows the induced emf E in the coil with time
Correct option: cExplanation: Emf induces during ‘a’ = 0 emf induced during ‘b’ is constant throughout emf induced during ‘c’ is constant throughout magnitude of emf induced during ‘b’ is equal to the magnitude of emf induced during ‘c’. But the direction opposite. Induced emf = - Ldi/dt
Related Solutions
The current is an induction coil varies with time , according to the graph shown in figure. Which of the following graphs shows the induced emf in the coil with time.
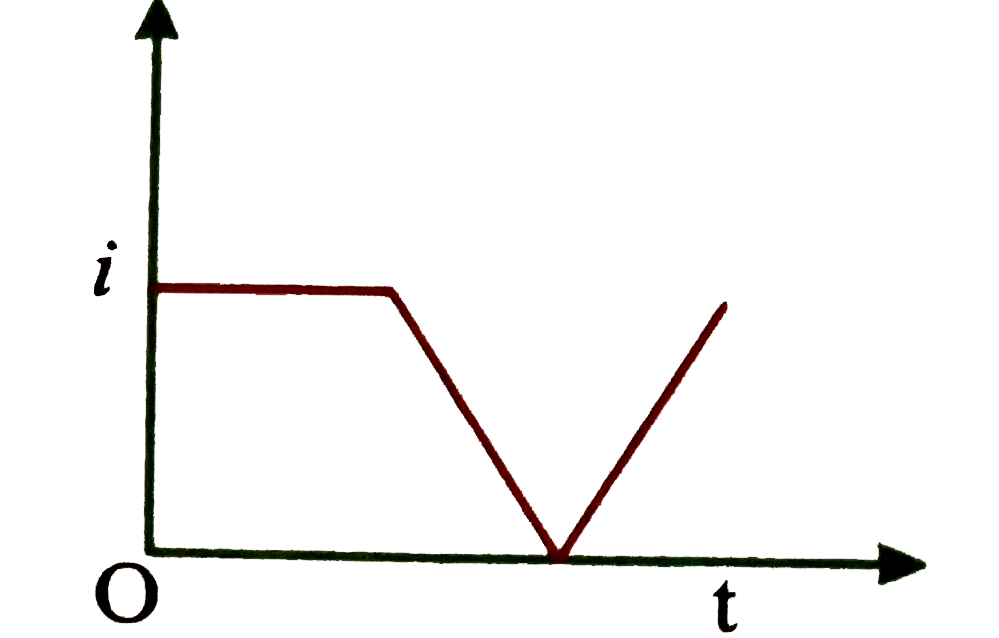
View SolutionThe current i in an induction coil varies with time t according to the graph shown in the figure-5.250. Which of the following graphs shows the induced EMF in the coil with time ?
View SolutionThe current i in an induction coil varies with time t according to the graph shown in the figure-5.250. Which of the following graphs shows the induced EMF in the coil with time ?
View SolutionThe current i in an induction coil varies with time according to the graph shown in figure. Which of the following graph shows induced emf in the coil with time:
View SolutionThe current i in an induction coil varies with time according to the graph shown in figure. Which of the following graph shows induced emf in the coil with time:
View SolutionThe current i in an induction coil varies with time t according to the graph
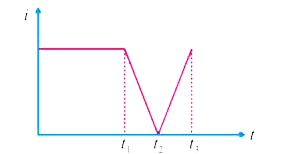
Draw the graph of induced e.m.f. with time.
View SolutionThe current i in an inductionn coil varies with time t according to the graph shown in the figure. Which of the following grahs shows athe induced emf (epsilon) in the coil with time?
View SolutionThe current i in an inductionn coil varies with time according to the graph shown in the figure. Which of the following grahs shows athe induced emf in the coil with time?
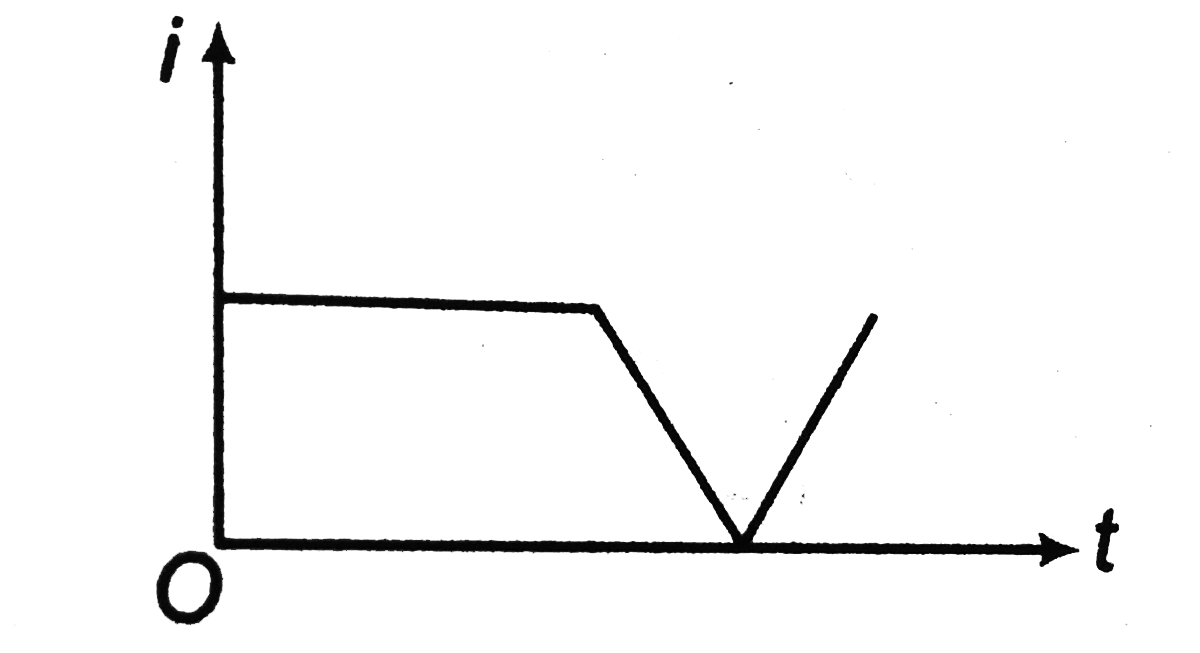
View SolutionThe current i in an inductionn coil varies with time according to the graph shown in the figure. Which of the following grahs shows athe induced emf in the coil with time?

View SolutionAn alternating current in an inductance coil varies with time according to the graph as shown: Which one of the following graph gives the variation of voltage with time?
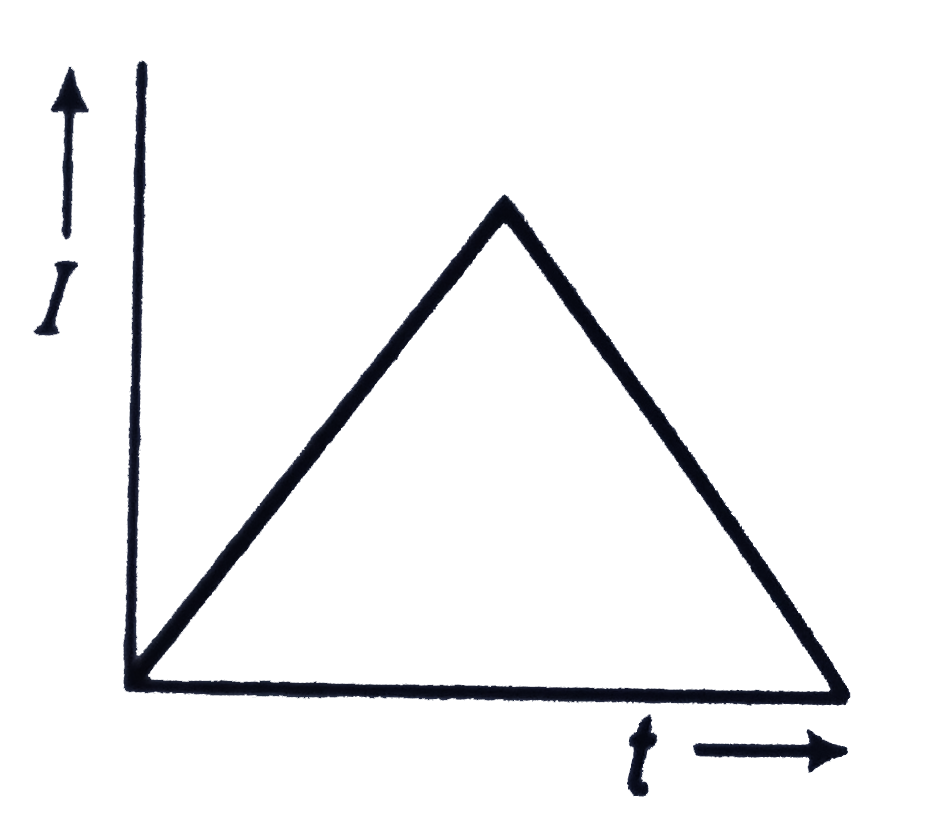
View SolutionAn alternating current in an inductance coil varies with time according to the graph as shown: Which one of the following graph gives the variation of voltage with time?

View SolutionAn alternating current I in an inductance coil varies with time t according to the graph as shown: Which one of the following graph gives the variation of voltage with time?
View SolutionThe current I in an inductance coil varies with time according to the graph given in the figure. Which one of the following graphs gives the variation of voltage with time across the inductor?
View SolutionThe current I in an inductance coil varies with time according to the graph given in the figure.
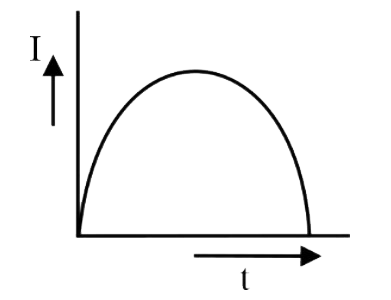
Which one of the following graphs gives the variation of voltage with time across the inductor?
View SolutionCurrent through the coil varies according to graph then induced emf v/s time graph is
View SolutionThe current I in a n inductance coil varies with time, t according to the graph shown in the figgure. Which one of the following plots shows the variation of voltage in the coil with time ?

View SolutionThe current I in an inductive coil varies with time as shown in the figure. Which of the following graphs shows the change in voltage at the ends of the inductor with time
View SolutionThe graph between the current and the time for an inductance coil is shown below. Which of the following graph show the voltage-time variation-
View SolutionThe graph between the current and the time for an inductance coil is shown below. Which of the following graph show the voltage-time variation-
View SolutionThe current I through a closed coil of self-inductance 0.25 H is related with time t as I=4t-t^(2) . Then the emf e induced in the coil will vary with time in the manner shown in the justify.
View Solution