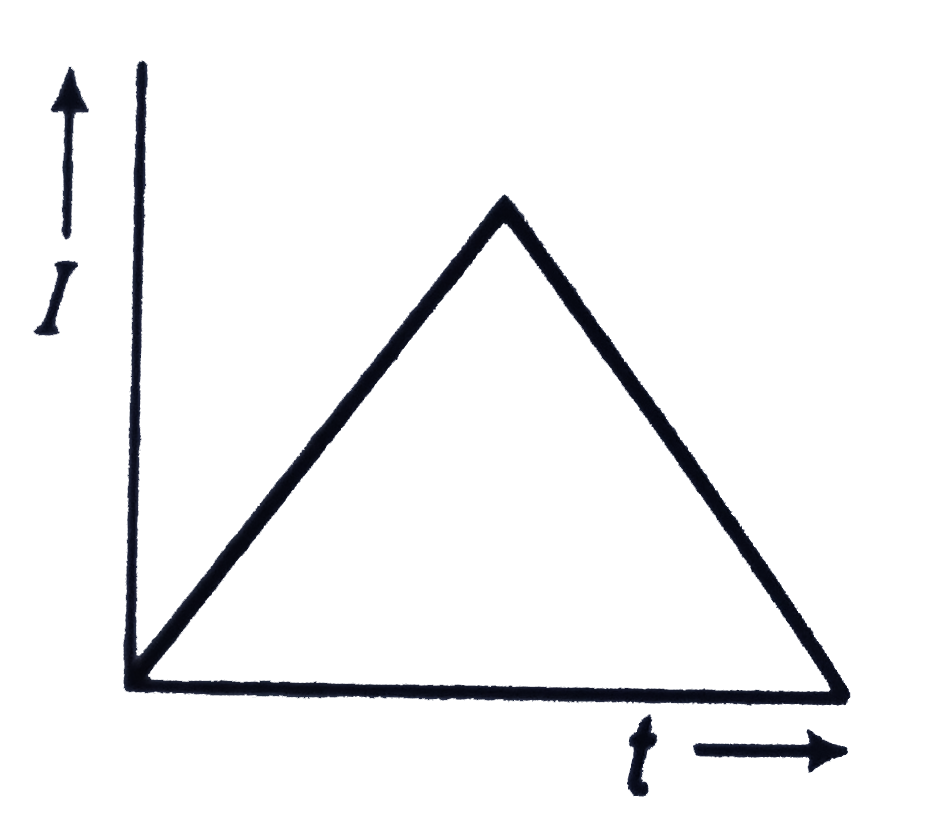
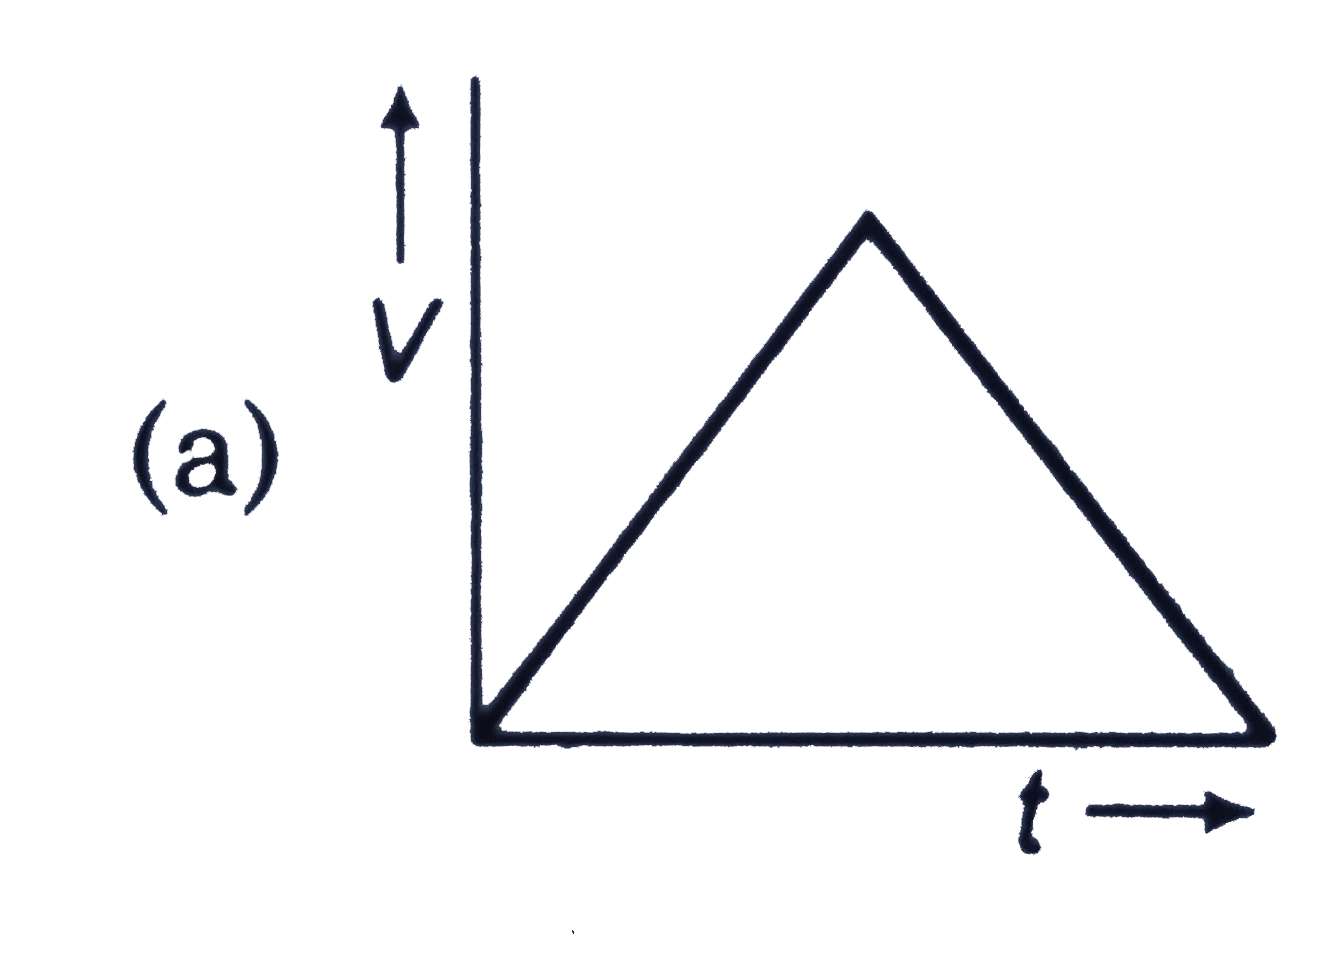
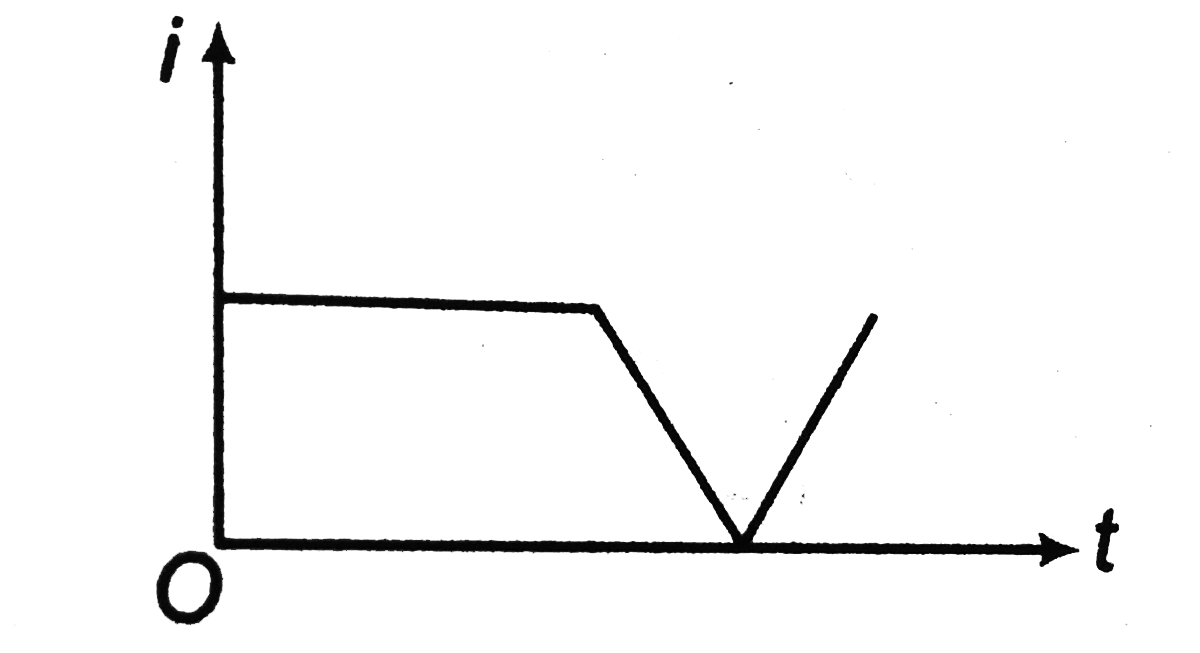
An alternating current I in an inductance coil varies with time t according to the graph as shown: Which one of the following graph gives the variation of voltage with time?
(##DCP_V04_C27_E01_055_O02.png" width="30%">
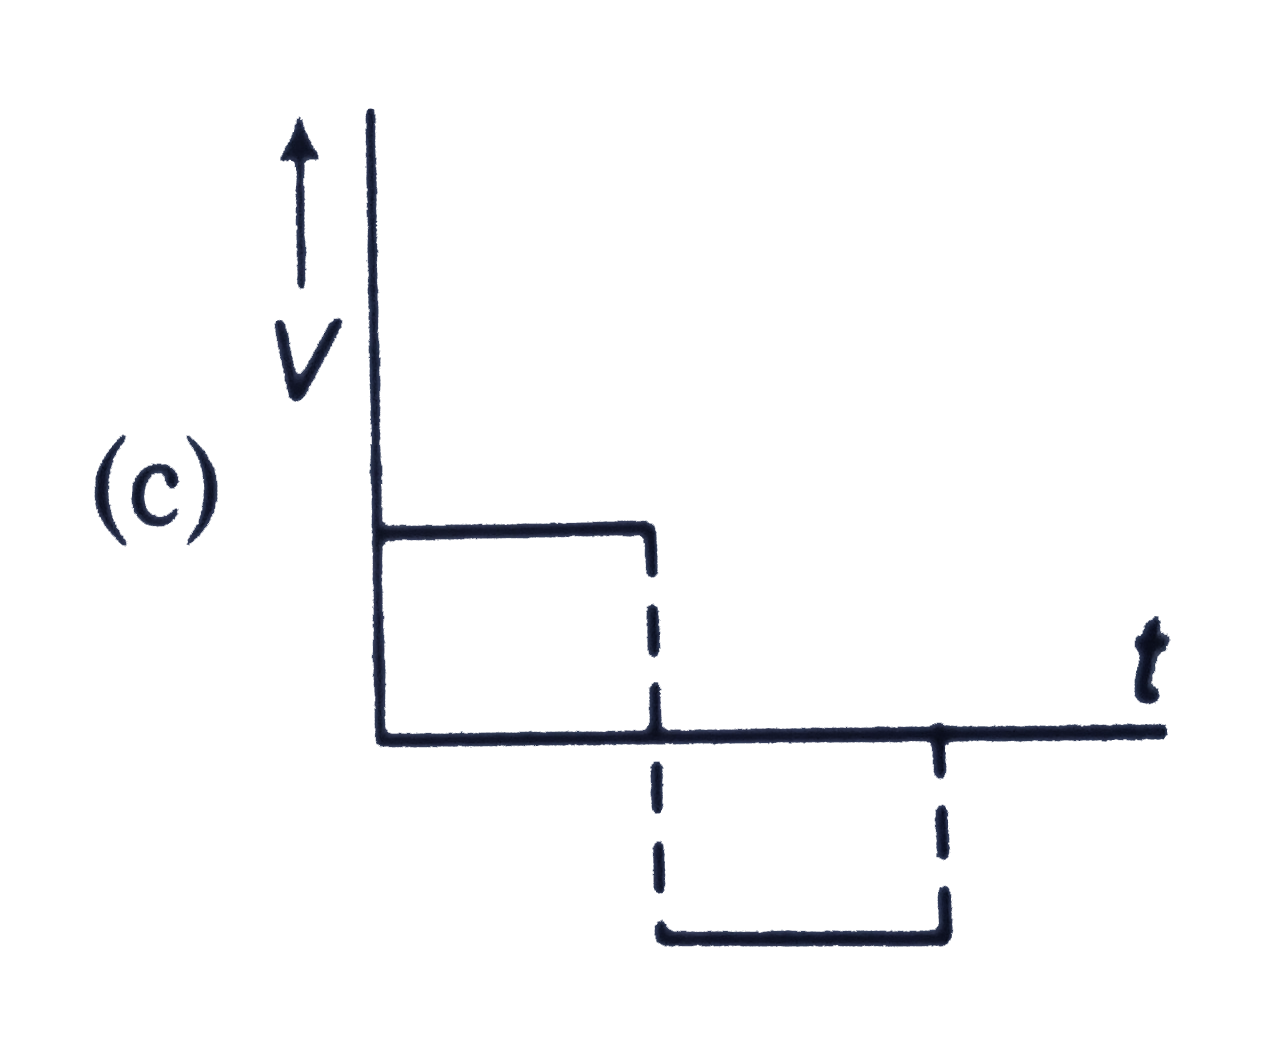
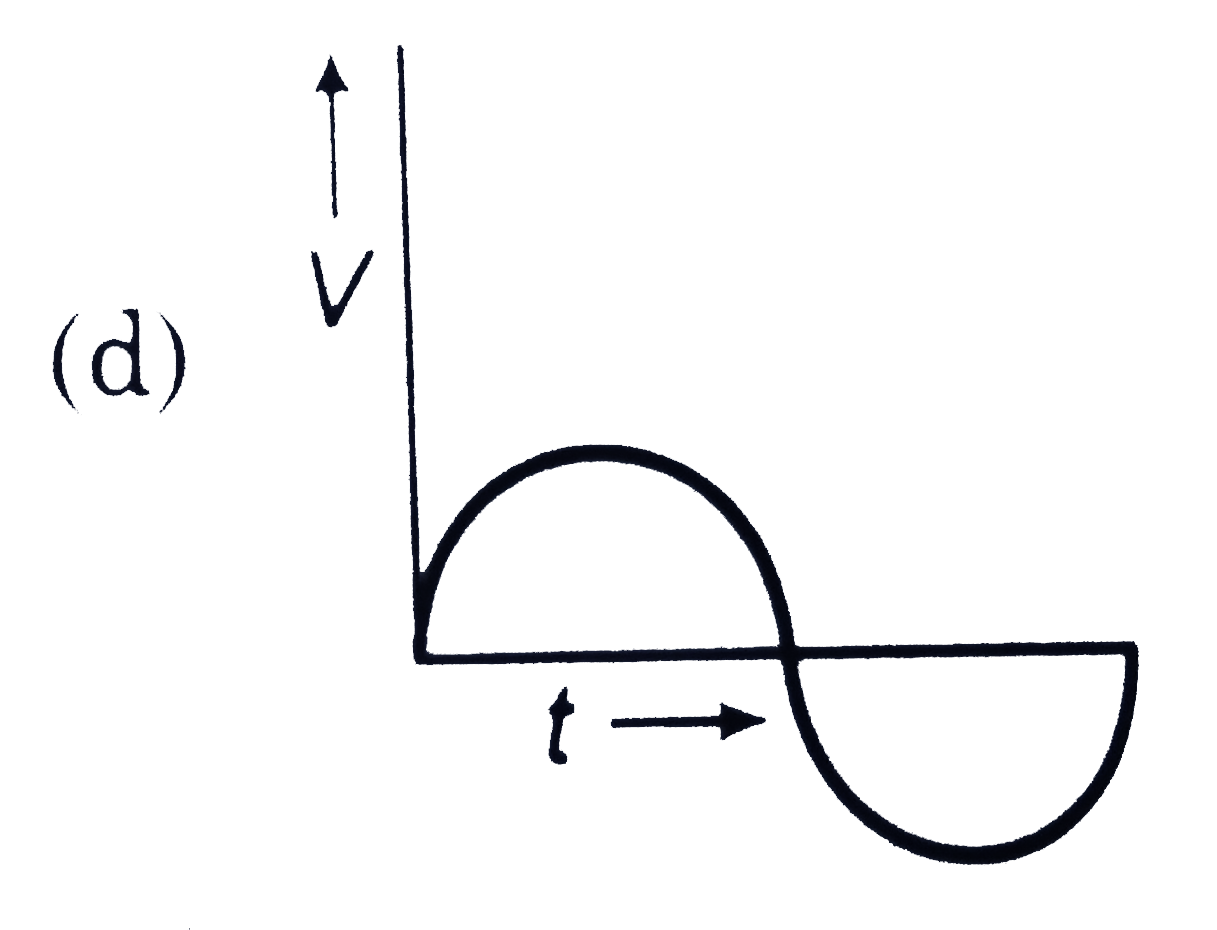
The correct Answer is:C
VL=Ldidt
Topper's Solved these Questions
- BOOK - DC PANDEY ENGLISHCHAPTER - ELECTROMAGNETIC INDUCTIONEXERCISE - Objective Questions3videos
ELECTROMAGNETIC INDUCTION
- BOOK - DC PANDEY ENGLISHCHAPTER - ELECTROMAGNETIC INDUCTIONEXERCISE - Level 1 Subjective21videos
ELECTROMAGNETIC INDUCTION
- BOOK - DC PANDEY ENGLISHCHAPTER - ELECTROMAGNETIC INDUCTIONEXERCISE - Level 1 Assertion And Reason10videos
ELECTROMAGNETIC INDUCTION
- BOOK - DC PANDEY ENGLISHCHAPTER - CURRENT ELECTRICITYEXERCISE - Medical entrances gallery97videos
CURRENT ELECTRICITY
- BOOK - DC PANDEY ENGLISHCHAPTER - ELECTROMAGNETIC WAVESEXERCISE - Sec C22videos
ELECTROMAGNETIC WAVES
Similar Questions
The current I in an inductance coil varies with time according to the graph given in the figure.
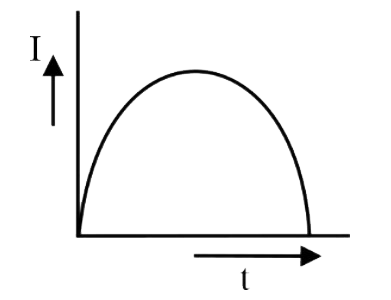
Which one of the following graphs gives the variation of voltage with time across the inductor?View SolutionThe current i in an induction coil varies with time according to the graph shown in figure. Which of the following graph shows induced emf in the coil with time:
View SolutionThe current (I) in the inductance is varying with time according to the plot shown in figure.
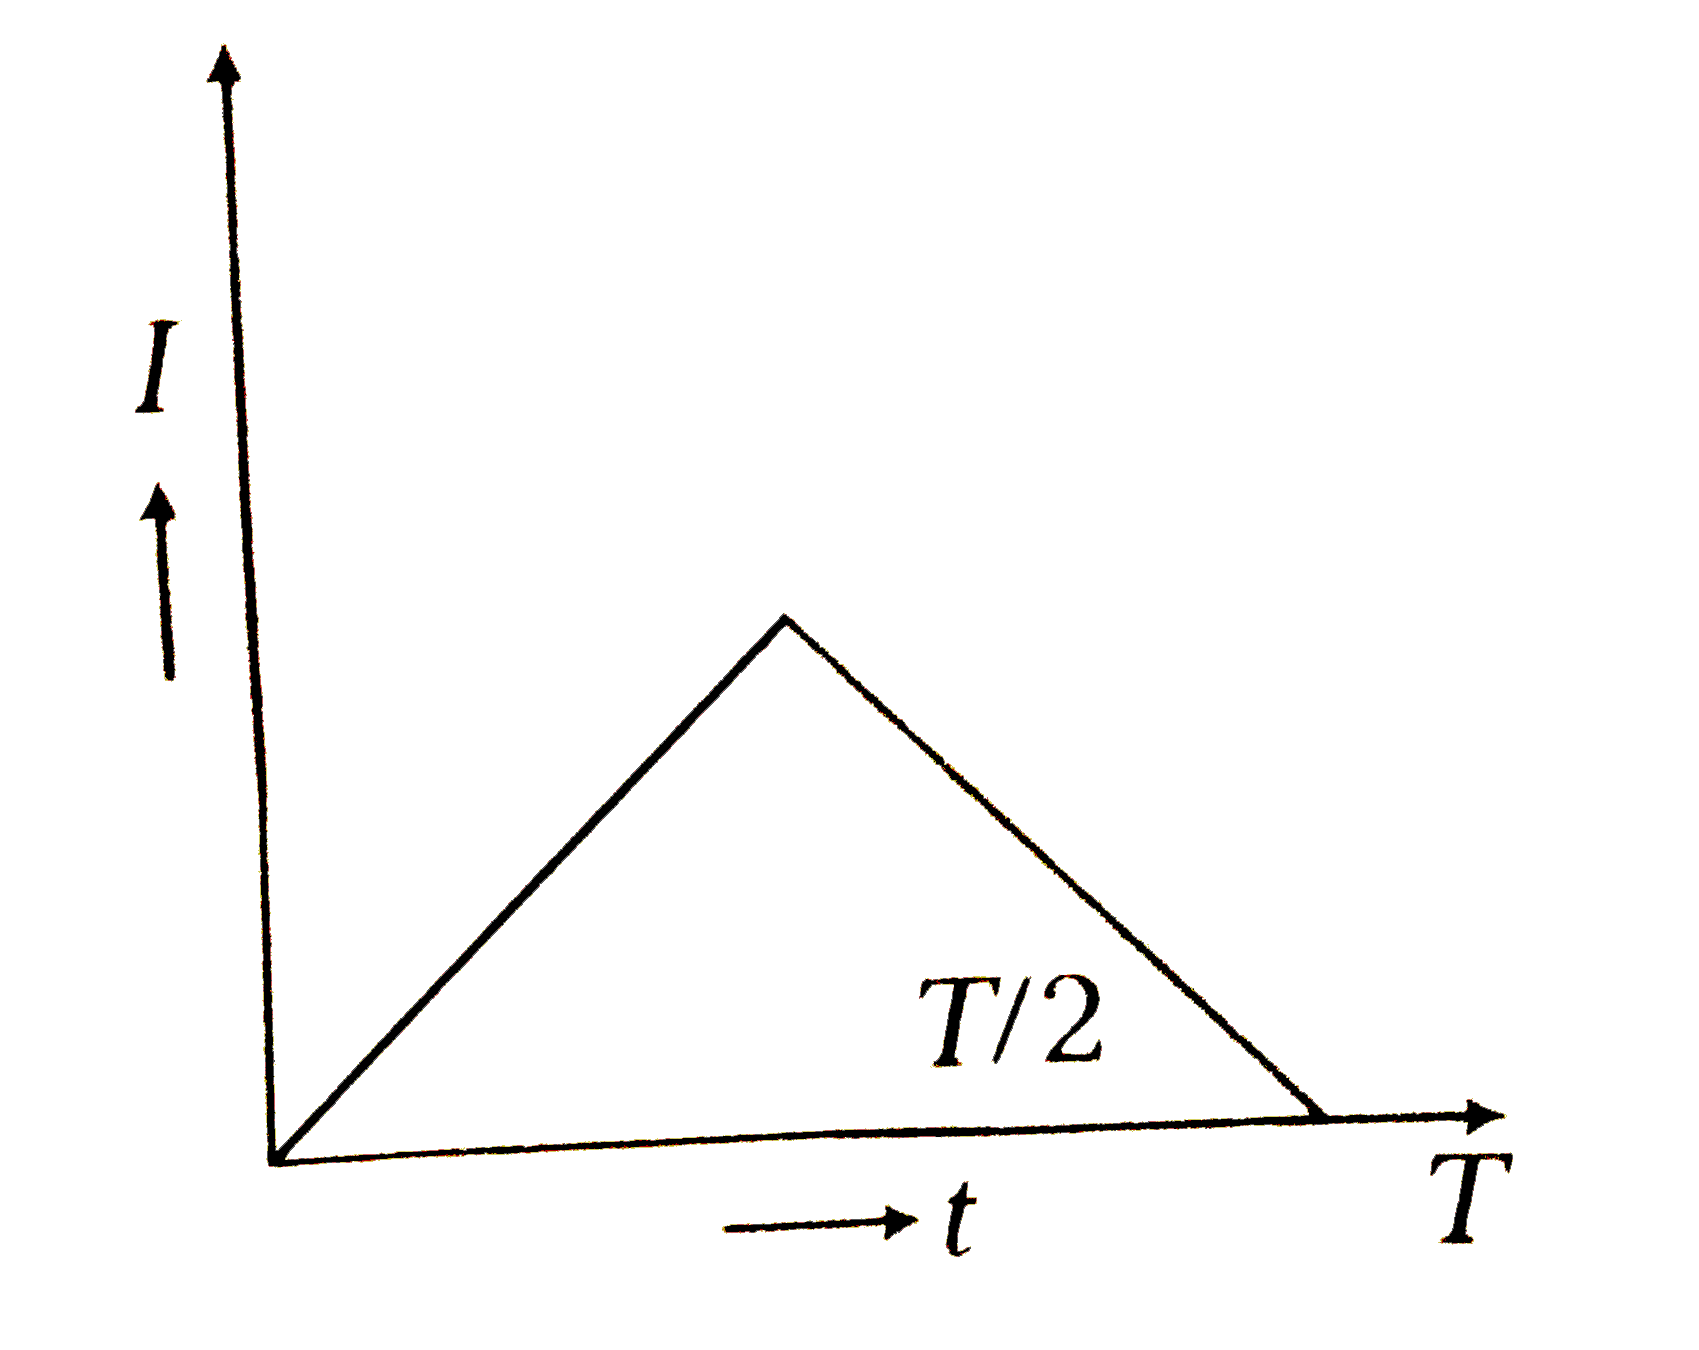
Which one of the following is the corrcet variation of voltage with time in the coil ?View SolutionThe current (I) in the inductance is varying with time according to the plot shown in figure.
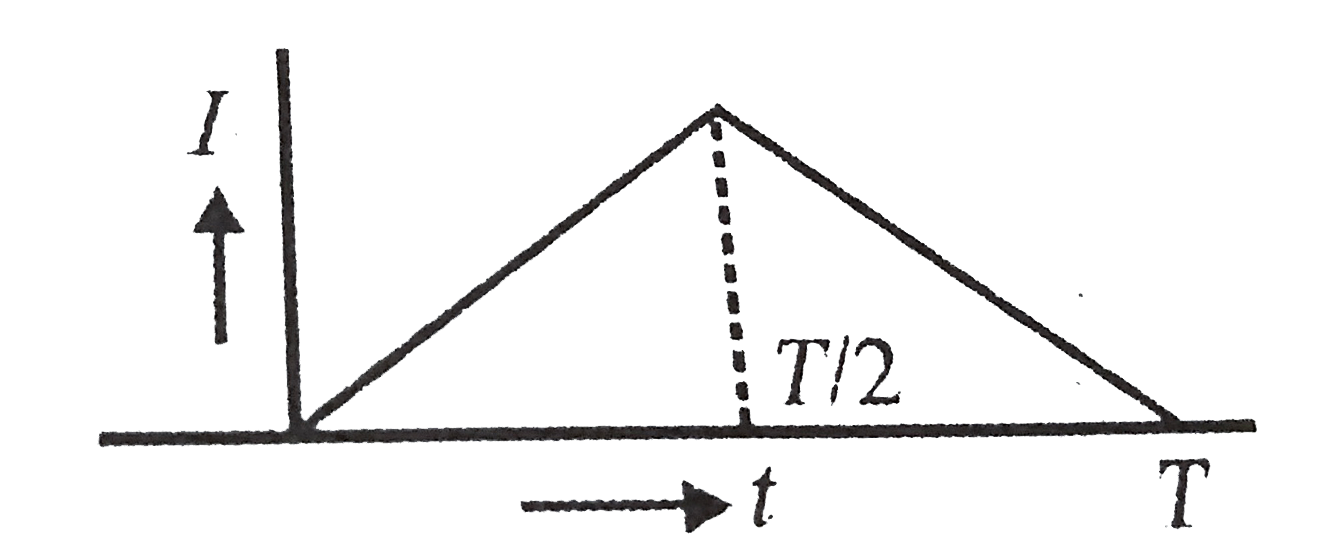
Which one of the following is the correct variation of voltage with time in the coil?View SolutionThe current i in an induction coil varies with time t according to the graph shown in the figure-5.250. Which of the following graphs shows the induced EMF in the coil with time ?
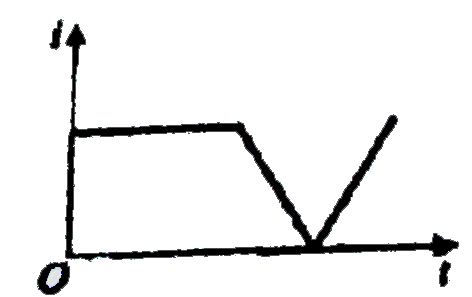 View Solution
The current i in an inductionn coil varies with time t according to the graph shown in the figure. Which of the following grahs shows athe induced emf (ε) in the coil with time?
 View Solution
The current i in an inductionn coil varies with time t according to the graph shown in the figure. Which of the following grahs shows athe induced emf (ε) in the coil with time?
 View Solution
The graph between the current and the time for an inductance coil is shown below. Which of the following graph show the voltage-time variation-
 View Solution
The graph shown the variation with times t of the velocity v of an object . Which one of the following graphs best represents the variation of acceleration a of the object with time t?
 View Solution
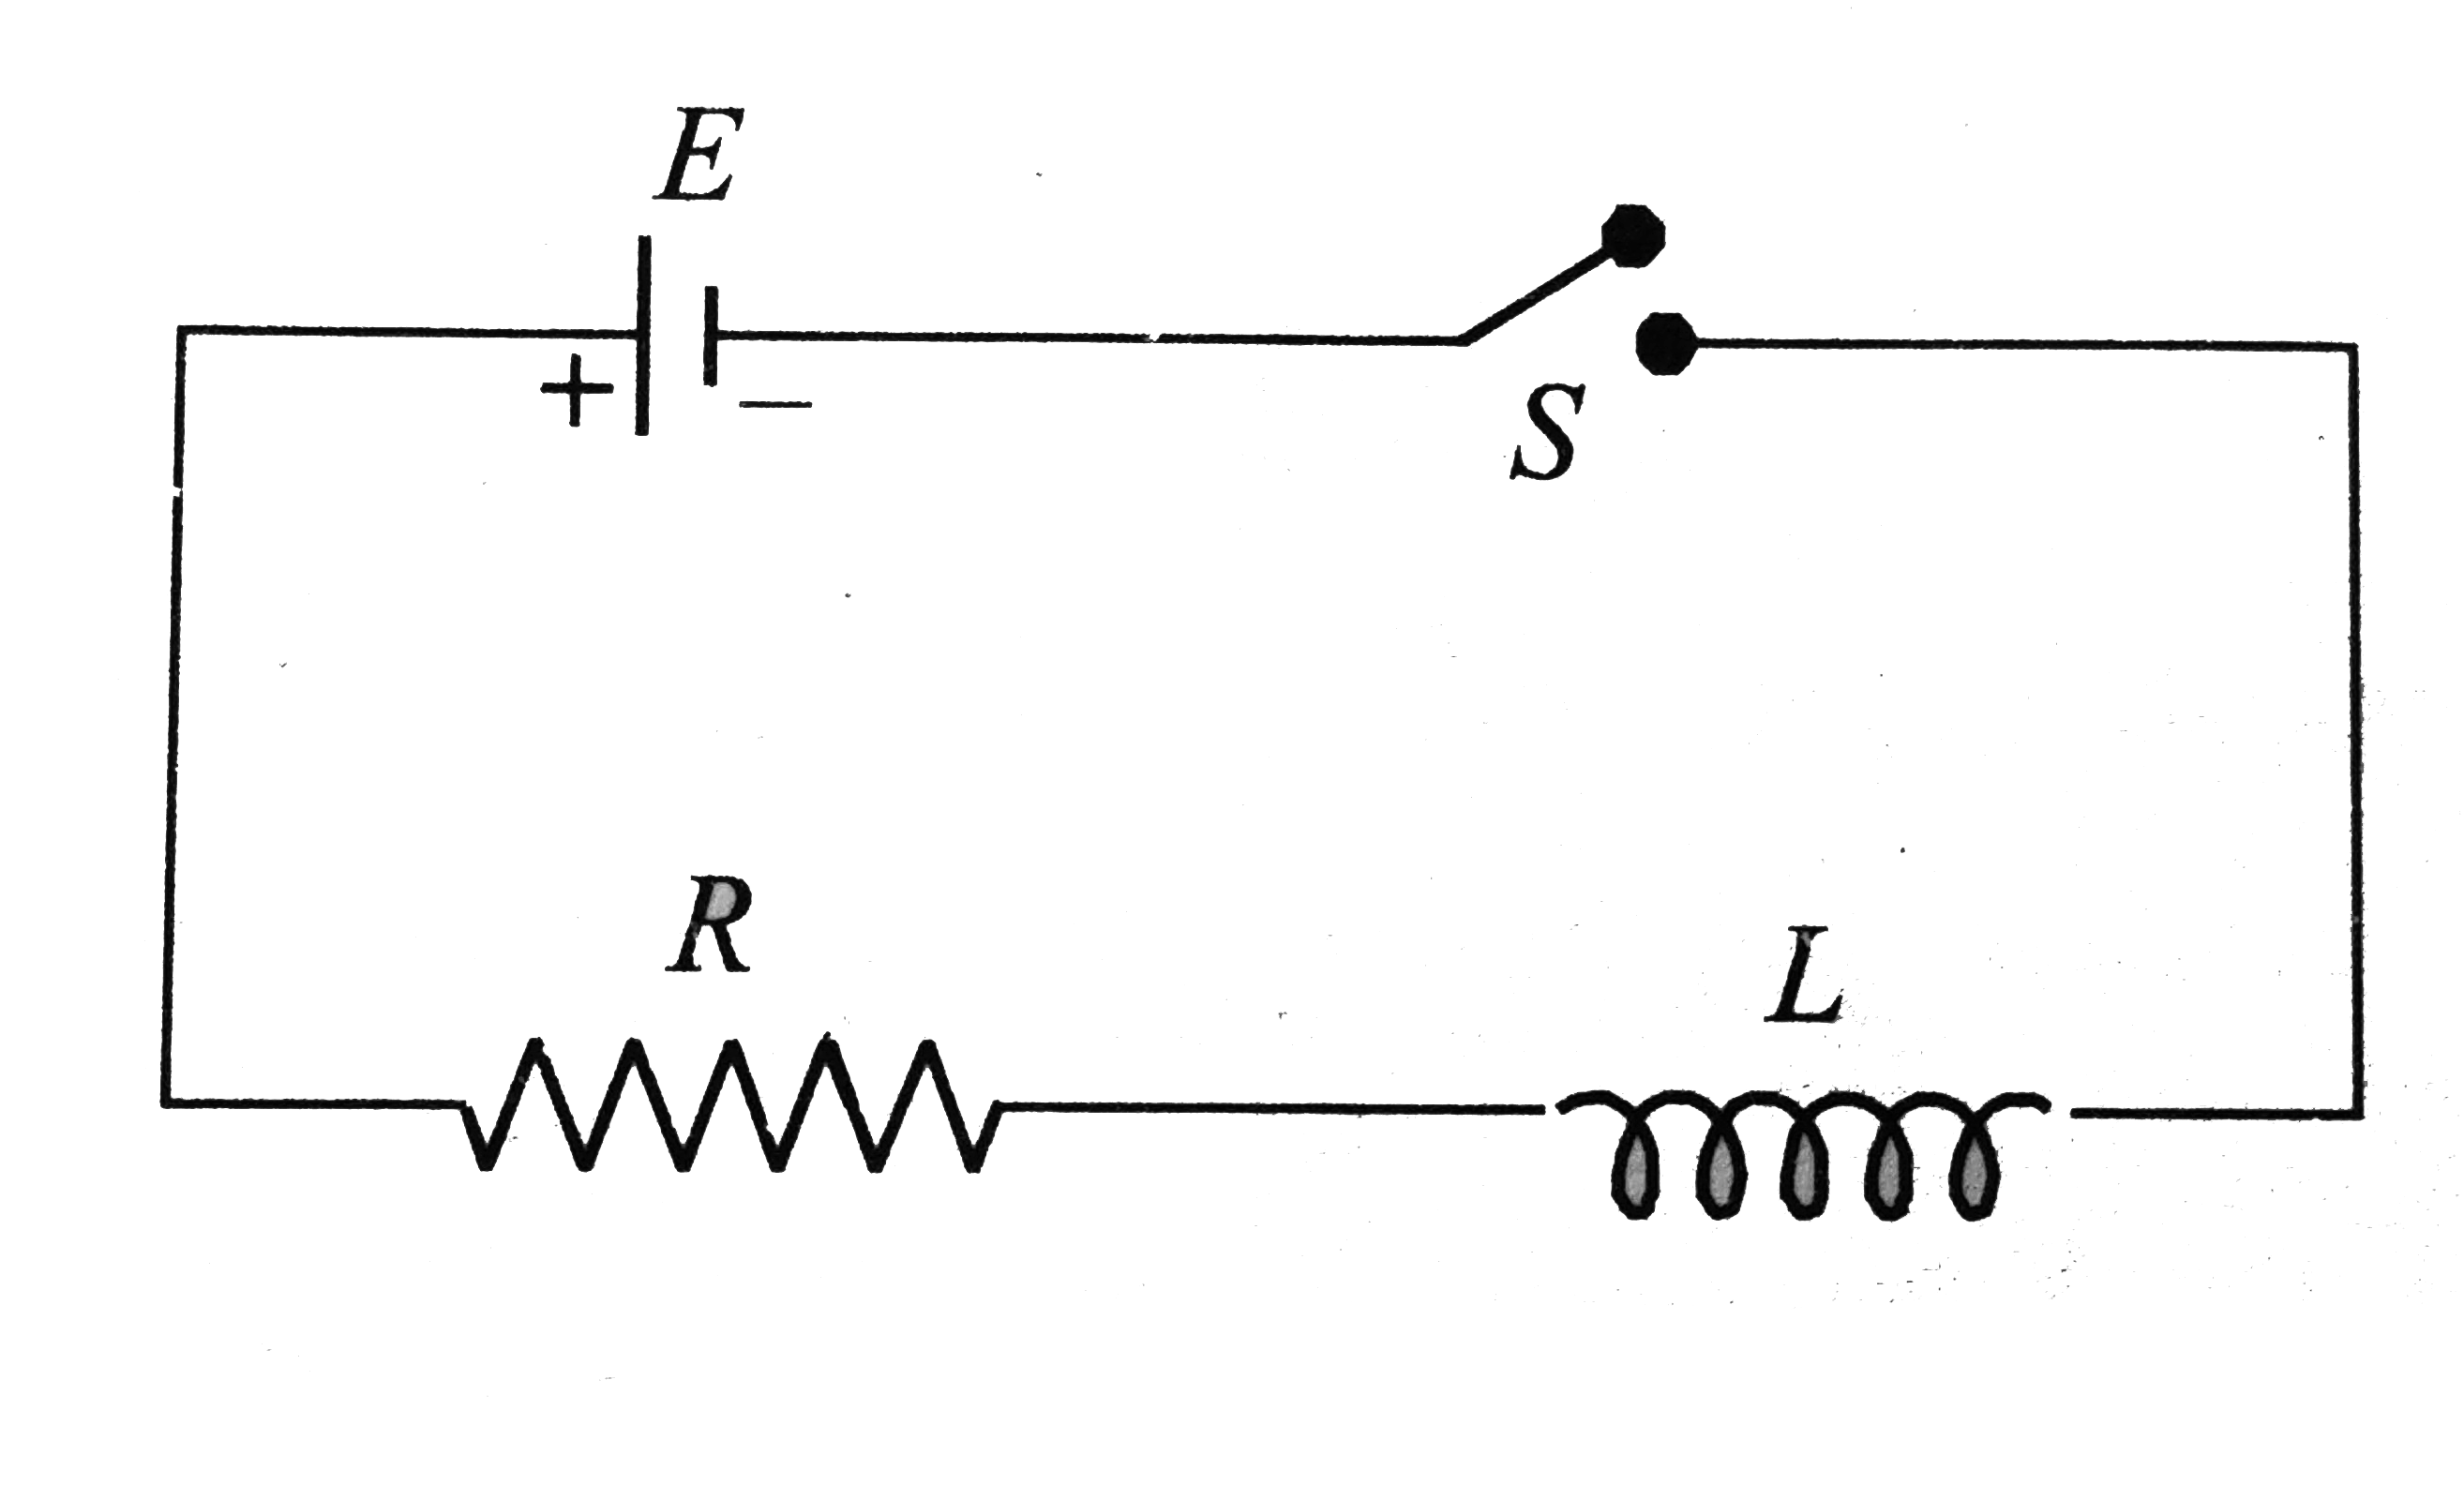
Switch S of the circuit shows in Fig. is closed at t=0. If e denotes the induced emf in L and i the current flowing through the circuit at time t, then which of the following graphs correctly represents the variation of e with i?
 View Solution

