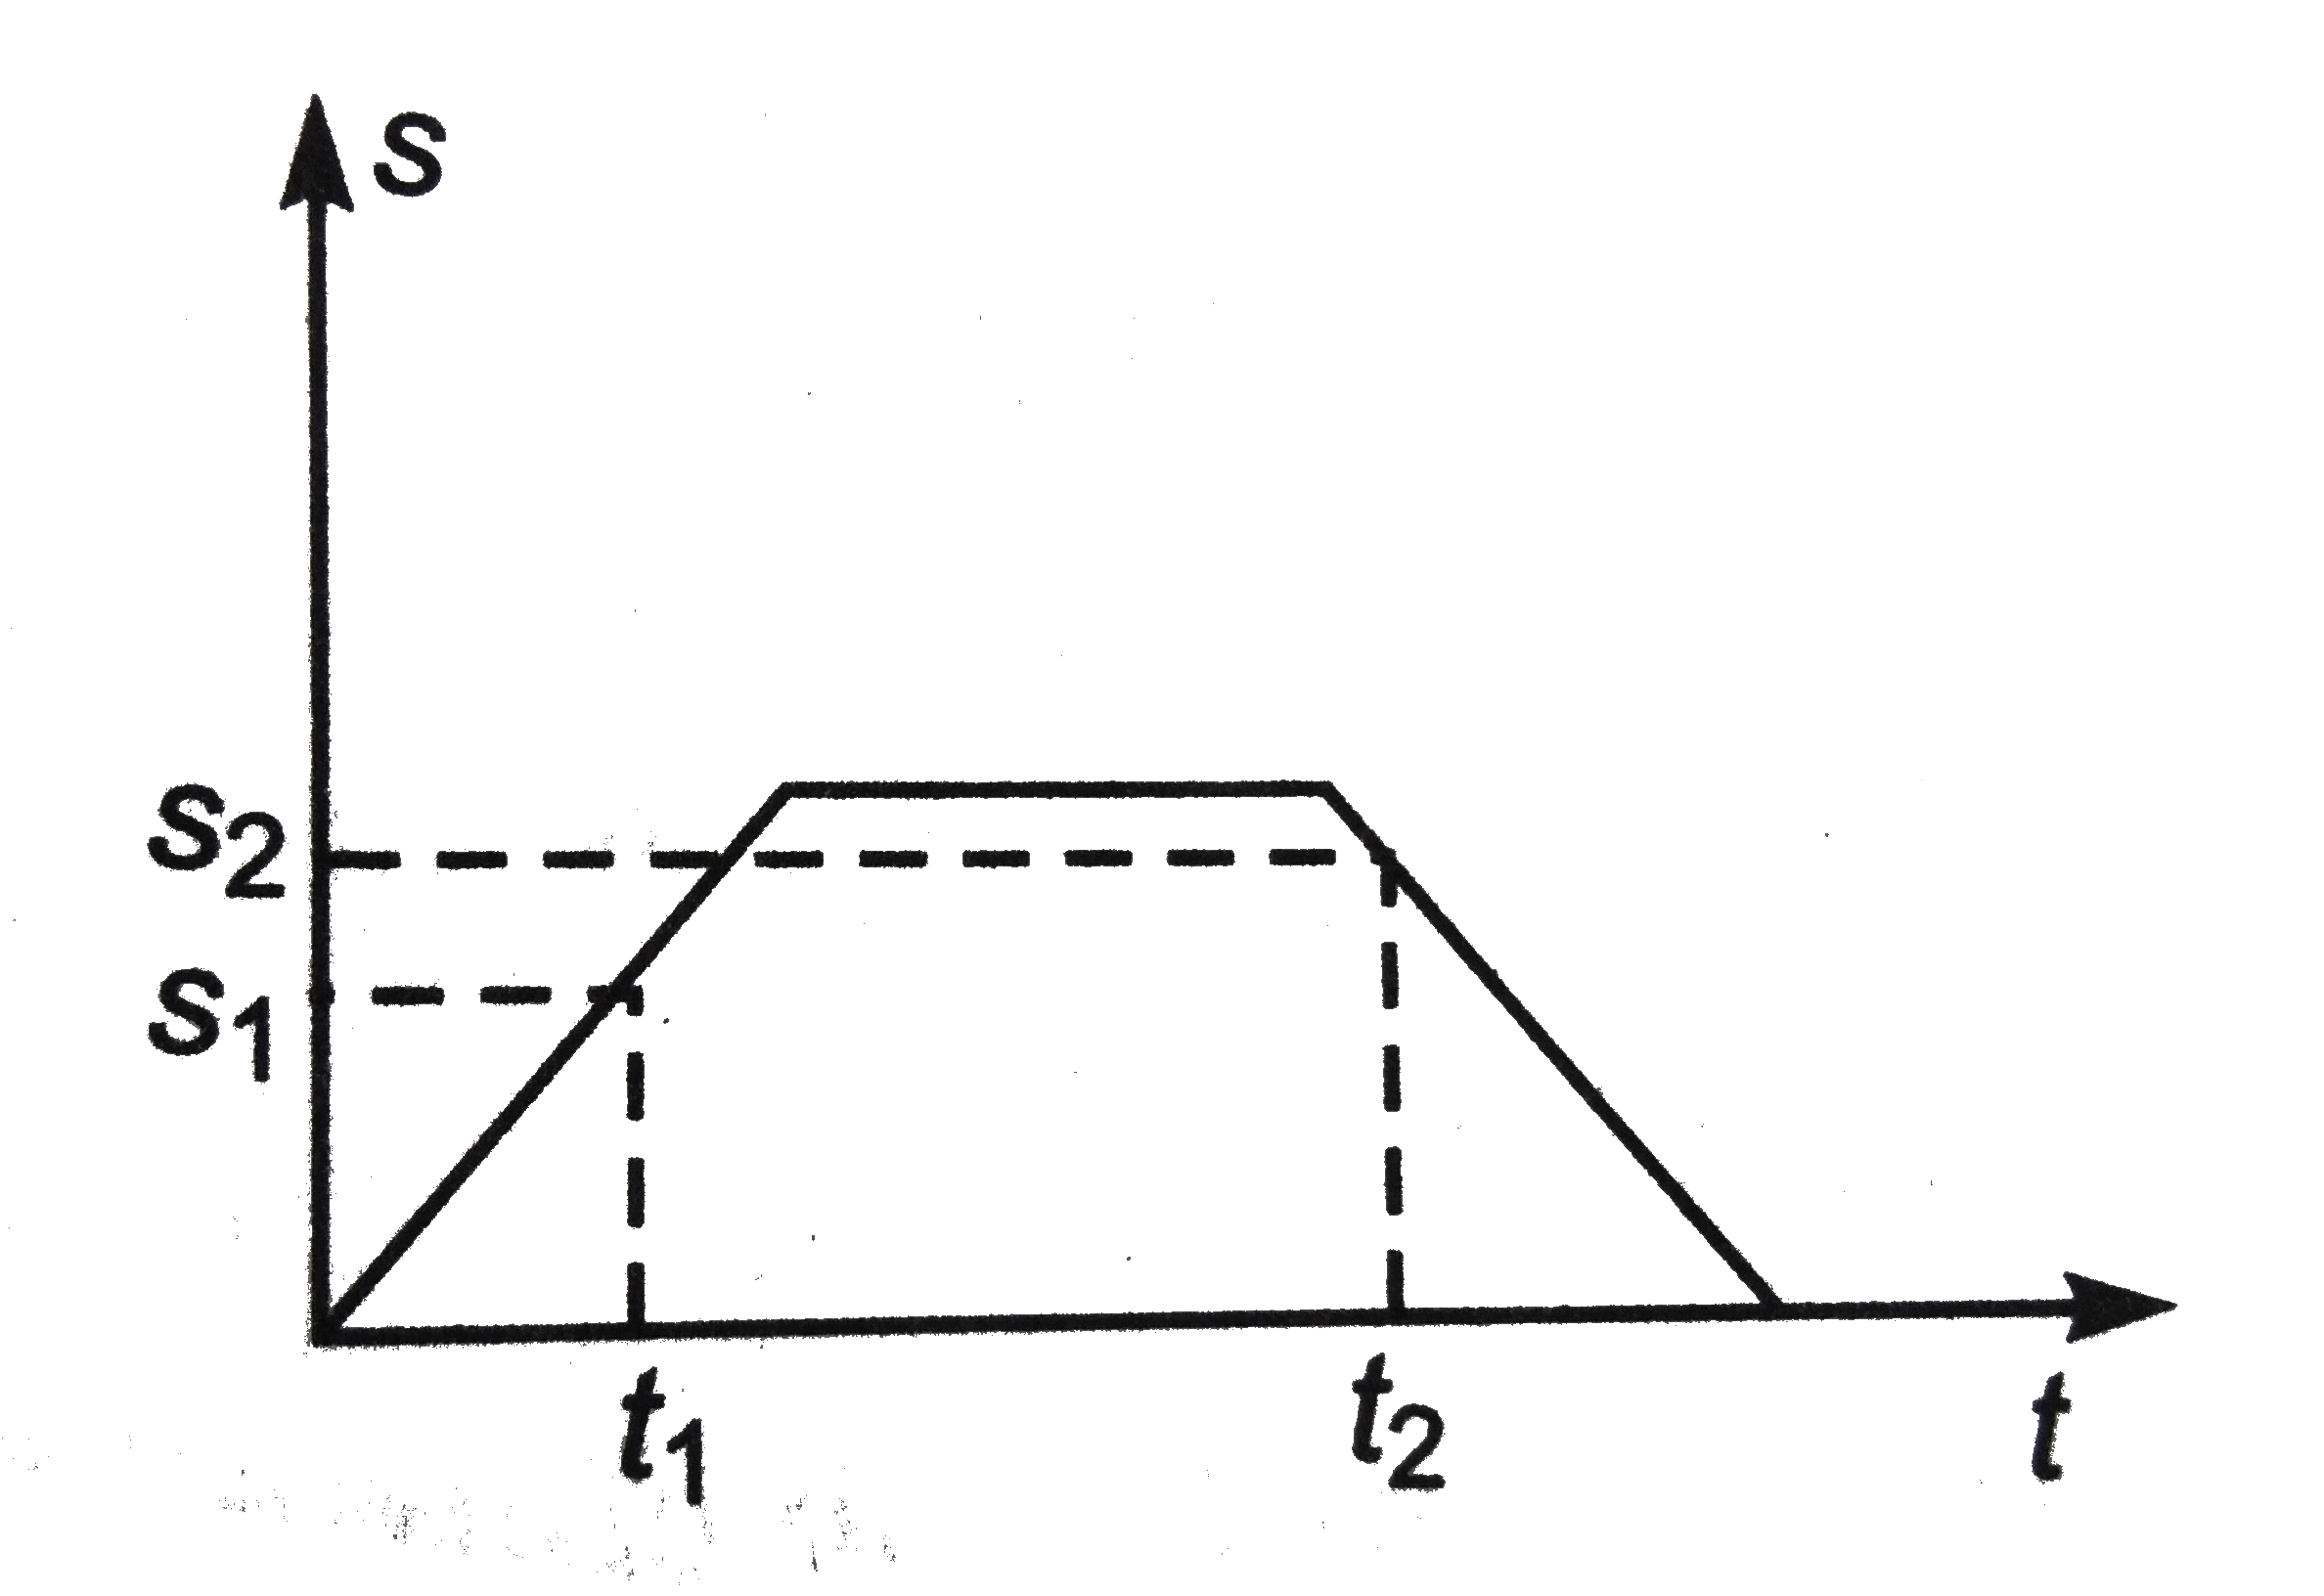
Asseration : Displacement time graph of a particle moving in a straight line is shown in figure. Work done by all the forces between time interval t1 and t2 is definitely zero.
 ,
,
Reason : Work done by all the forces is equal to change in kinetic energy.
If both Assertion and Reason are true and the Reason is correct explanation of the Assertion.
If both Assertion and Reason are true and the Reason is not the correct explanation of the Assertion.
If Assertion is true, but the Reason is false
If Assertion is false but the Reason is true.
The correct Answer is:D
WAll=ΔK=Kf−Ki
=12m(v2f−v2i)
vf=vt2=Slope of s−t graph at t2
vi=vt1=slopeofstgraphatt1
these two slopes are not necessarily equal.
Similar Questions
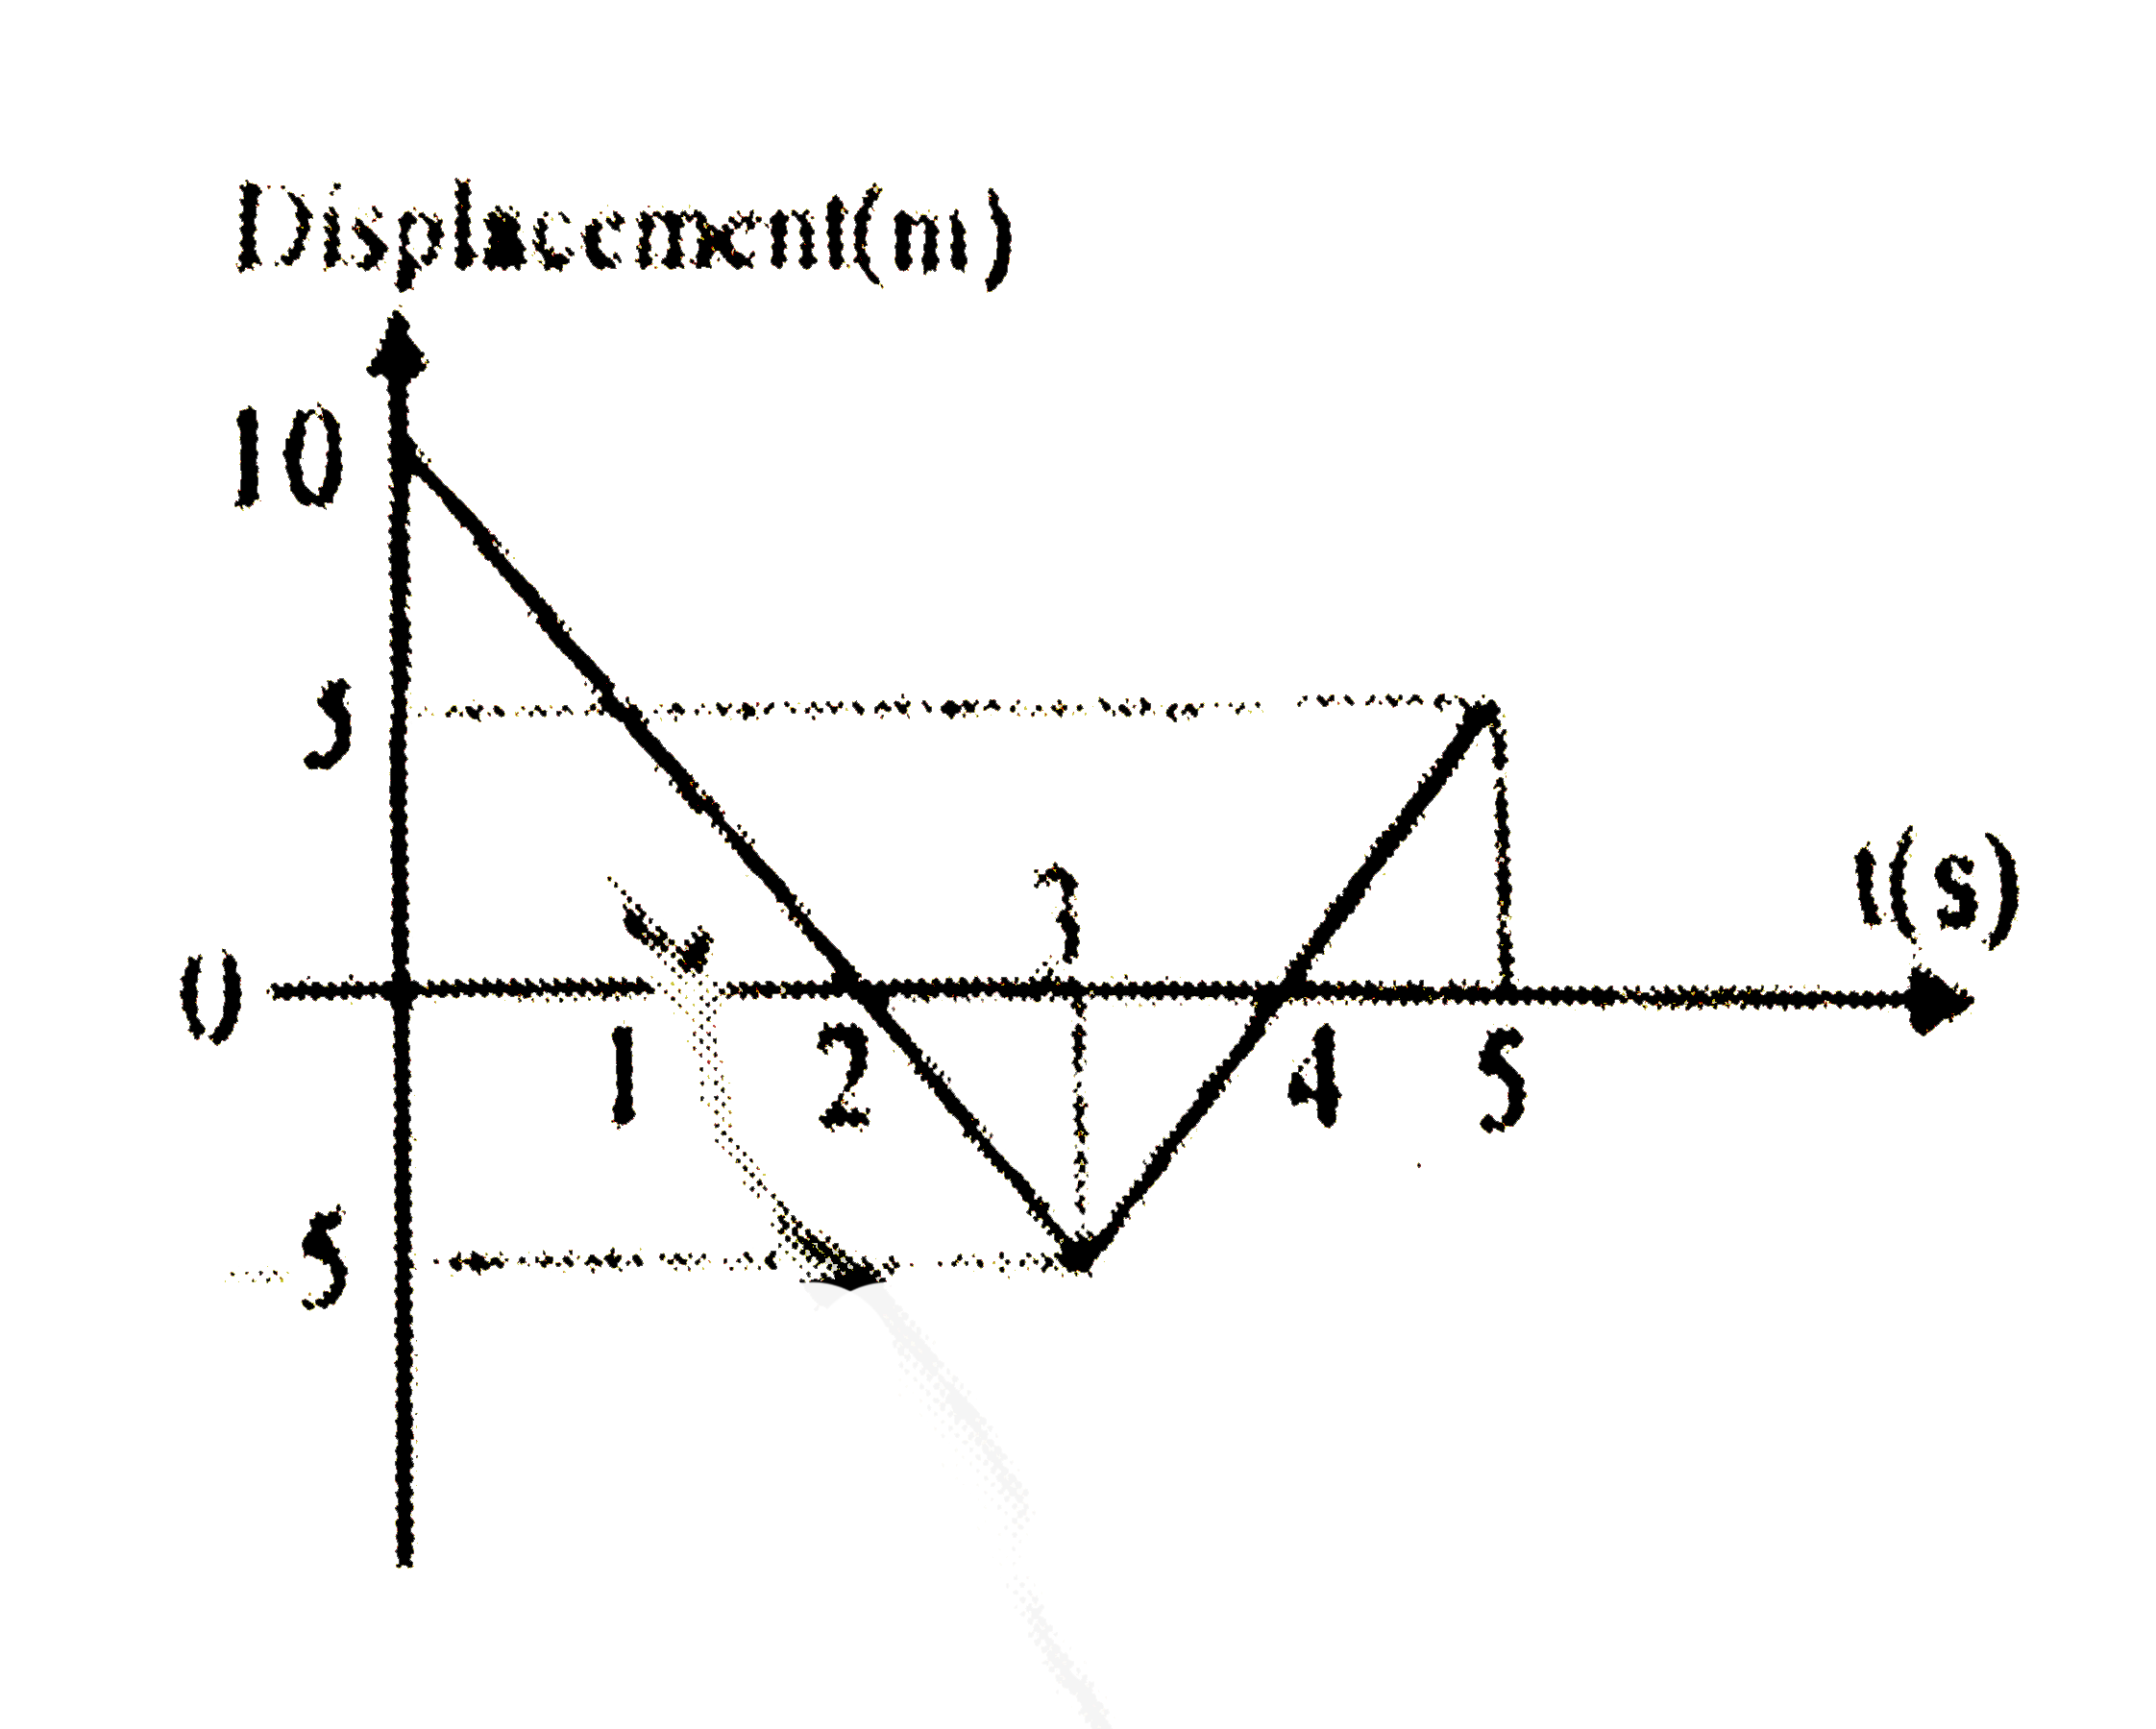
The diagram shows the displacement - time graph for a particle moving in a straight line. The distance (in m) coverted by the particle in the time interval t=0 to t=5s is
 View Solution
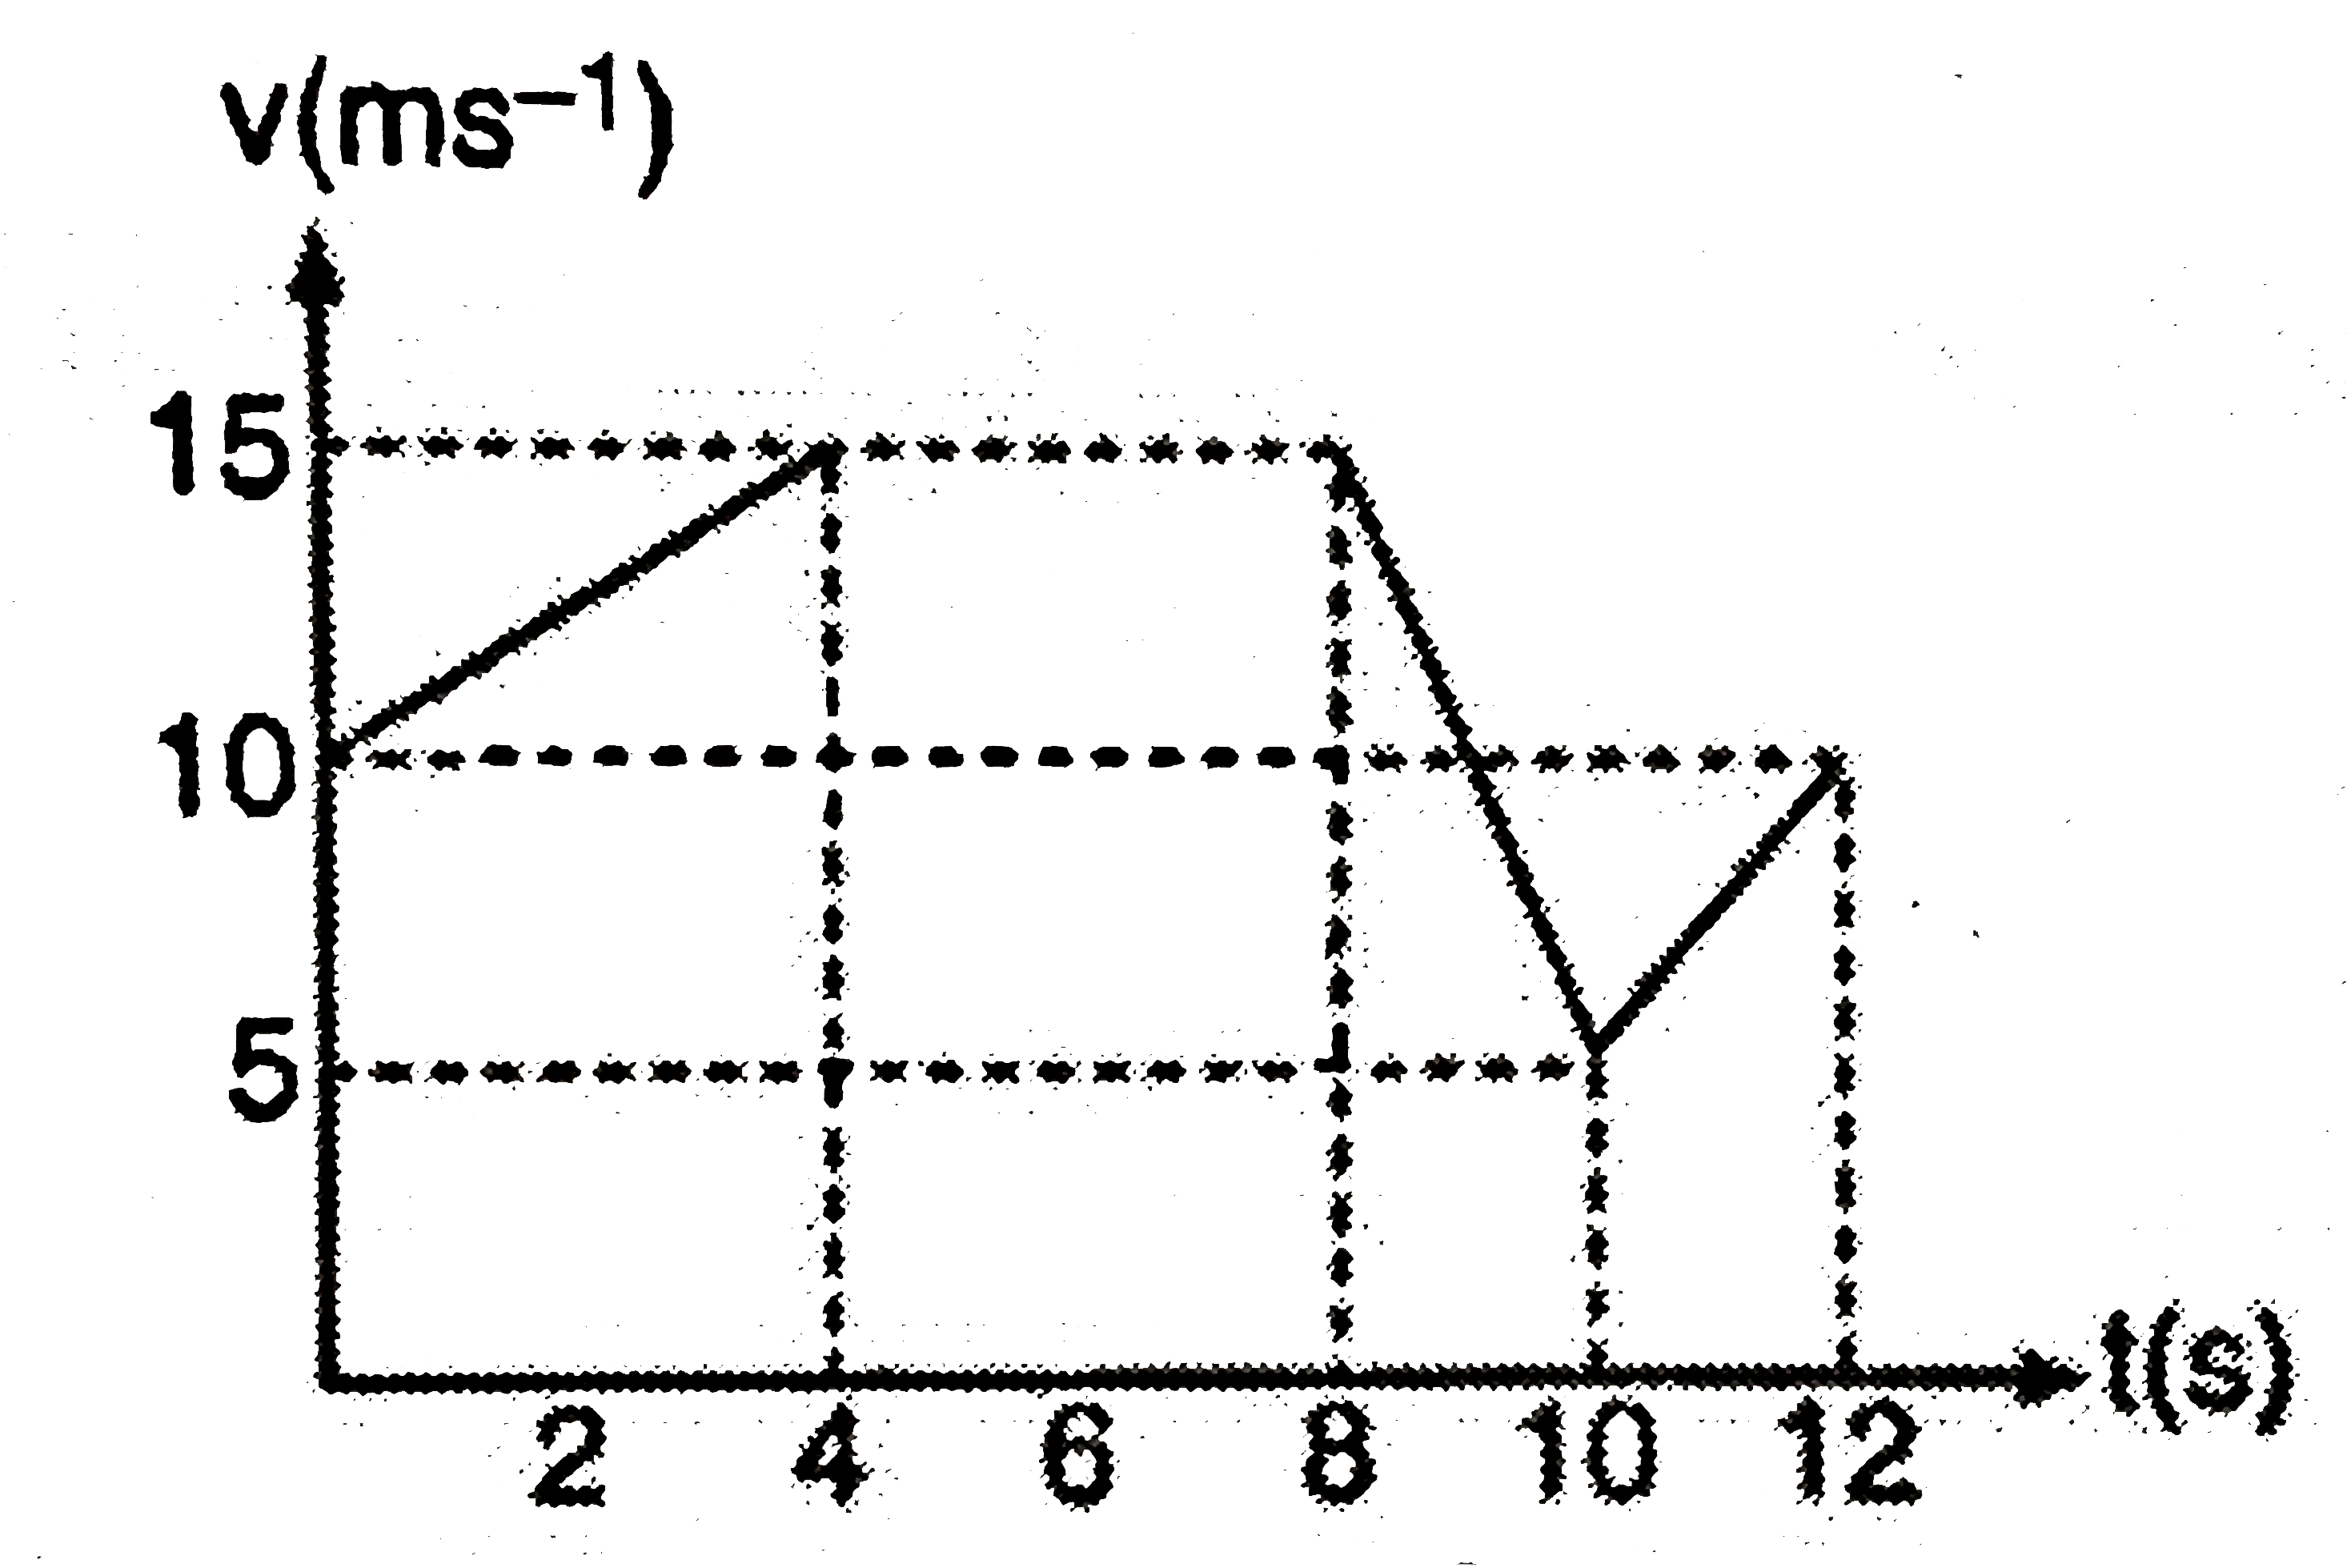
The velocity -time (v−t) graph of a particle moving in a straight line is shown in figure. The acceleration of the particle at t=9 is:
 View Solution
Knowledge Check
- Question 1 - Select One or More
Displacement time graph of a particle moving in a straight line is a shown in figure.
 Ain region A acceleration is positiveBin region B acceleration is negativeCin region C acceleration is positiveDin region D acceleration is negative
 - Question 2 - Select One
The total work done on a particle is equal to the change in its kinetic energy
AalwaysBonly if the forces acting on ilt are conservativeConly if gravitational force alone acts on itDonly if elastic force alone acts on it - Question 3 - Select One or More
Displacement time graph of a particle moving in a straight line is as shown in figure.
From the graph we can conclude that work done on the block is :
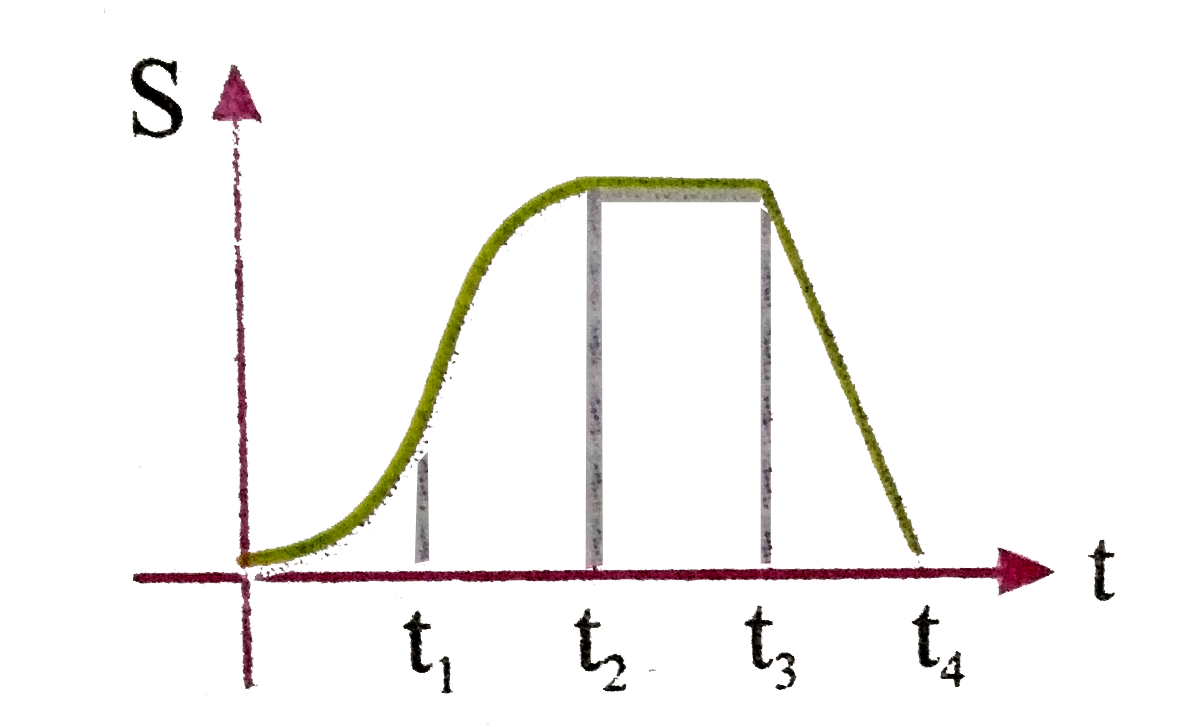 .Apositive from 0 to t1Bnegative from t1 to t2Czero from t2 to t3Dnegative from t3 to t4.
The x-t graph of a particle moving along a straight line is shown in figure
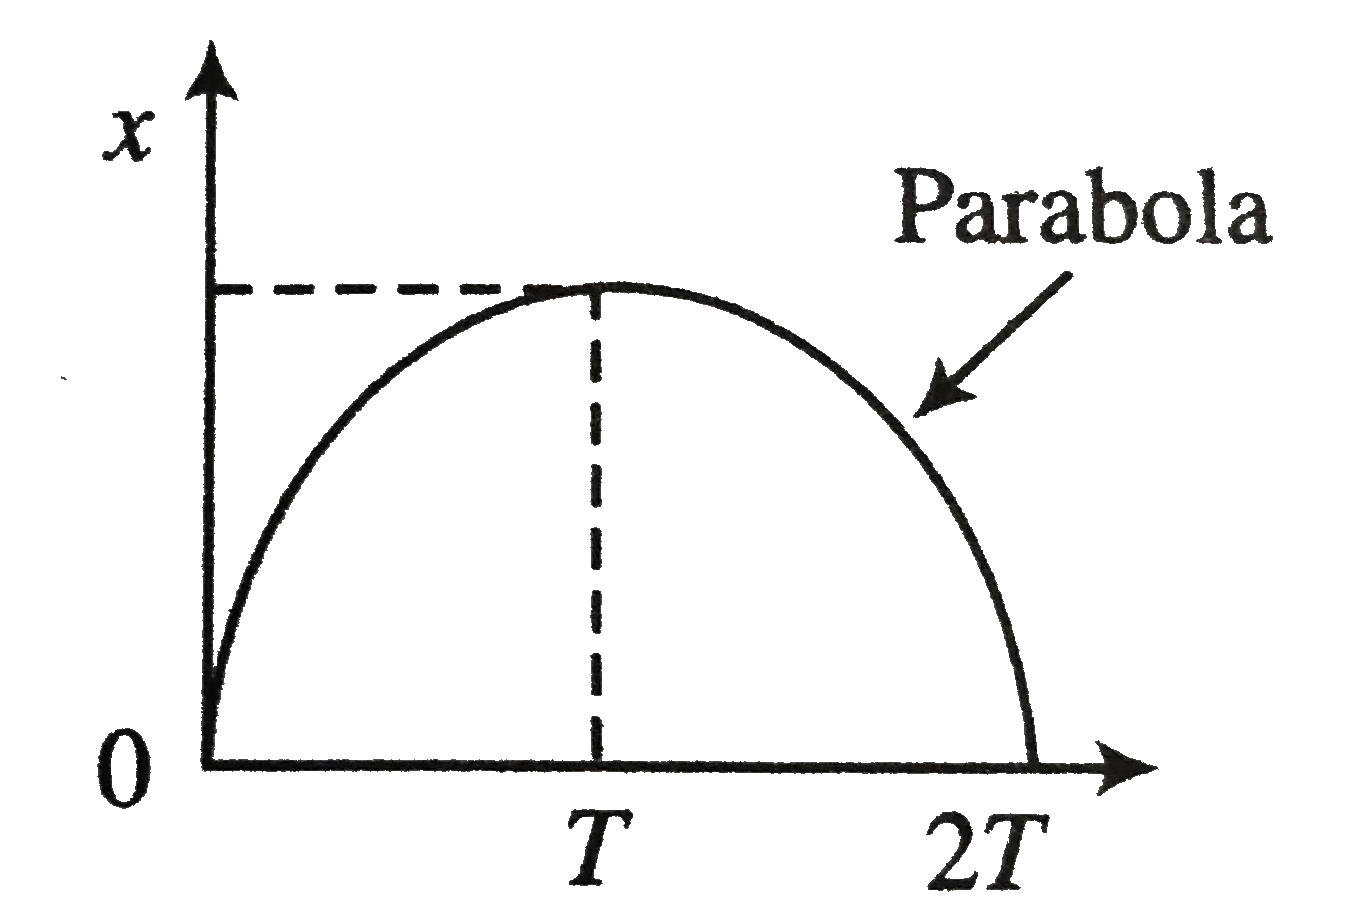
The a-t graph of the particle is correctly shown byView SolutionThe x-t graph of a particle moving along a straight line is shown in figure

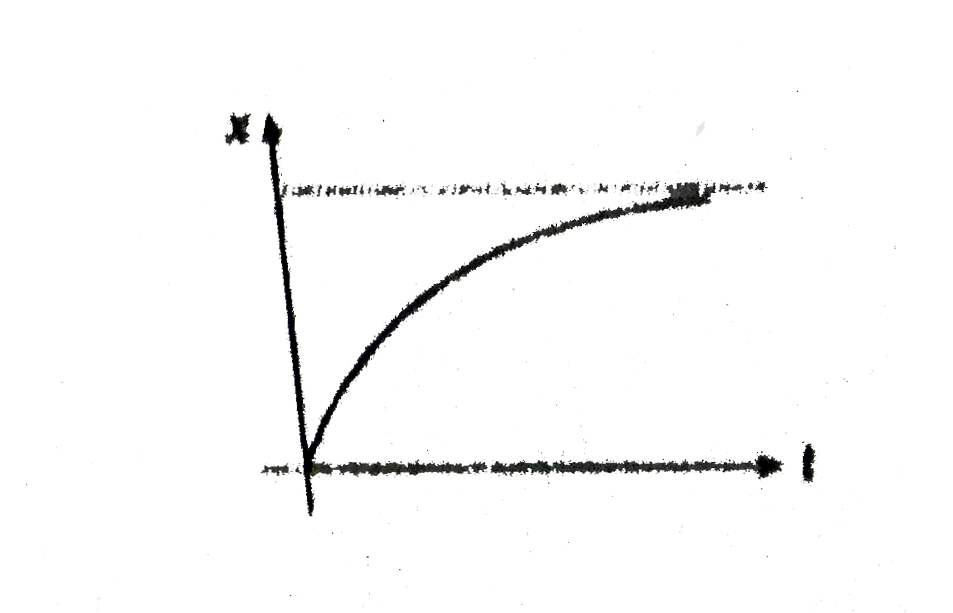
The v-t graph of the particle is correctly shown byView SolutionVariation of displacement x of a particle moving on a straight line with time t is shown in following figure. The figure indicates :
 View Solution
The x−t graph of particle moving along a straight line is shown in figure
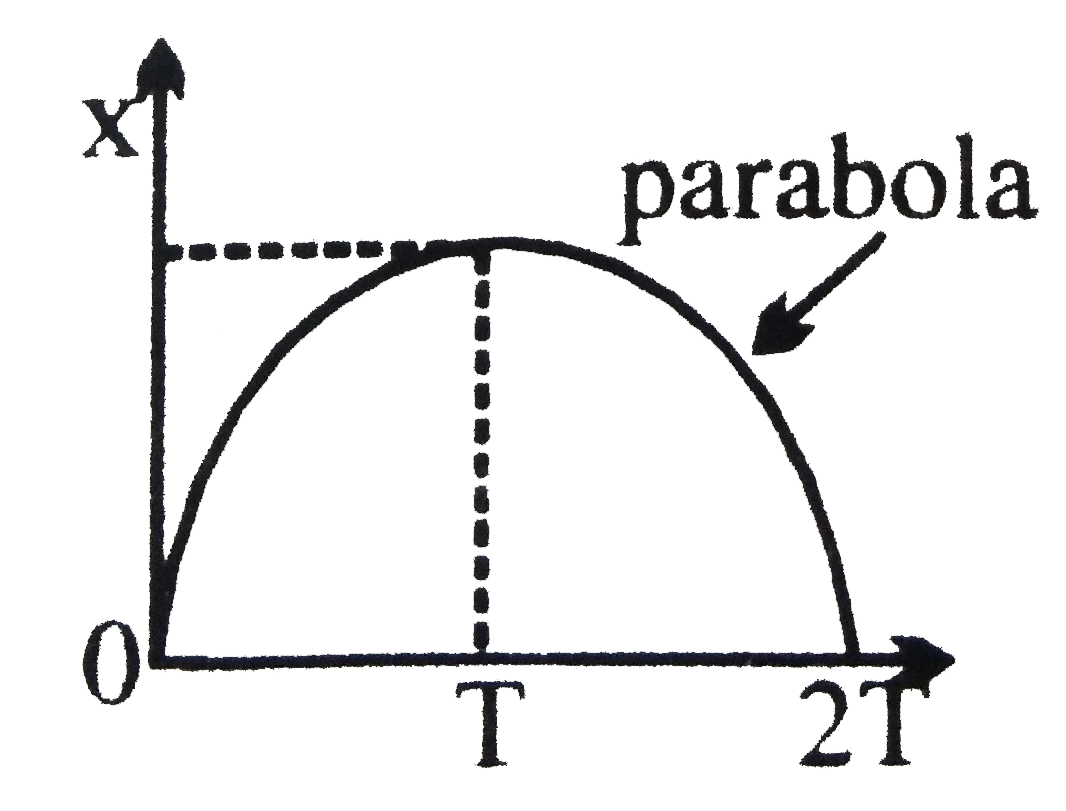
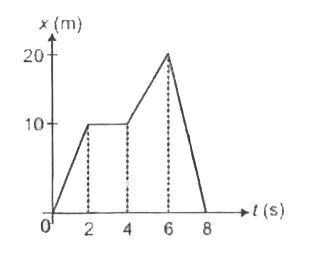
The a−t graph of the particle is correctly shown byView SolutionThe position (x) - time (t) graph for a particle moving along a straight line is shown in figure. The average speed of particle in time interval t = 0 to t = 8 s is
 View Solution

