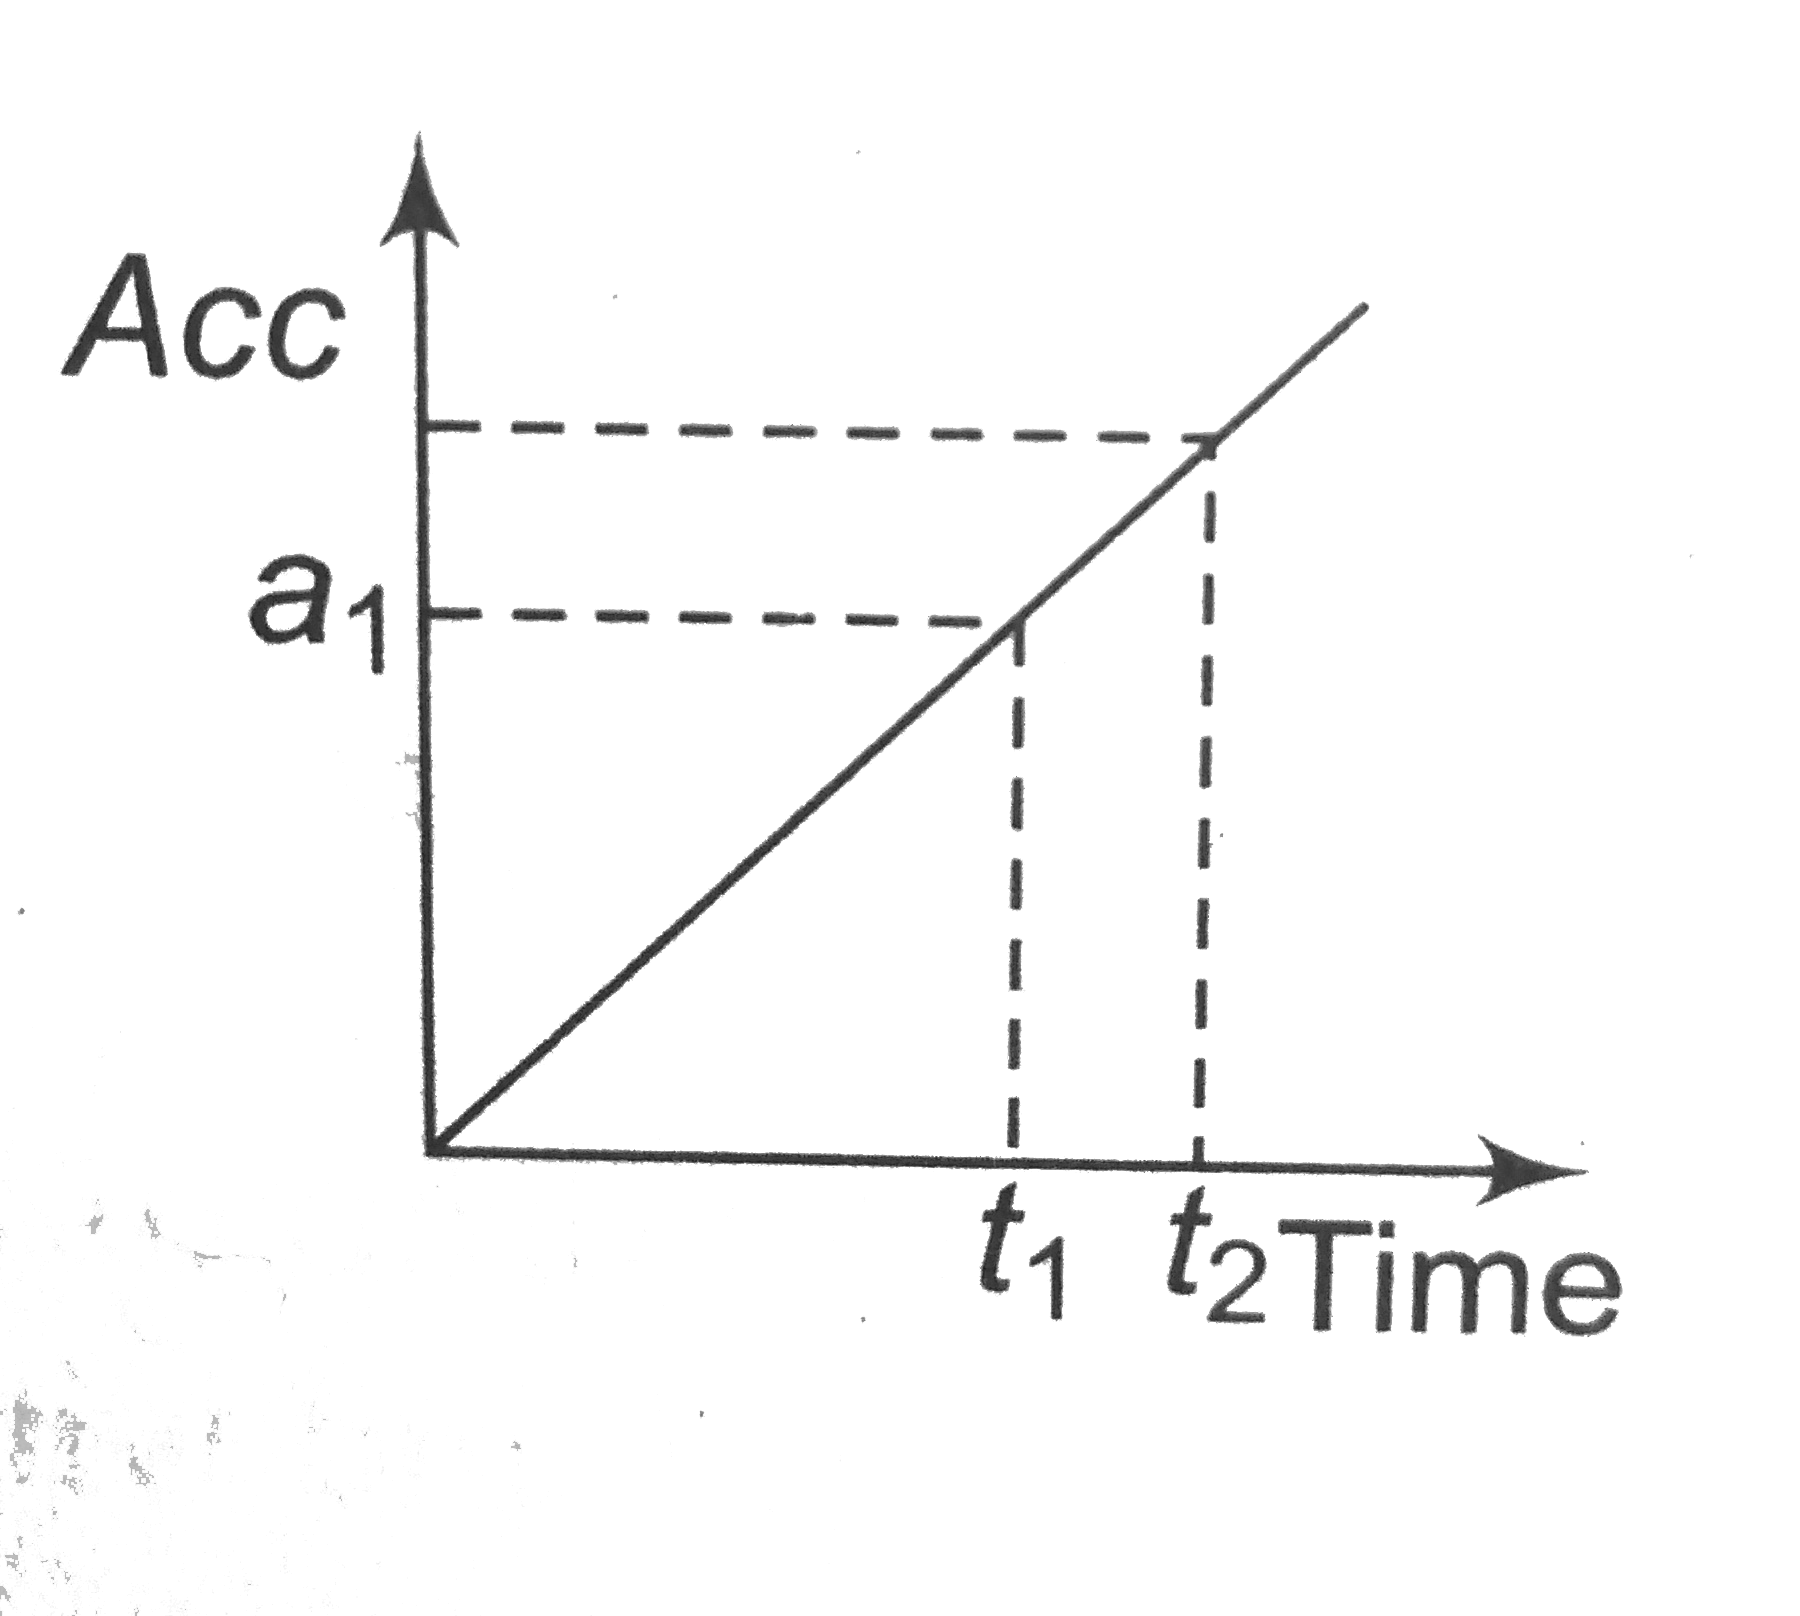
Acceleration time graph of a particle is shown work done by all the force acting on the particle of mass m in line internalt1 and t2 while a1 is the acceleration at time t1 given by t=0 particle was at rest
ma214t1(t32−t21)
ma218t21(t42−t41)
ma214t21(t42−t41)
ma14t1(t22−t21)
The correct Answer is:B
W=Kf−Ki=12(mv21−v21)
Area under acceleration - time graph is change velocity
so, W=12m[(12a2t2)2−(12a1t1)2)]
=18m[t42t21a21−a21t21] (since a2=t2t1a1)
=ma218t21(t42−t41).
Topper's Solved these Questions
- WORK, ENERGY, POWER AND COLLISIONBOOK - A2ZCHAPTER - WORK, ENERGY, POWER AND COLLISIONEXERCISE - Potential Energy, Conservative And Non-Conservative Forces
28 Videos
- WORK, ENERGY, POWER AND COLLISIONBOOK - A2ZCHAPTER - WORK, ENERGY, POWER AND COLLISIONEXERCISE - Conservation Of Mechanical Energy And Linear Momentum
24 Videos
- WORK, ENERGY, POWER AND COLLISIONBOOK - A2ZCHAPTER - WORK, ENERGY, POWER AND COLLISIONEXERCISE - Chapter Test
29 Videos
- WAVES AND ACOUSTICSBOOK - A2ZCHAPTER - WAVES AND ACOUSTICSEXERCISE - Chapter Test
30 Videos
Similar Questions
Acceleration-time graph of a particle moving in a straight line is as shown in figure. At time t=0, velocity of the particle is zero. Find
(a) average acceleration in a time interval from t=6s to t=12s,
(b) velocity of the particle at t=14s.
View SolutionThe velovity-time graph of a particle moving in a straitht line is shown in . The acceleration of the particle at t=9s is.
 .
.
View Solution
Knowledge Check
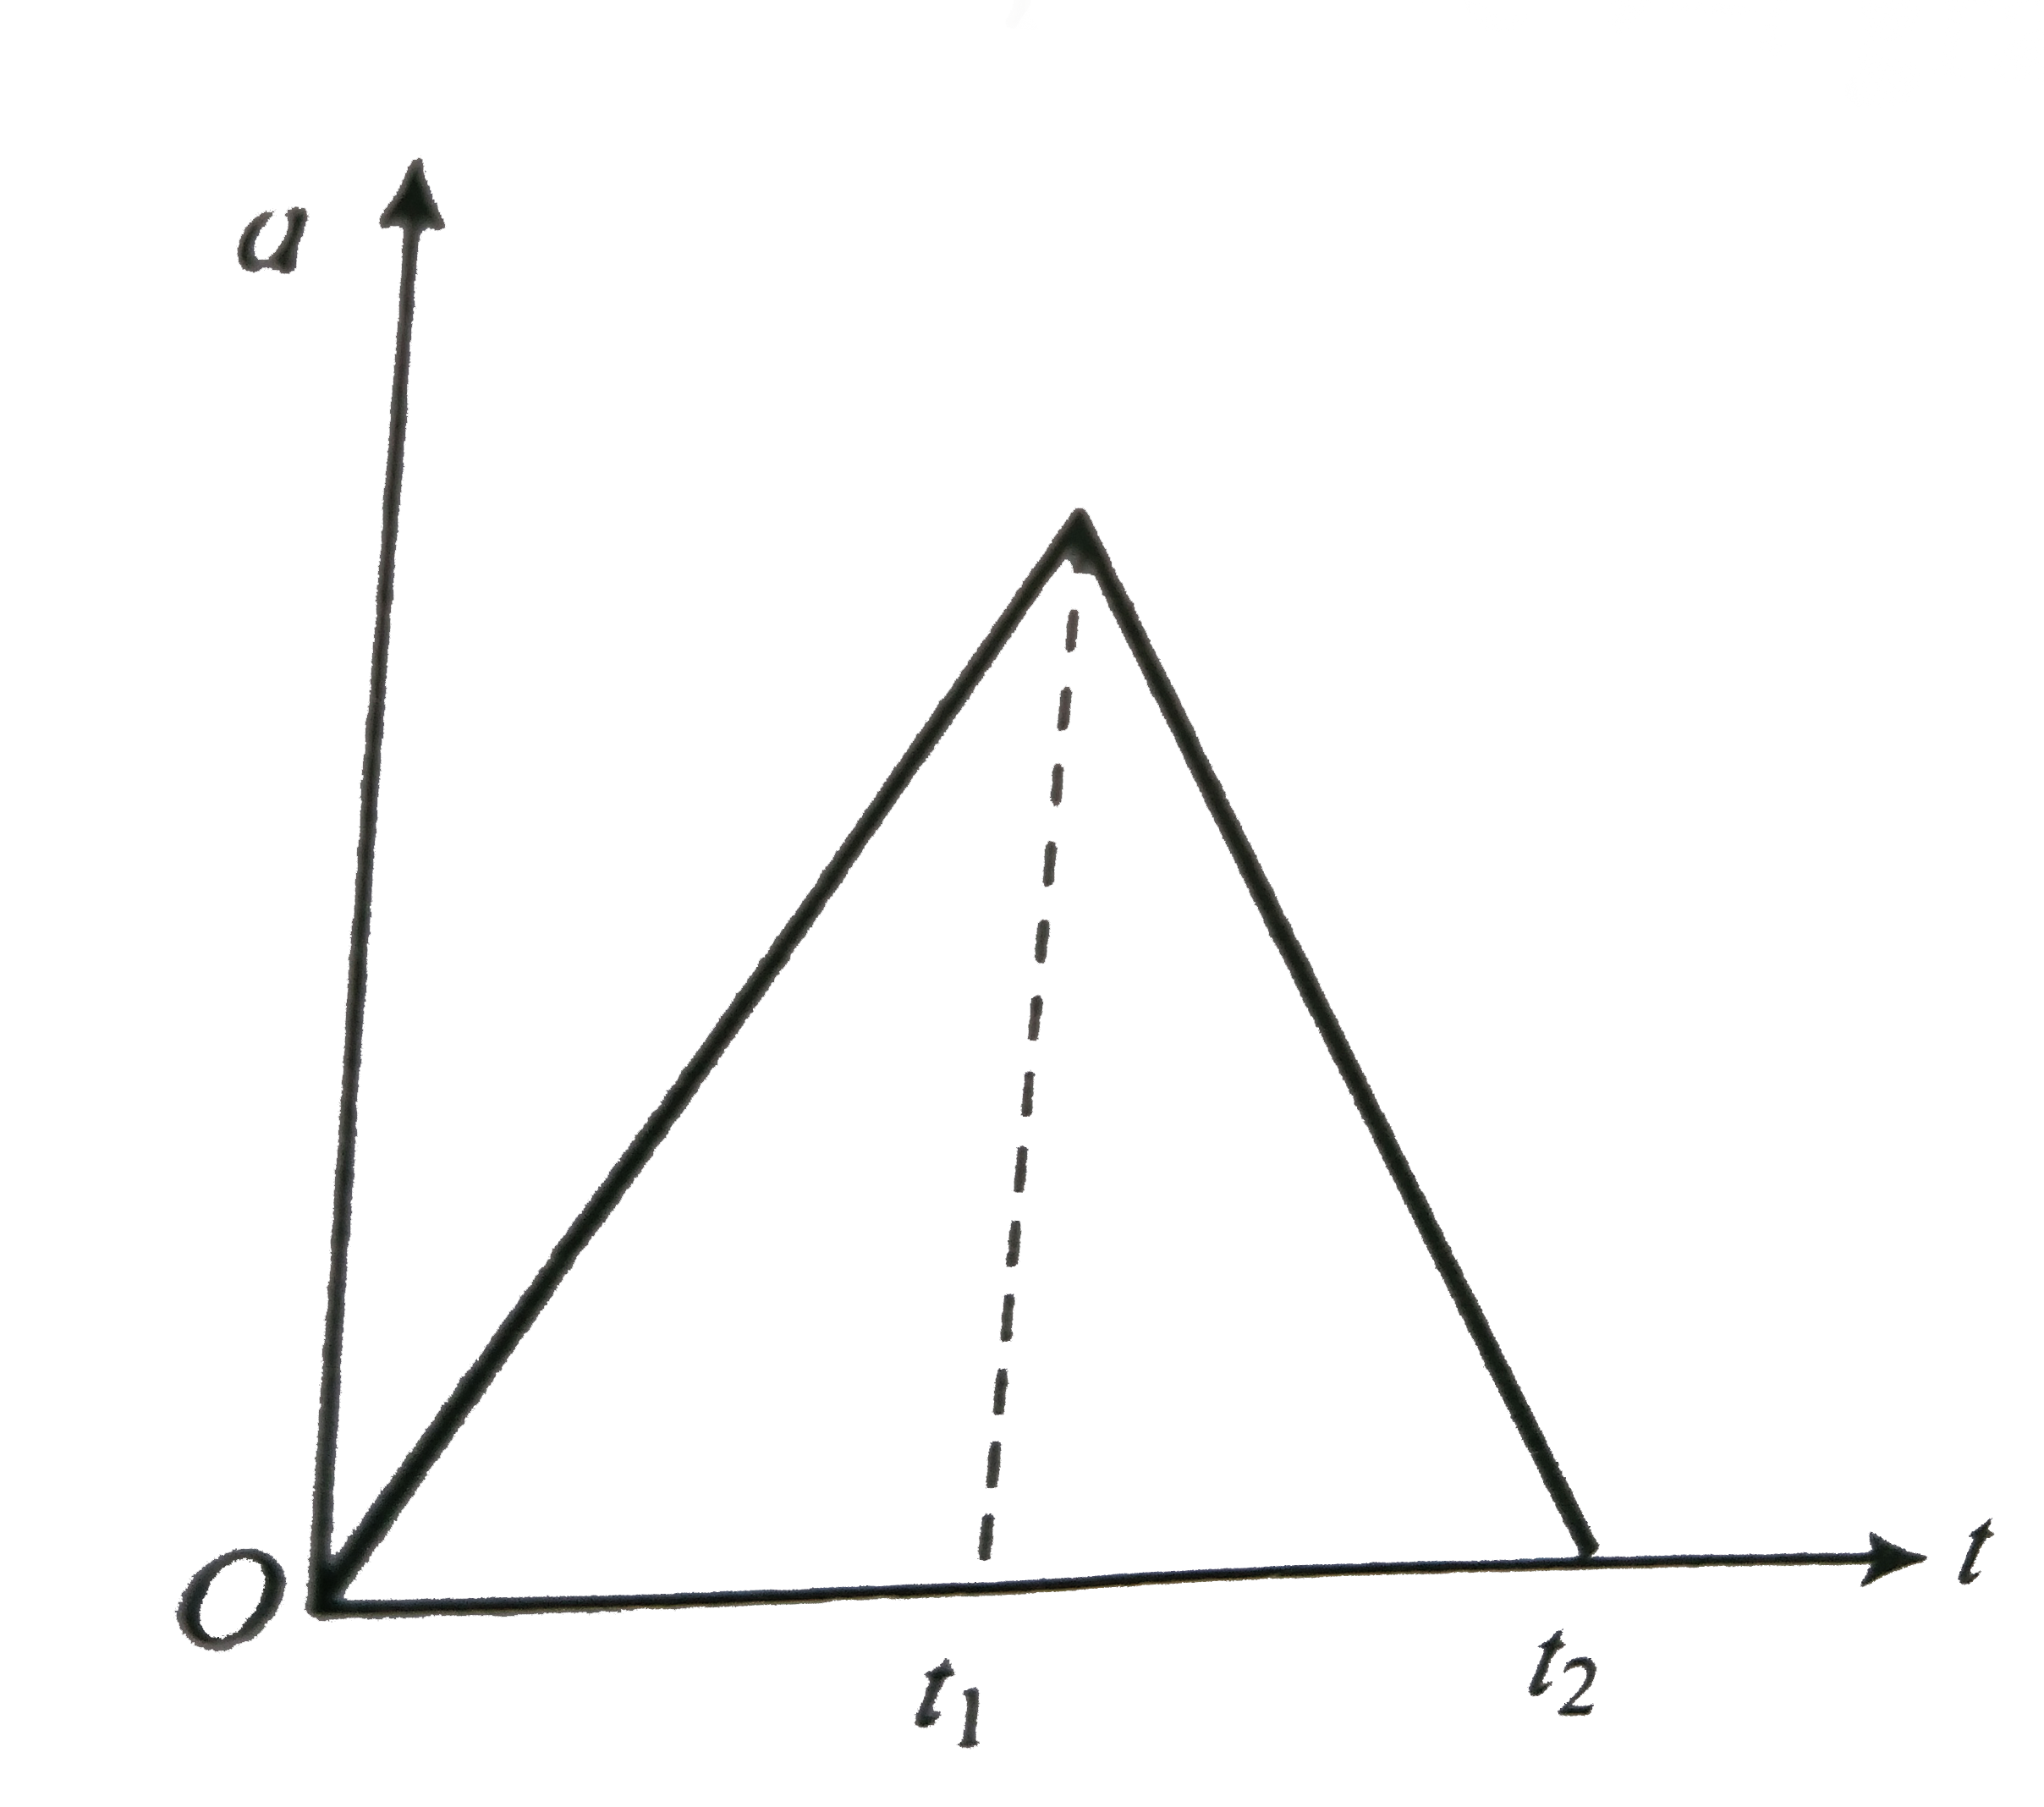
The acceleration versus time graph of a particle is shown in the figure. The respective v−t graph of the particle is .
 .A
.A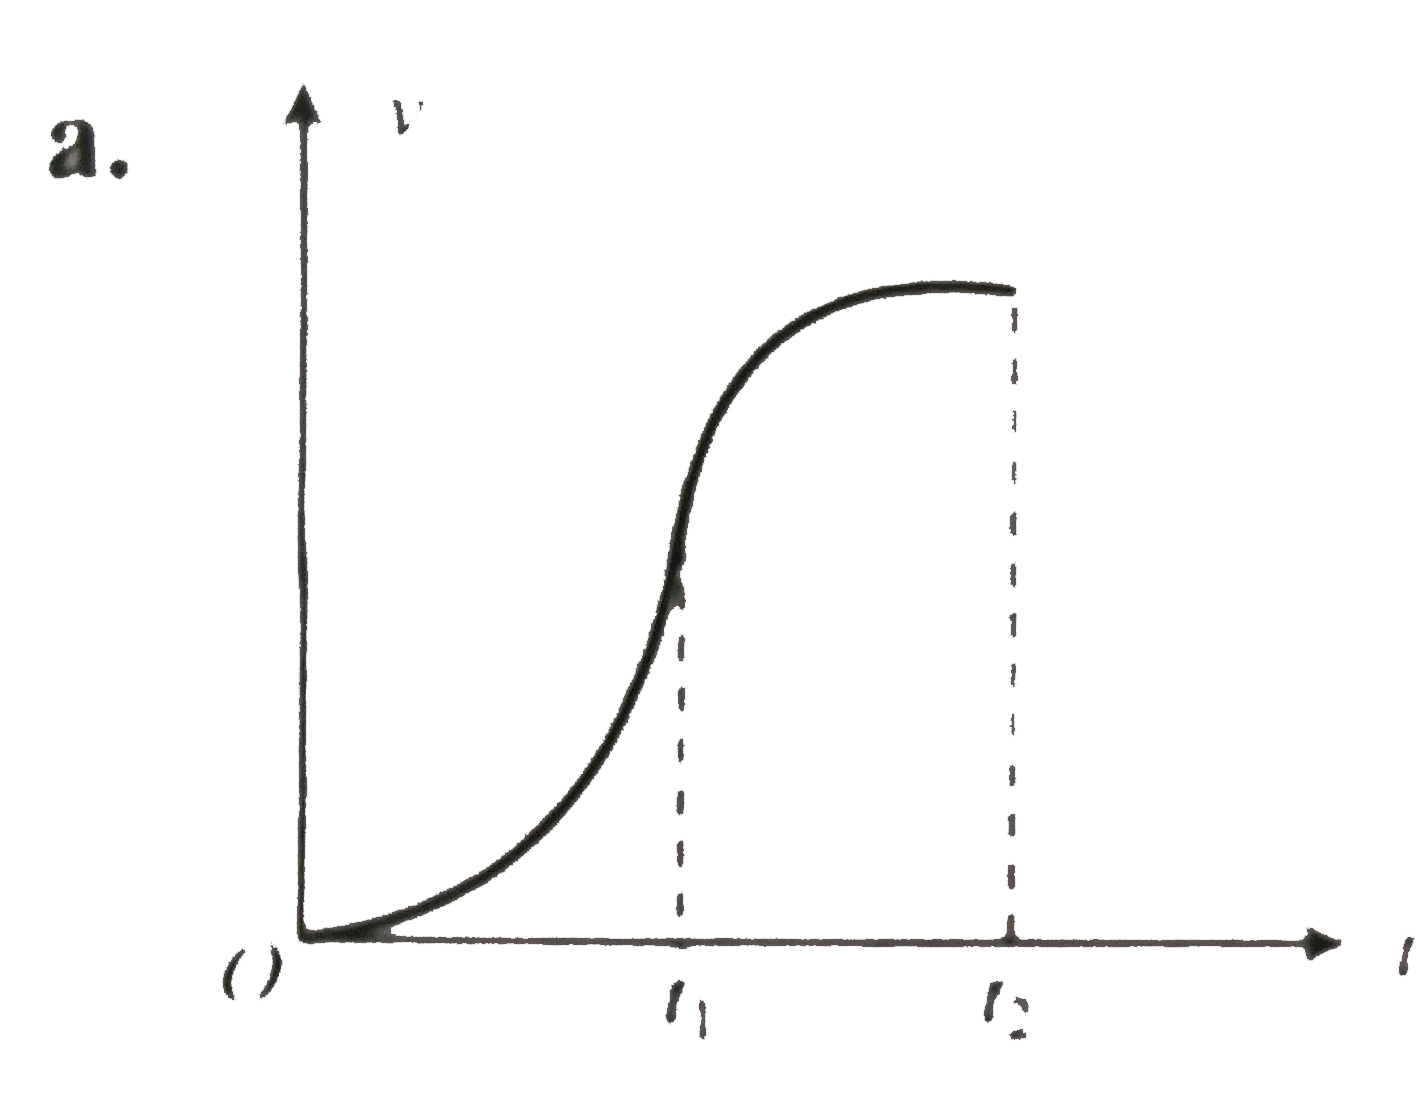 .B
.B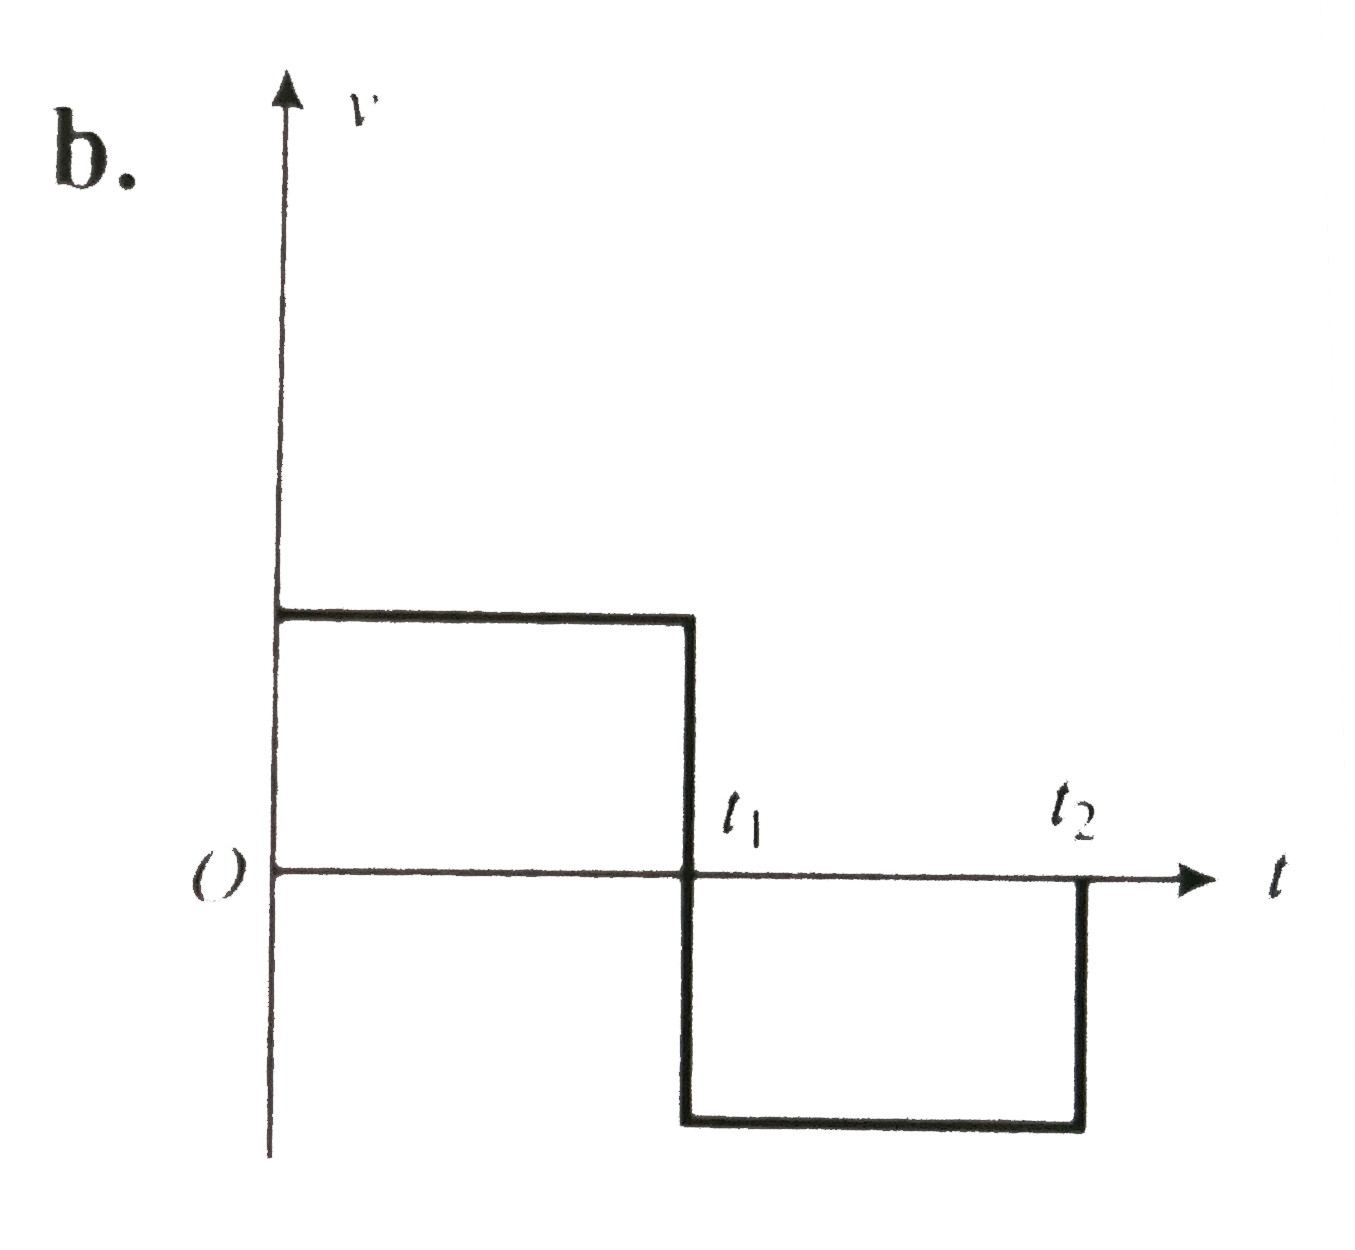 .C
.C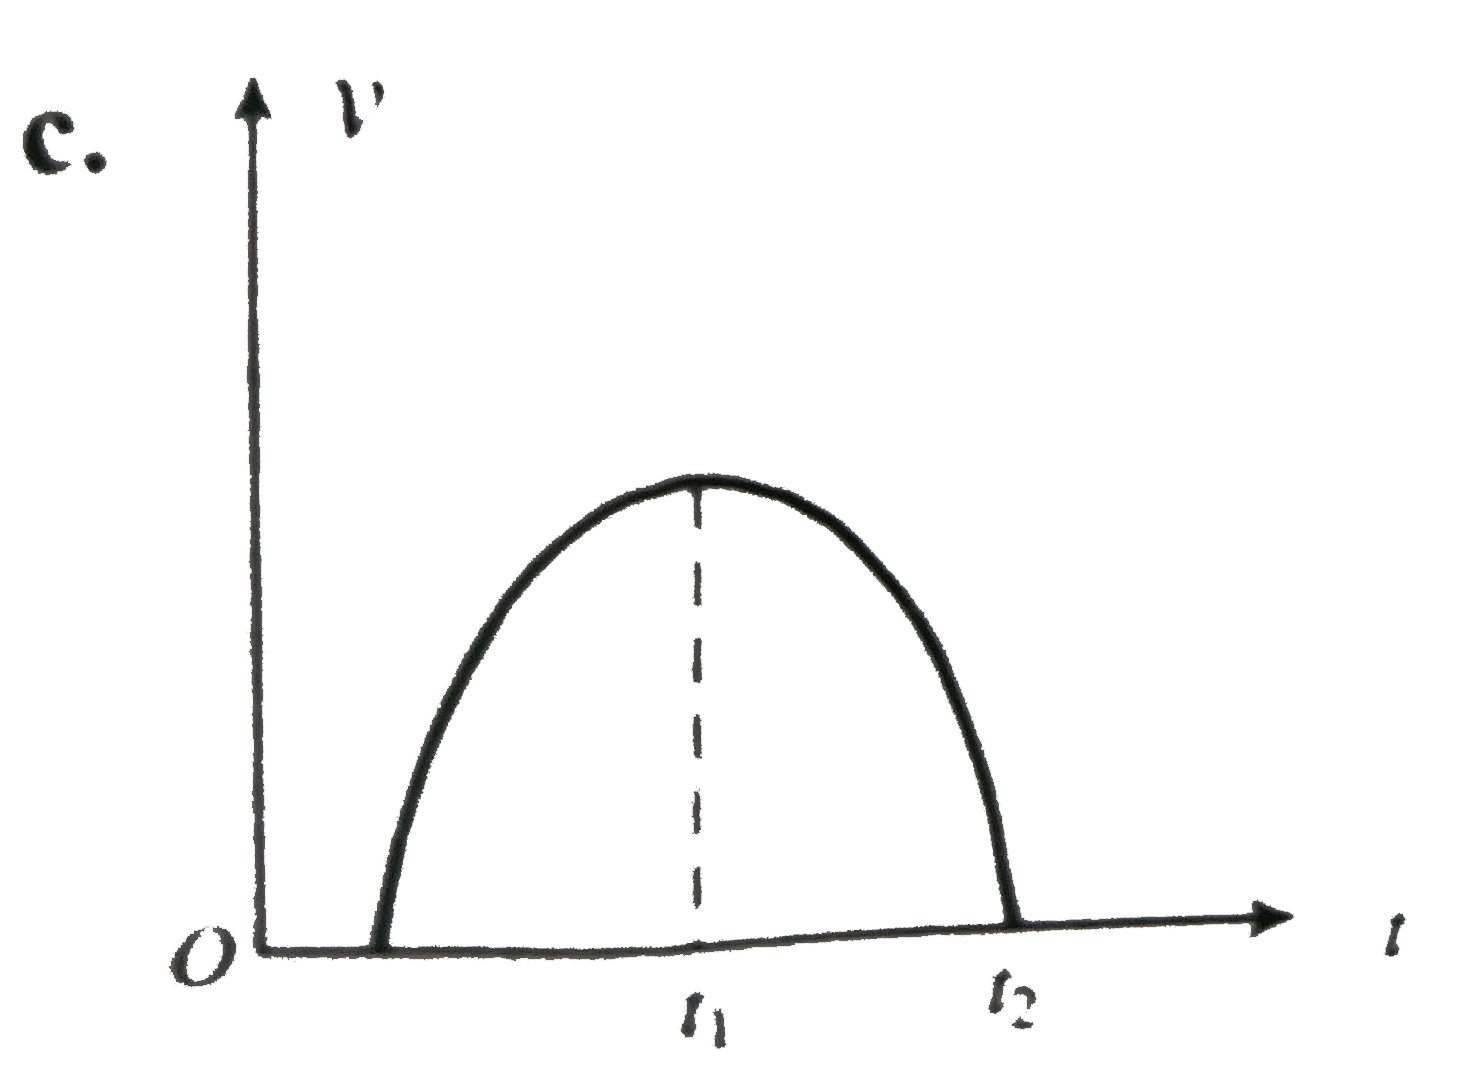 .D
.D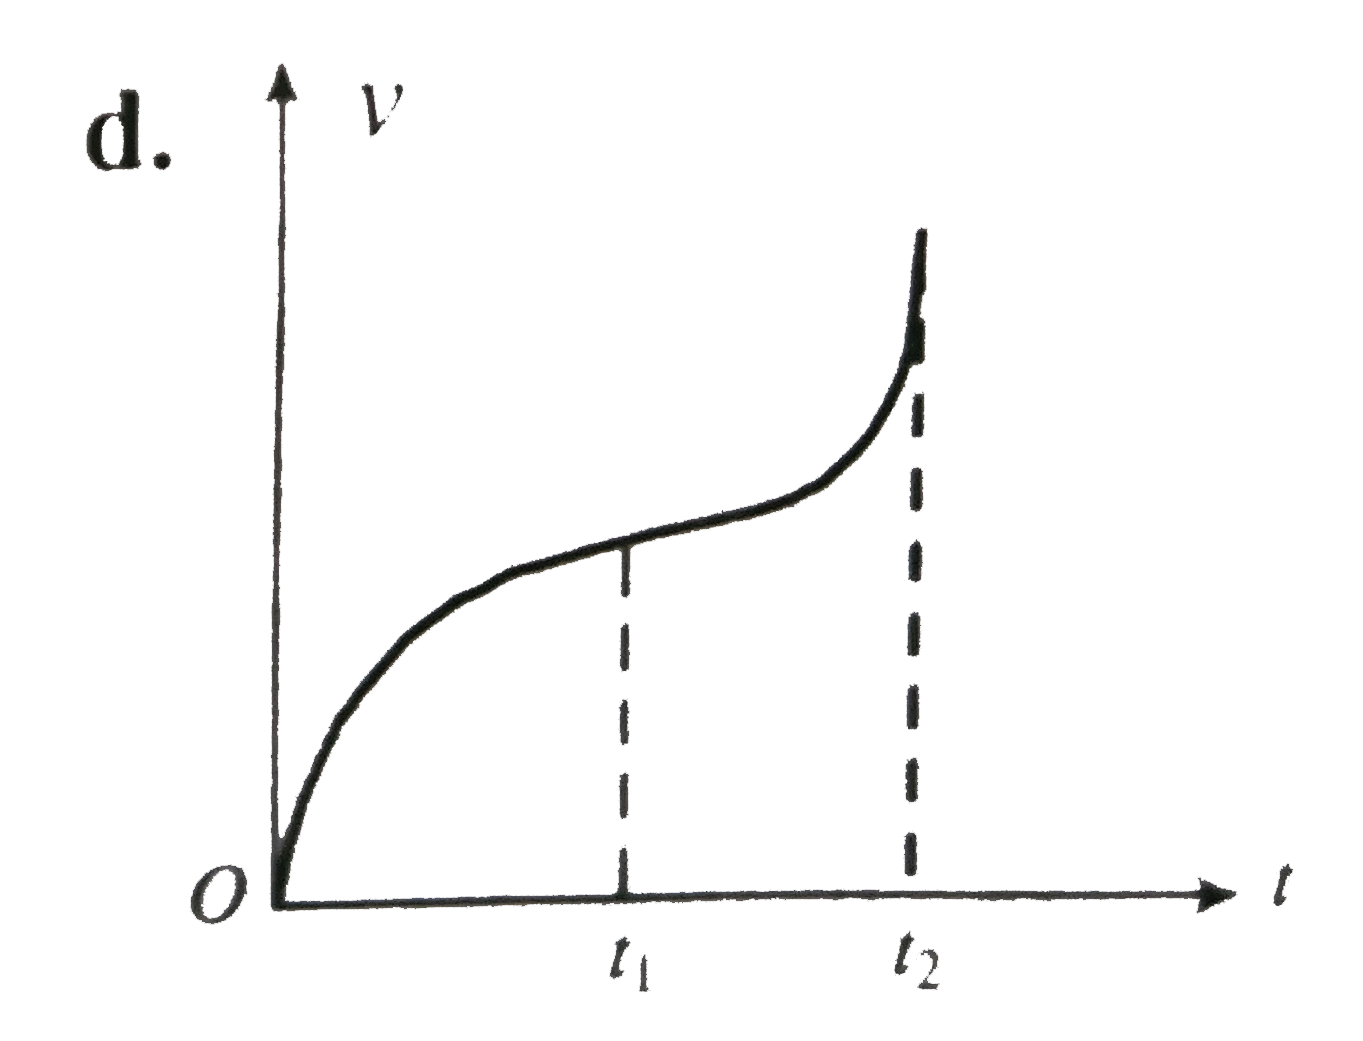 .
.Position time graph of a particle of mass 2 kg is shown in figrure. Total work done on the particle from t=0 to t=4s is
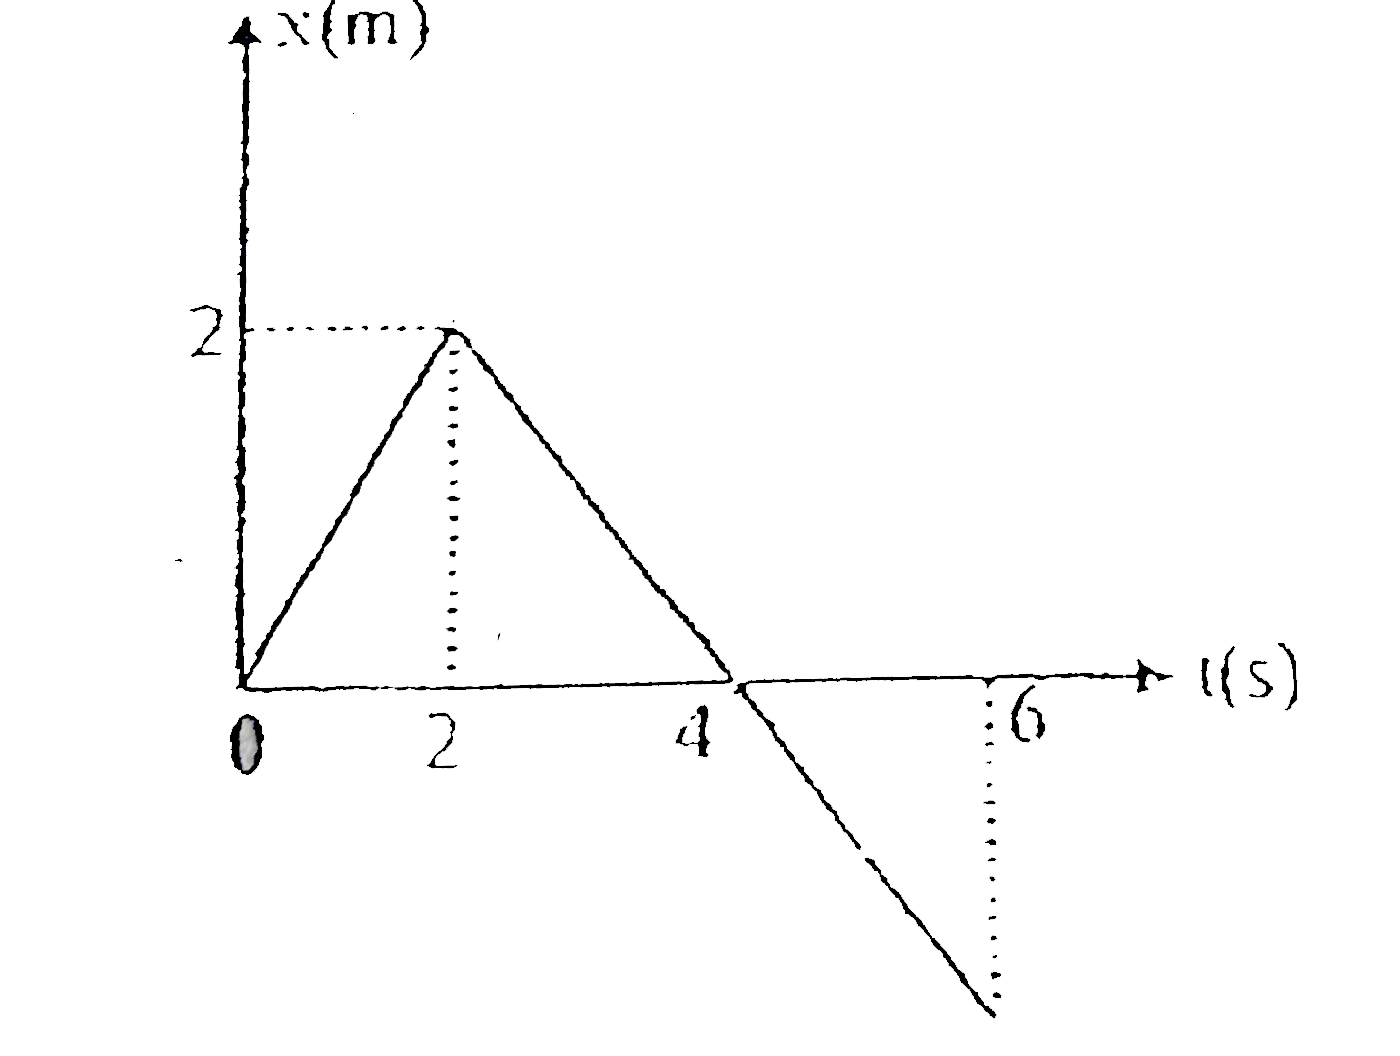 A8 JB4 JC0 JDCan't be determined
Acceleration time graph of a particle moving along a straight line is given. Then average acceleration between t=0 & t=4 is :−
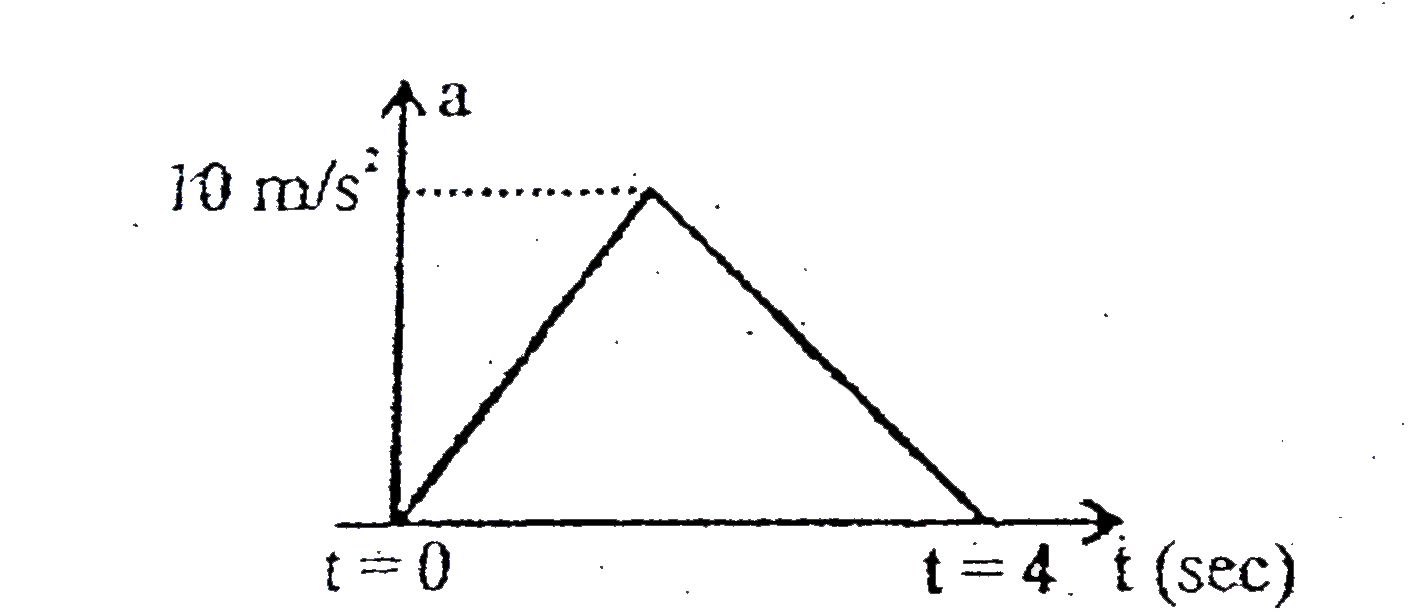 A0m/s2B5m/s2C10m/s2D7.5m/s2
The acceleration time graph of a particle is shown in the Fig. 2 (CF). 11. At time t=10s is the particle is 8ms−1. Its velocity t=10s is.
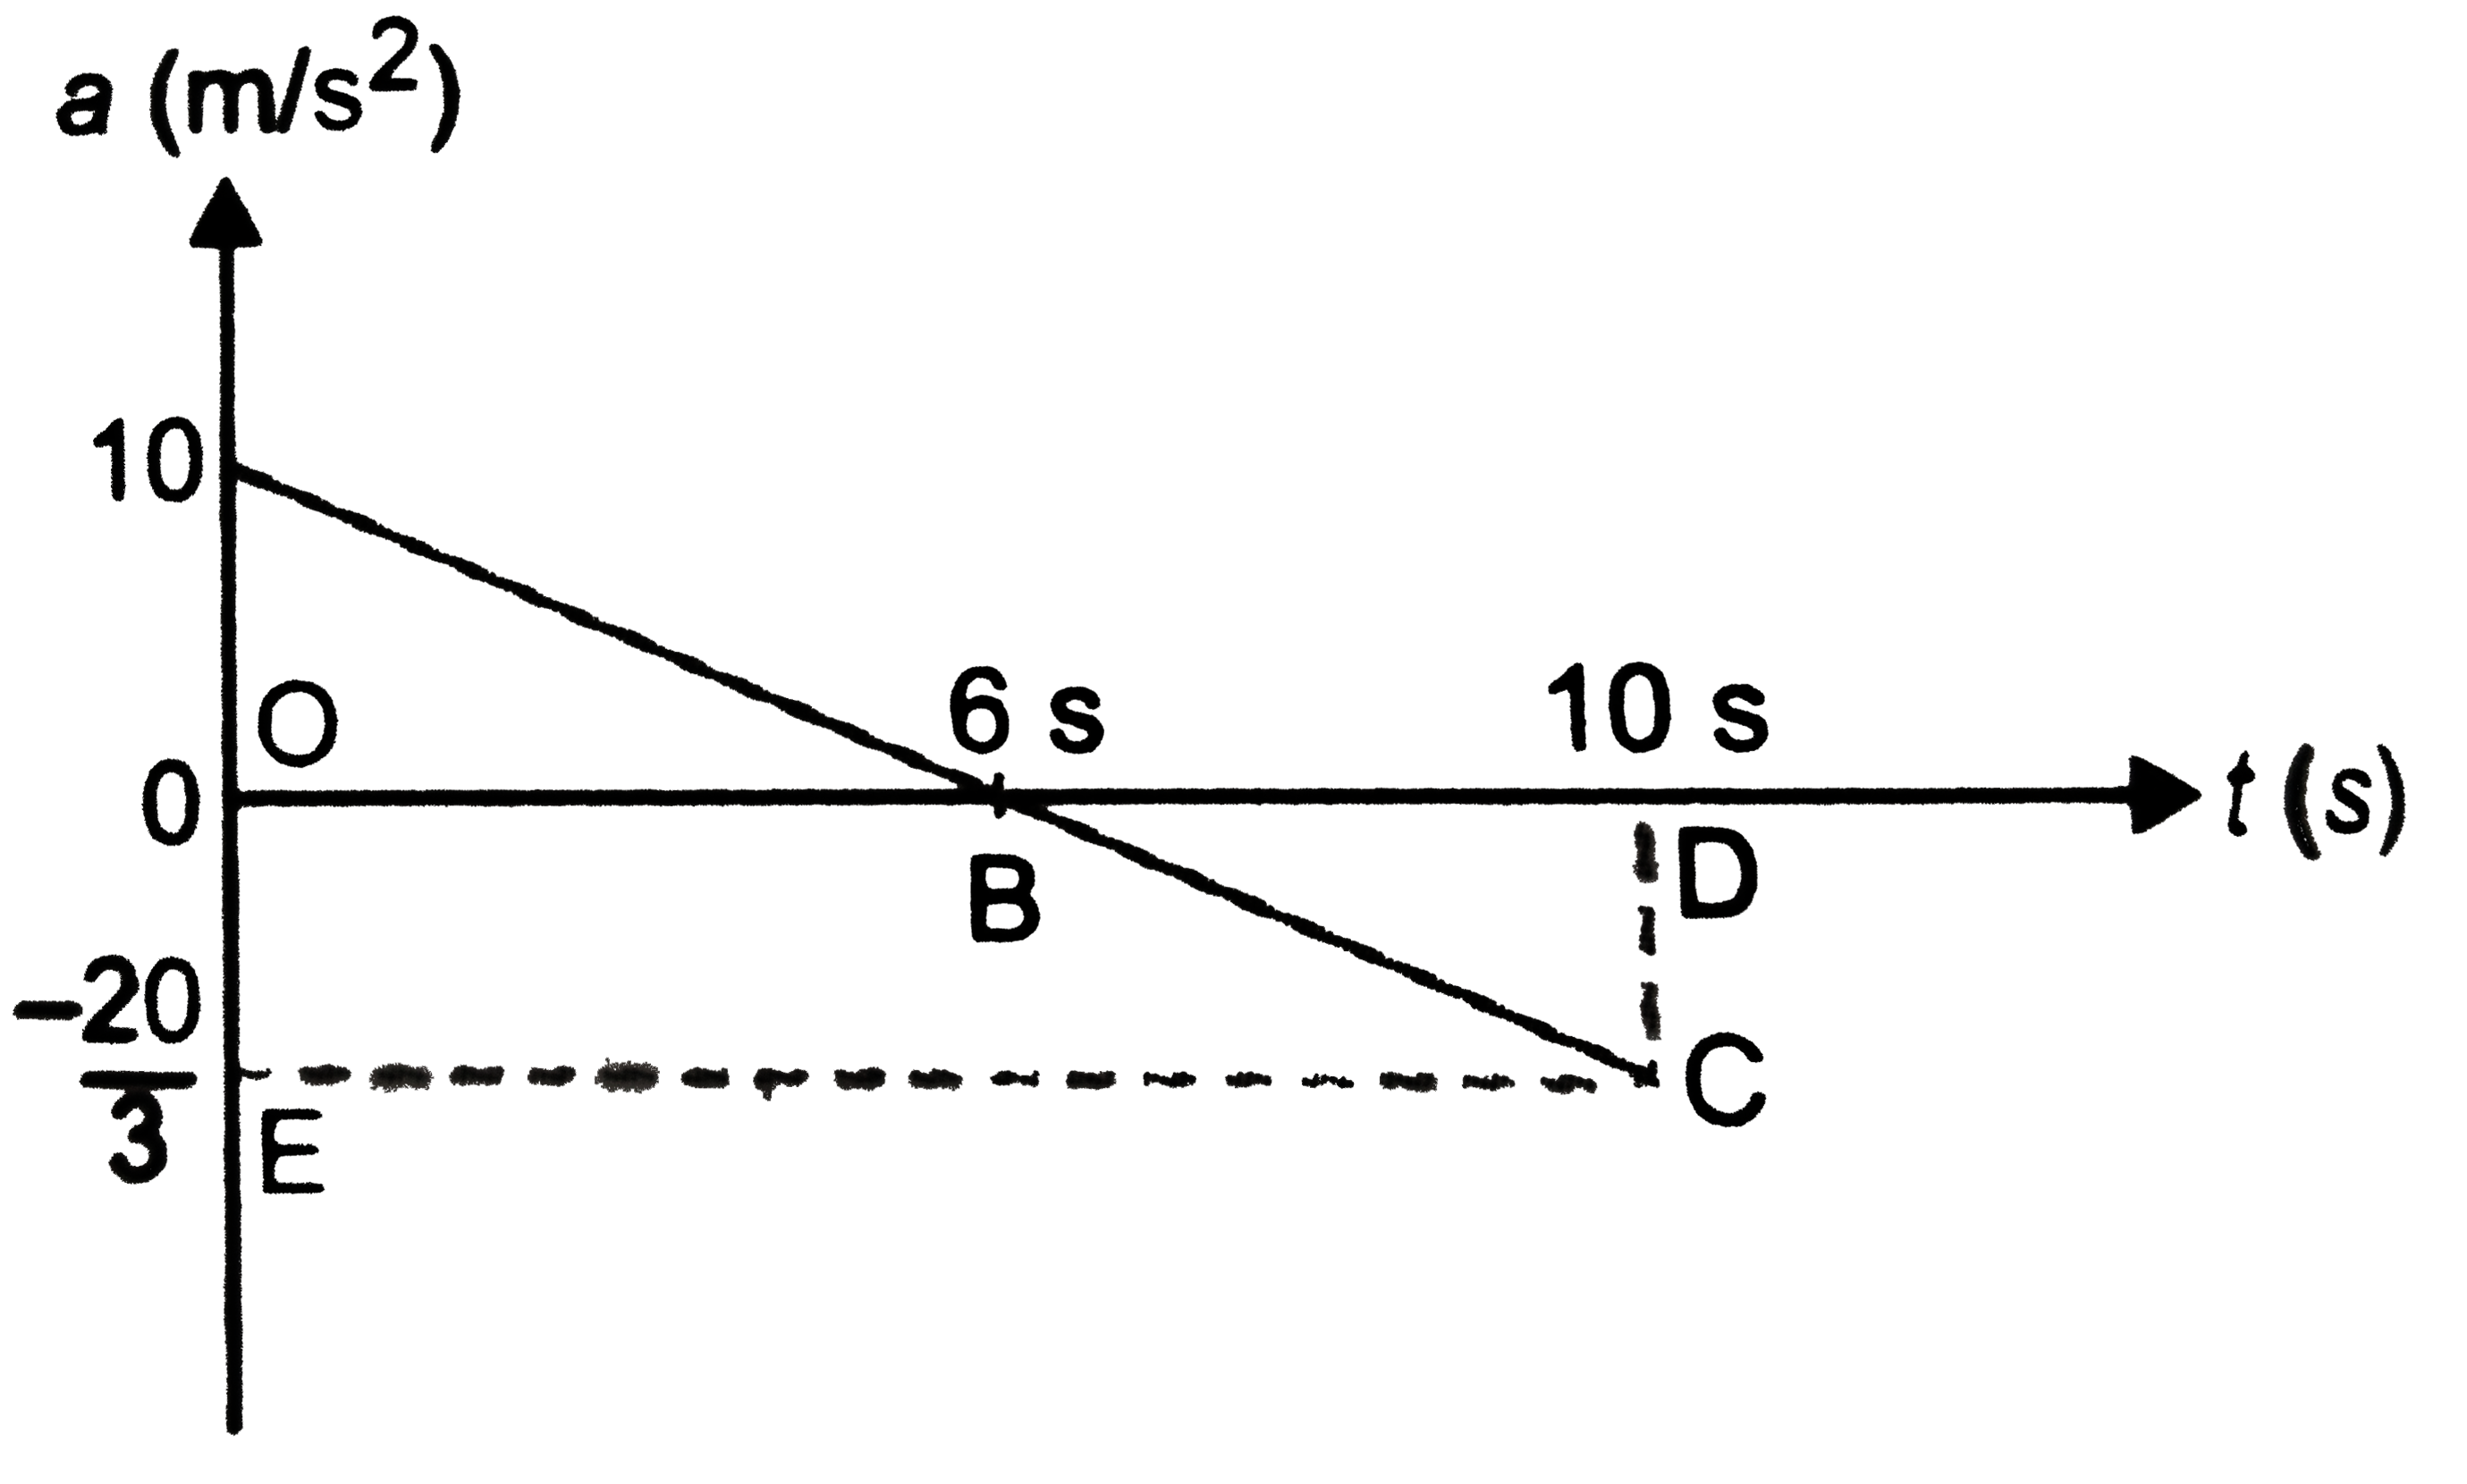 .
.
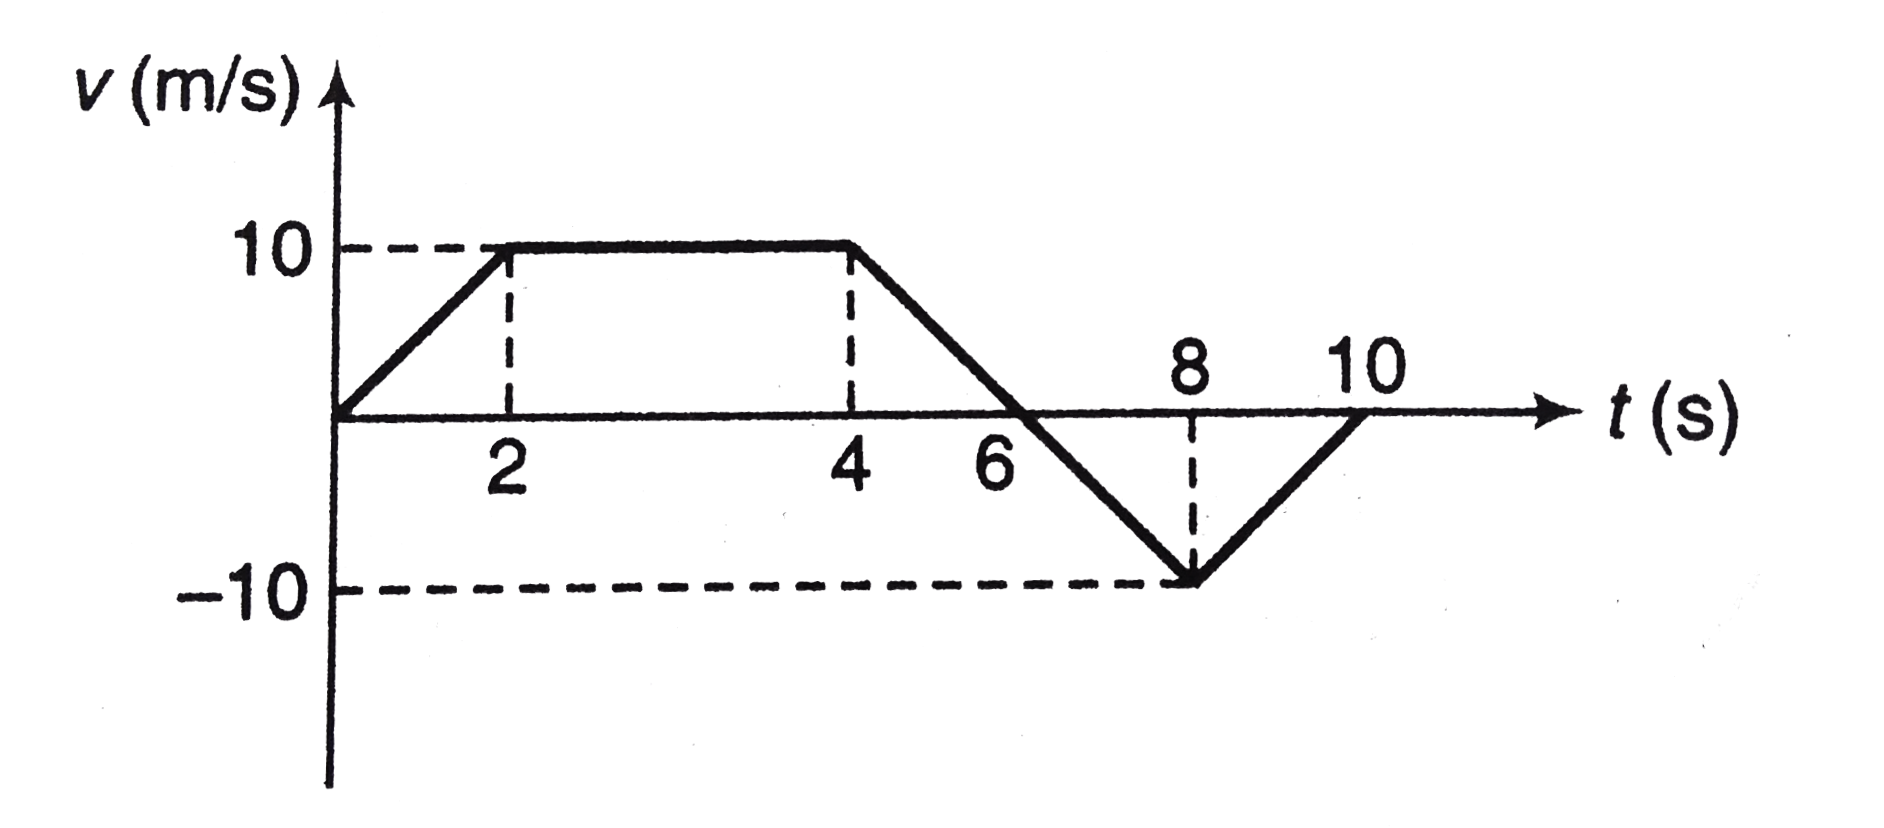
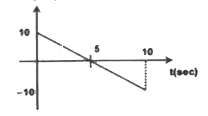
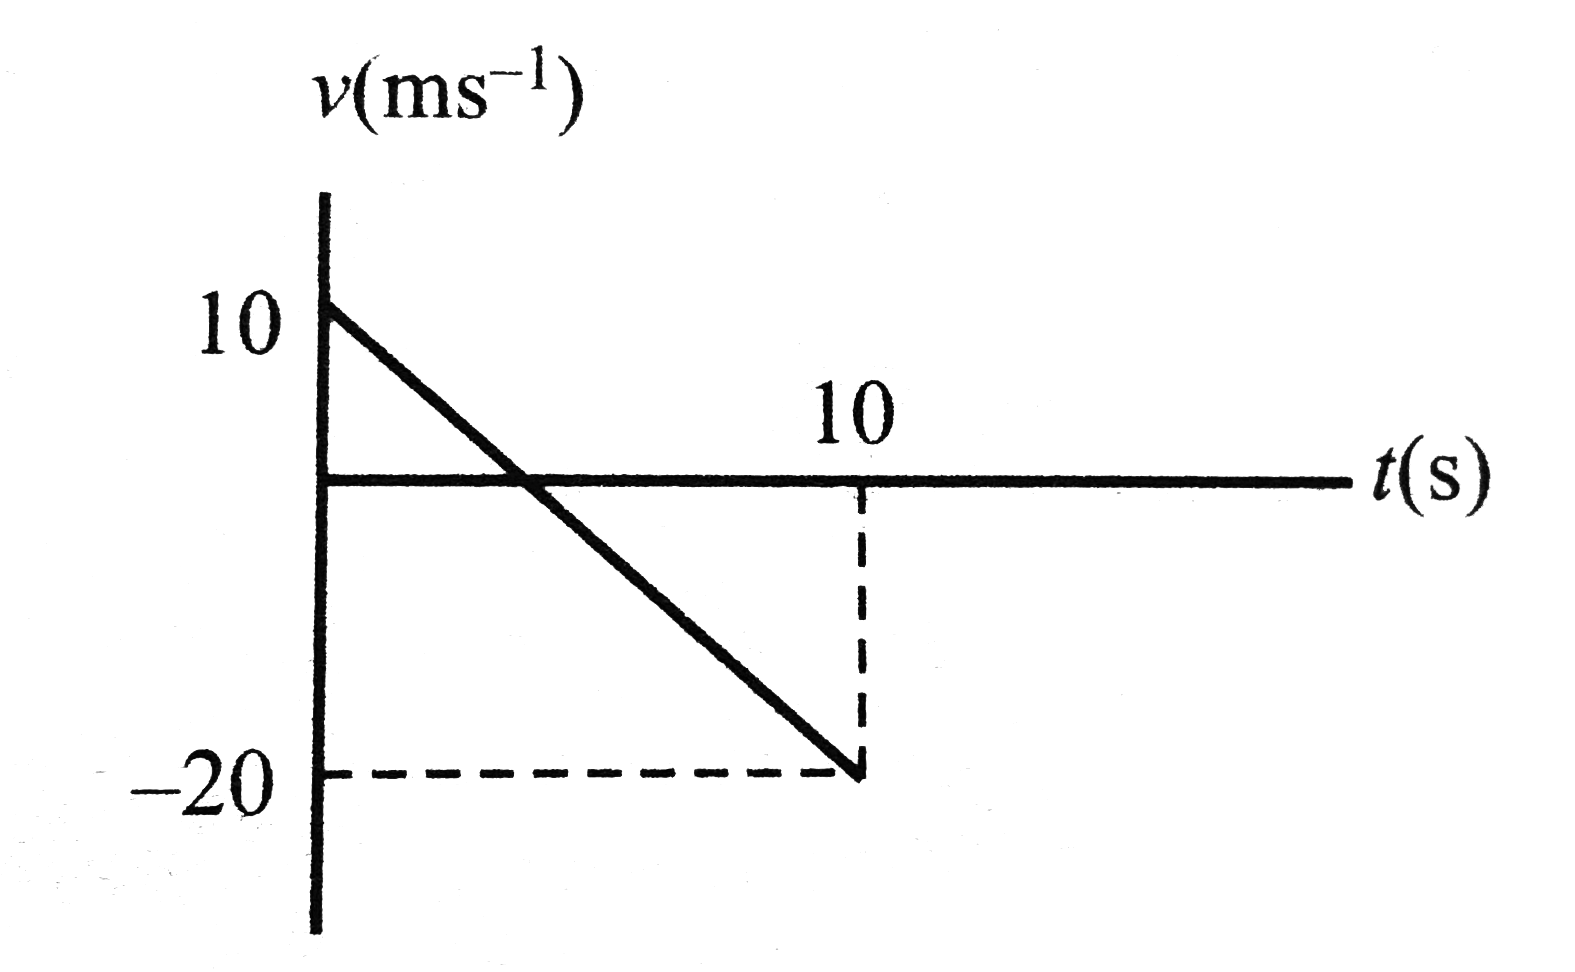
View SolutionVelocity-time graph of a particle moving in a straight line is shown in the figure. Mass of the particle is 2 kg. Work done by all the forces acting on the particle in time interval t = 0 to t = 10 sec is
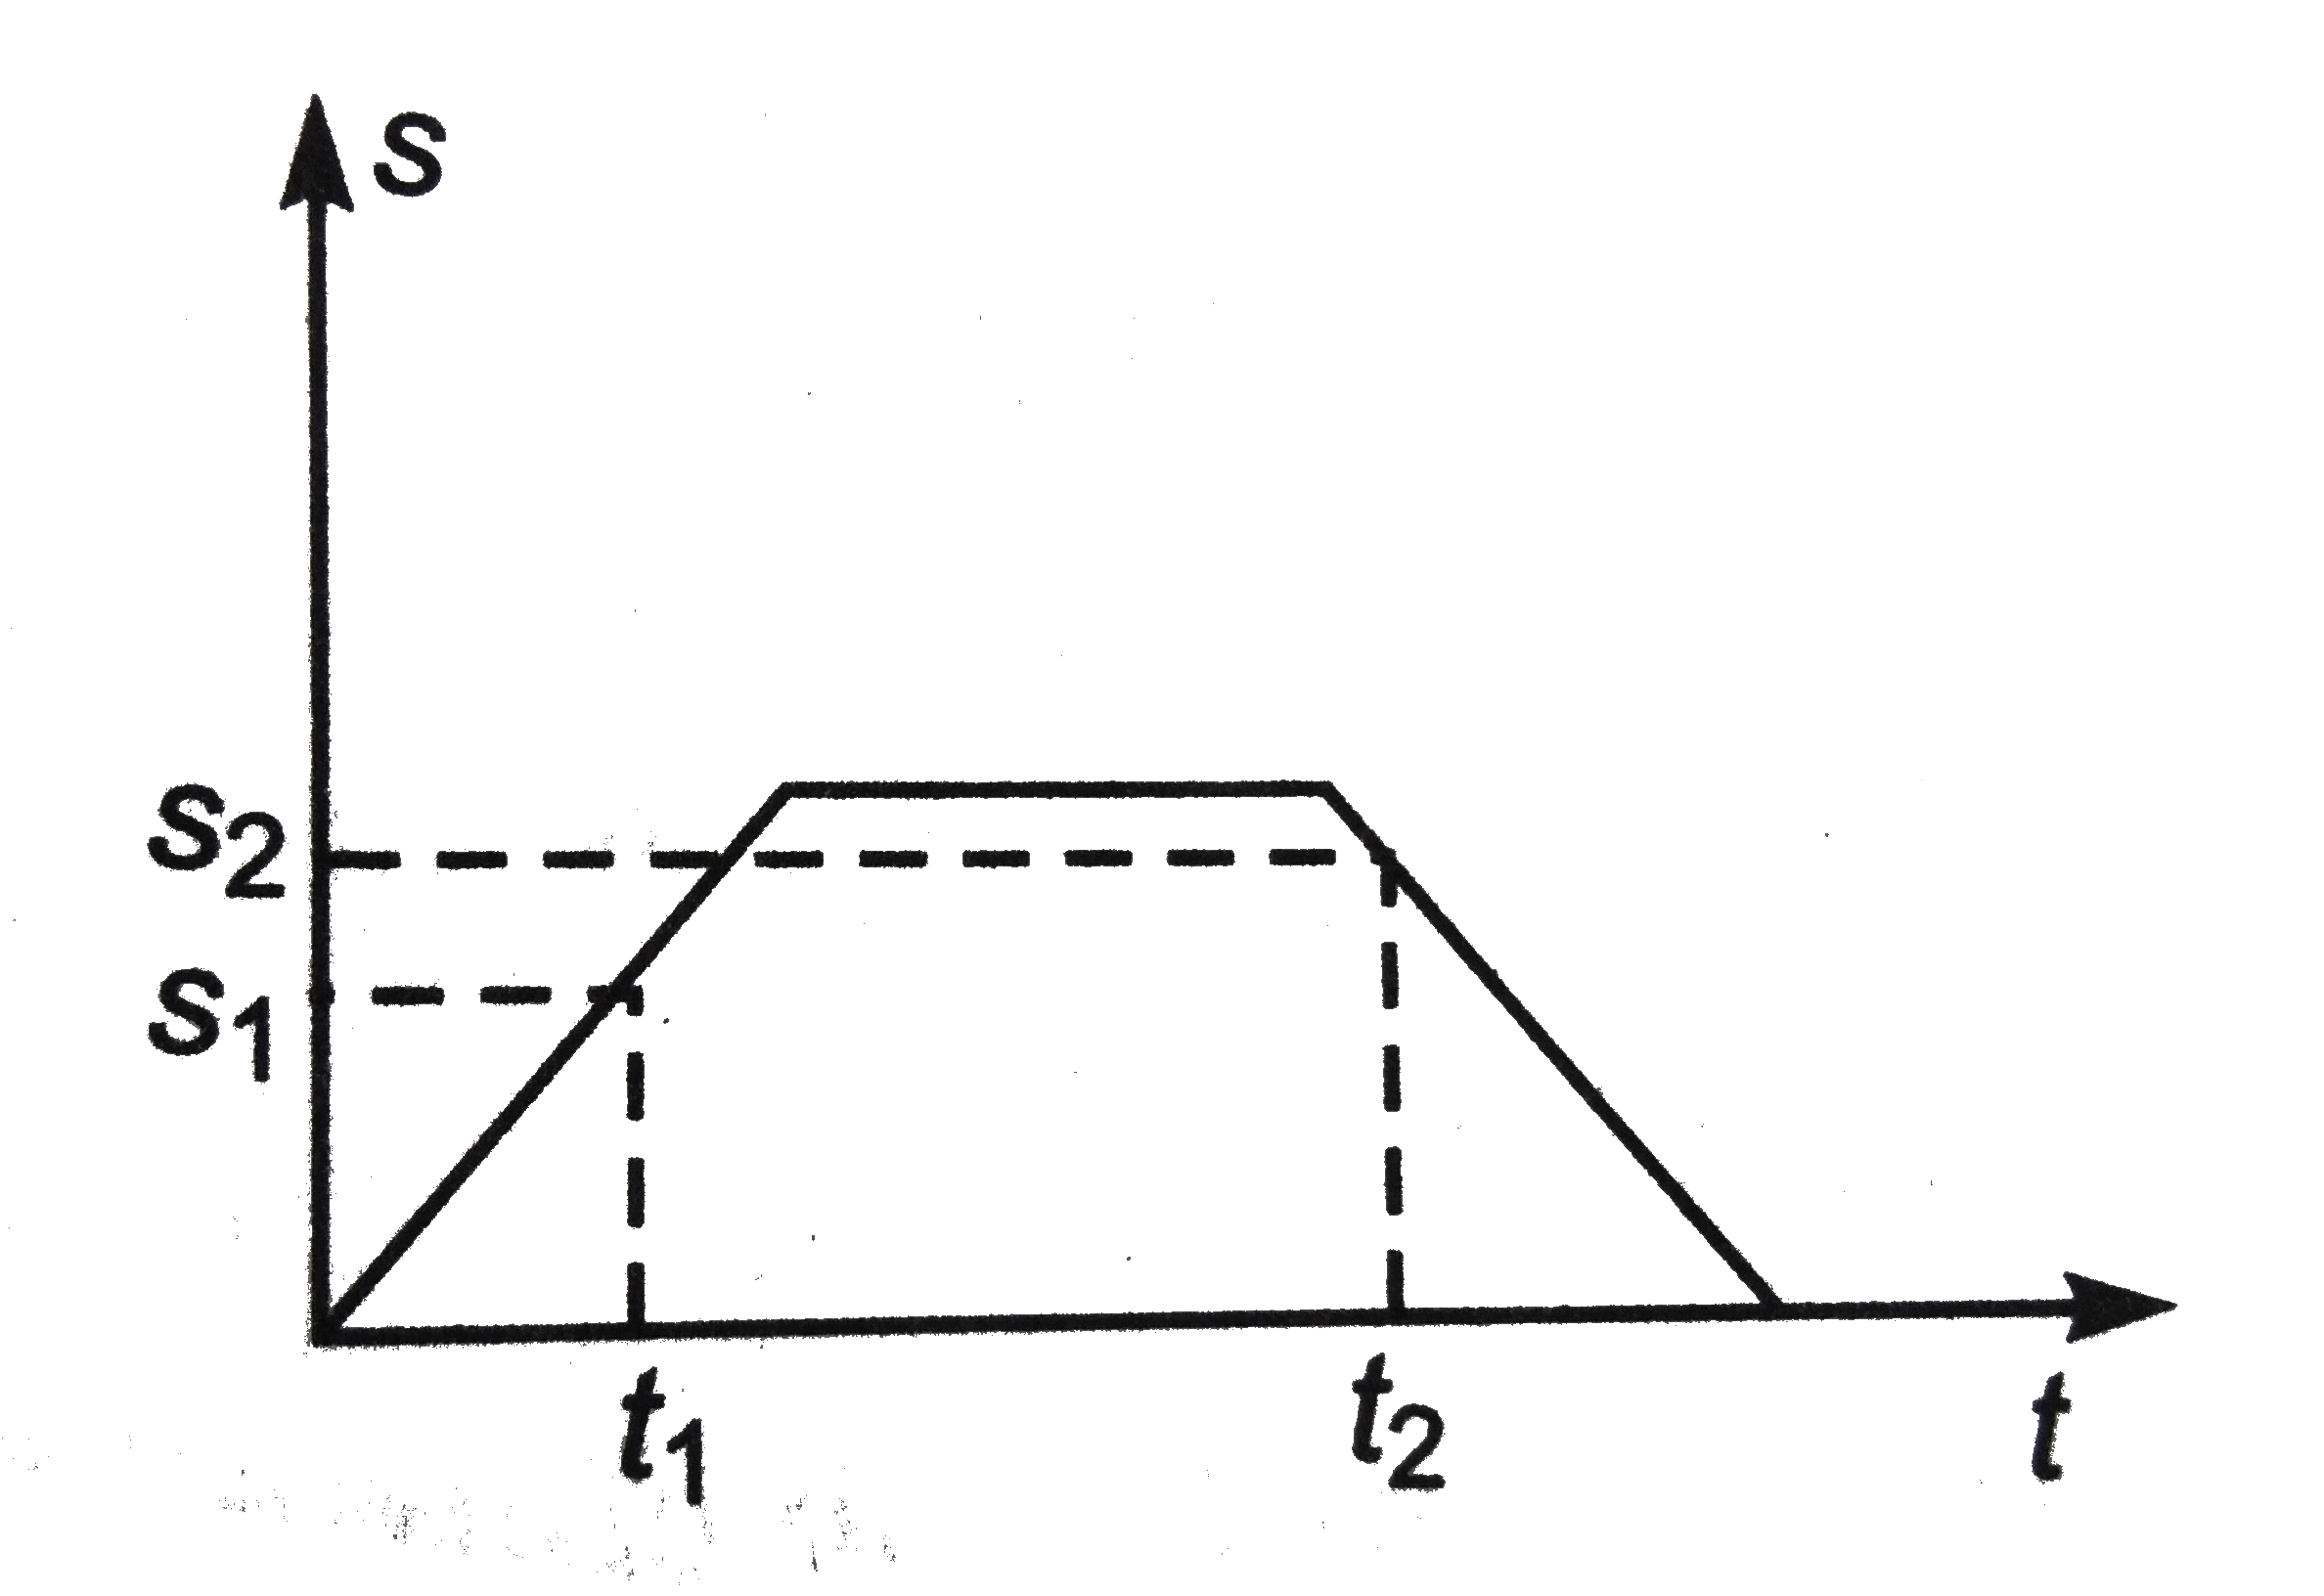
View SolutionAsseration : Displacement time graph of a particle moving in a straight line is shown in figure. Work done by all the forces between time interval t1 and t2 is definitely zero.
 ,
,
Reason : Work done by all the forces is equal to change in kinetic energy.
View SolutionStarting from rest, acceleration of a particle is a=2t(t−1). The velocity of the particle at t=5s is
View SolutionThe velocity-time graph of a particle moving in a straight line is shown in figure. The mass of the particle is 2kg. Work done by all the forces acting on the particle in time interval between t=0 to t=10s is
View Solution
