Density (ρ) versus internal energy (U) graph of a gas is as shown in figure. Choose the correct options.
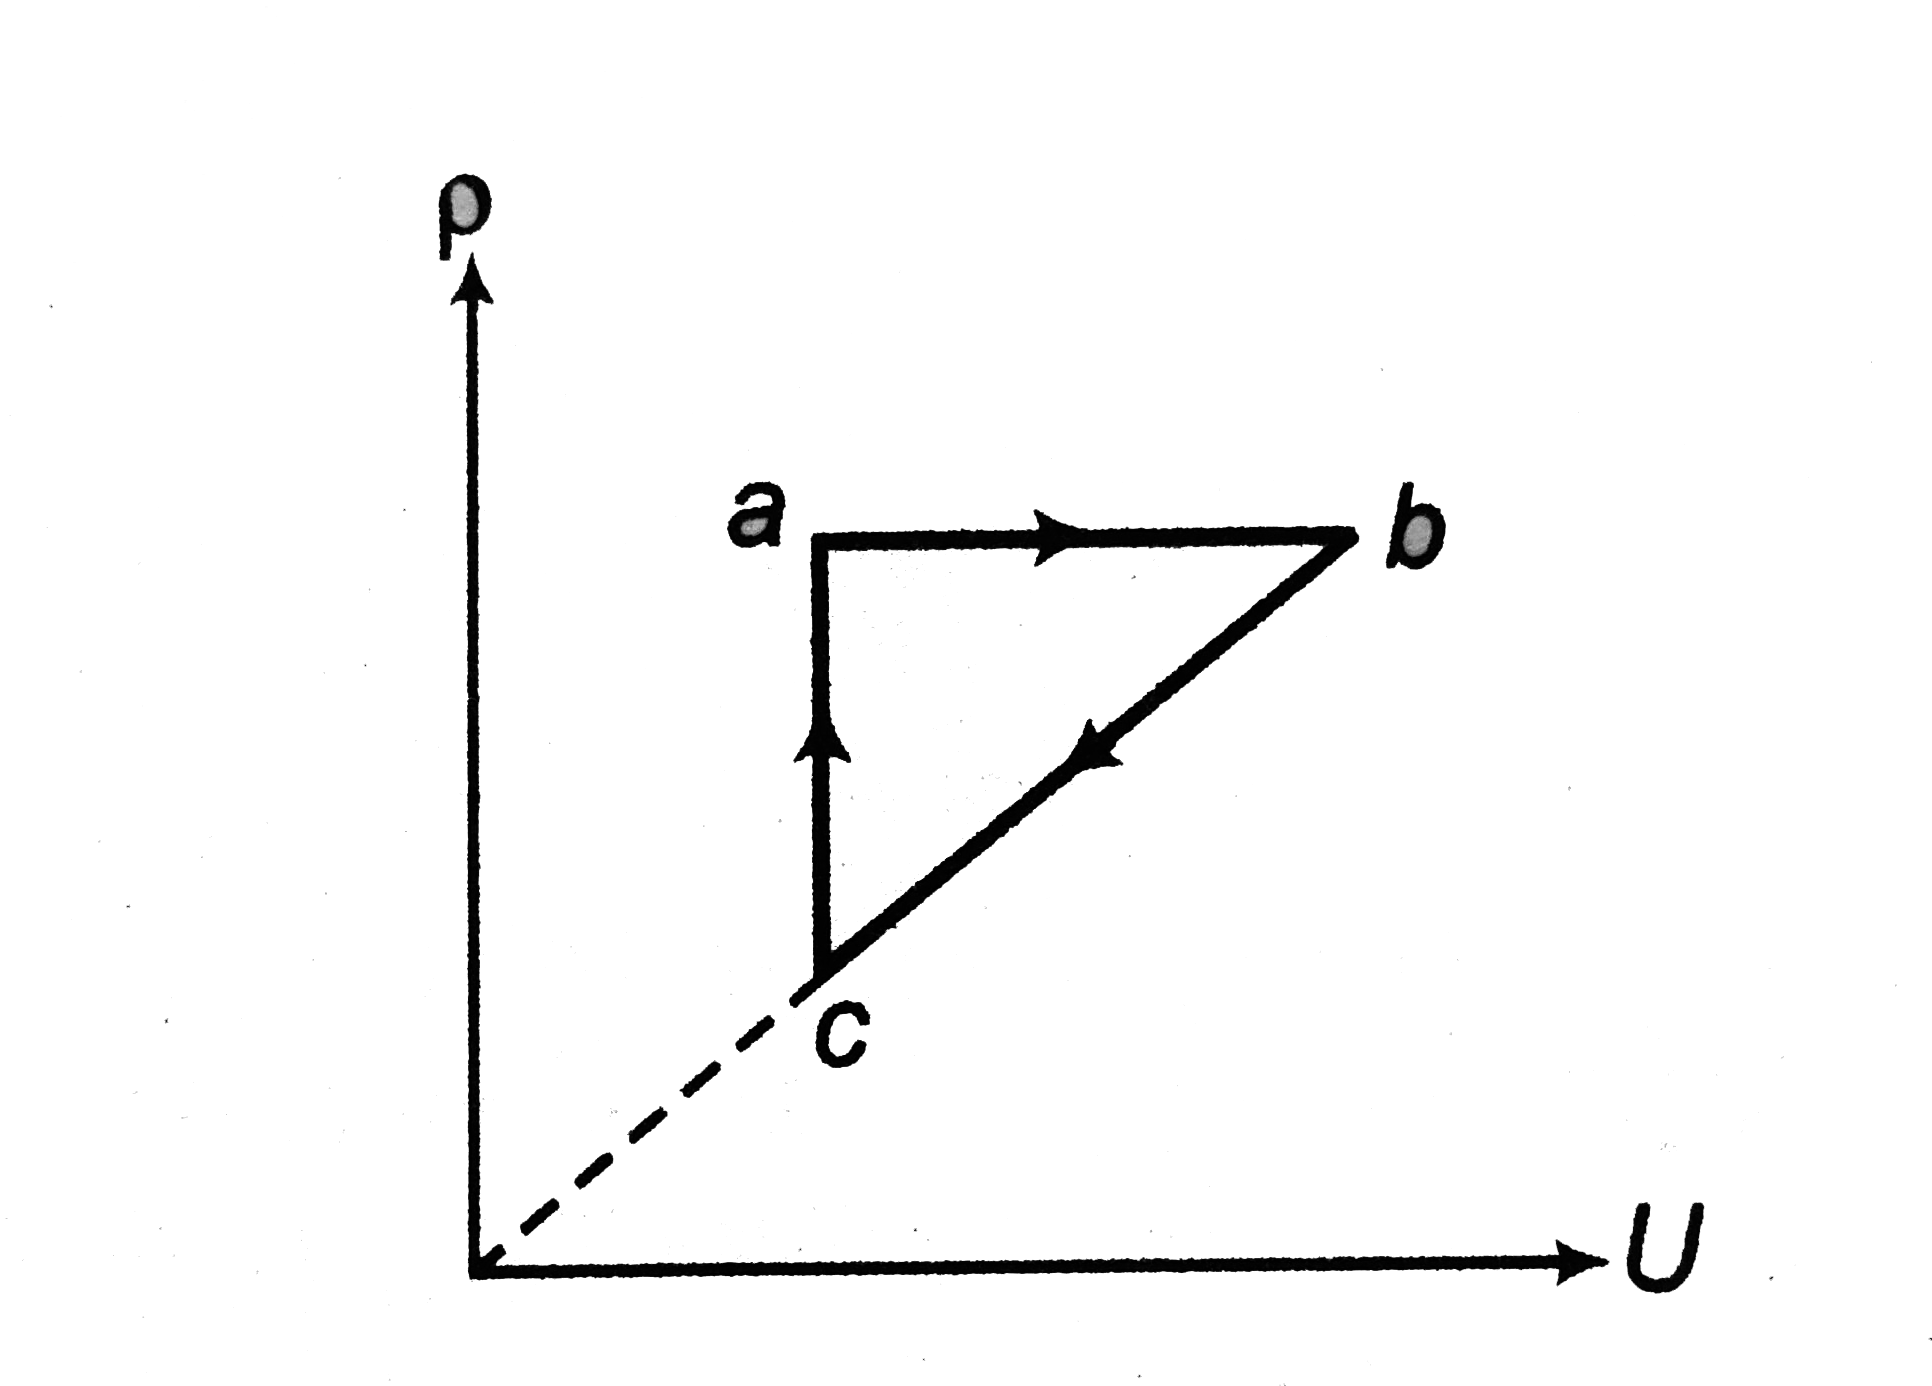
Here, W is work done by gas and Q is heat given to the gas.
(a) Qbc=0
(b) Wbc=0
(c) Wca<0
(d) Qab>0
The correct Answer is:C, D
ab ρ= constant
∴ V=constant
∴ W=0<br>Q=Delta U<br>DeltaUispositive,asUis∈creasing.<br>Hence,Qisalsopositive.<br>bcrho prop Uimplies :. 1/V prop T<br>rhoisdecreasing,soVis∈creasing.Hence,workdo≠ispositive.<br>Further,1/V prop T(TproppV)<br>:.pV^(2)=constant<br>Intheprocess,pV^x=constant,<br>Molarheat∩acityisgivenby<br>C=C_V+(R)/(1-x)<br>Here,x=2<br>:.C=C_V-R<br>Foranyofthegas,C_V!=R.<br>:.C!=0<br>:.Q=nCDeltaT!=0asDeltaU!=0andDeltaT!=0<br>ca<br>rho is increasing. Hence, V is decreasing. So, work done is negative.
Topper's Solved these Questions
- BOOK - DC PANDEYCHAPTER - LAWS OF THERMODYNAMICSEXERCISE - Level 2 Passage I2videos
LAWS OF THERMODYNAMICS
- BOOK - DC PANDEYCHAPTER - LAWS OF THERMODYNAMICSEXERCISE - Level 2 Passage II3videos
LAWS OF THERMODYNAMICS
- BOOK - DC PANDEYCHAPTER - LAWS OF THERMODYNAMICSEXERCISE - Level 2 Single Correct27videos
LAWS OF THERMODYNAMICS
- BOOK - DC PANDEYCHAPTER - LAWS OF MOTIONEXERCISE - Medical entrances gallery39videos
LAWS OF MOTION
- BOOK - DC PANDEYCHAPTER - MAGNETIC EFFECT OF CURRENT AND MAGNETISMEXERCISE - Integer type Questions10videos
MAGNETIC EFFECT OF CURRENT AND MAGNETISM
Similar Questions
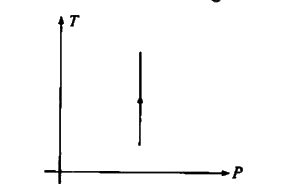
Pressure versus temperature graph of an ideal gas are as shown in figure-2.39. Choose the wrong statement
 View Solution
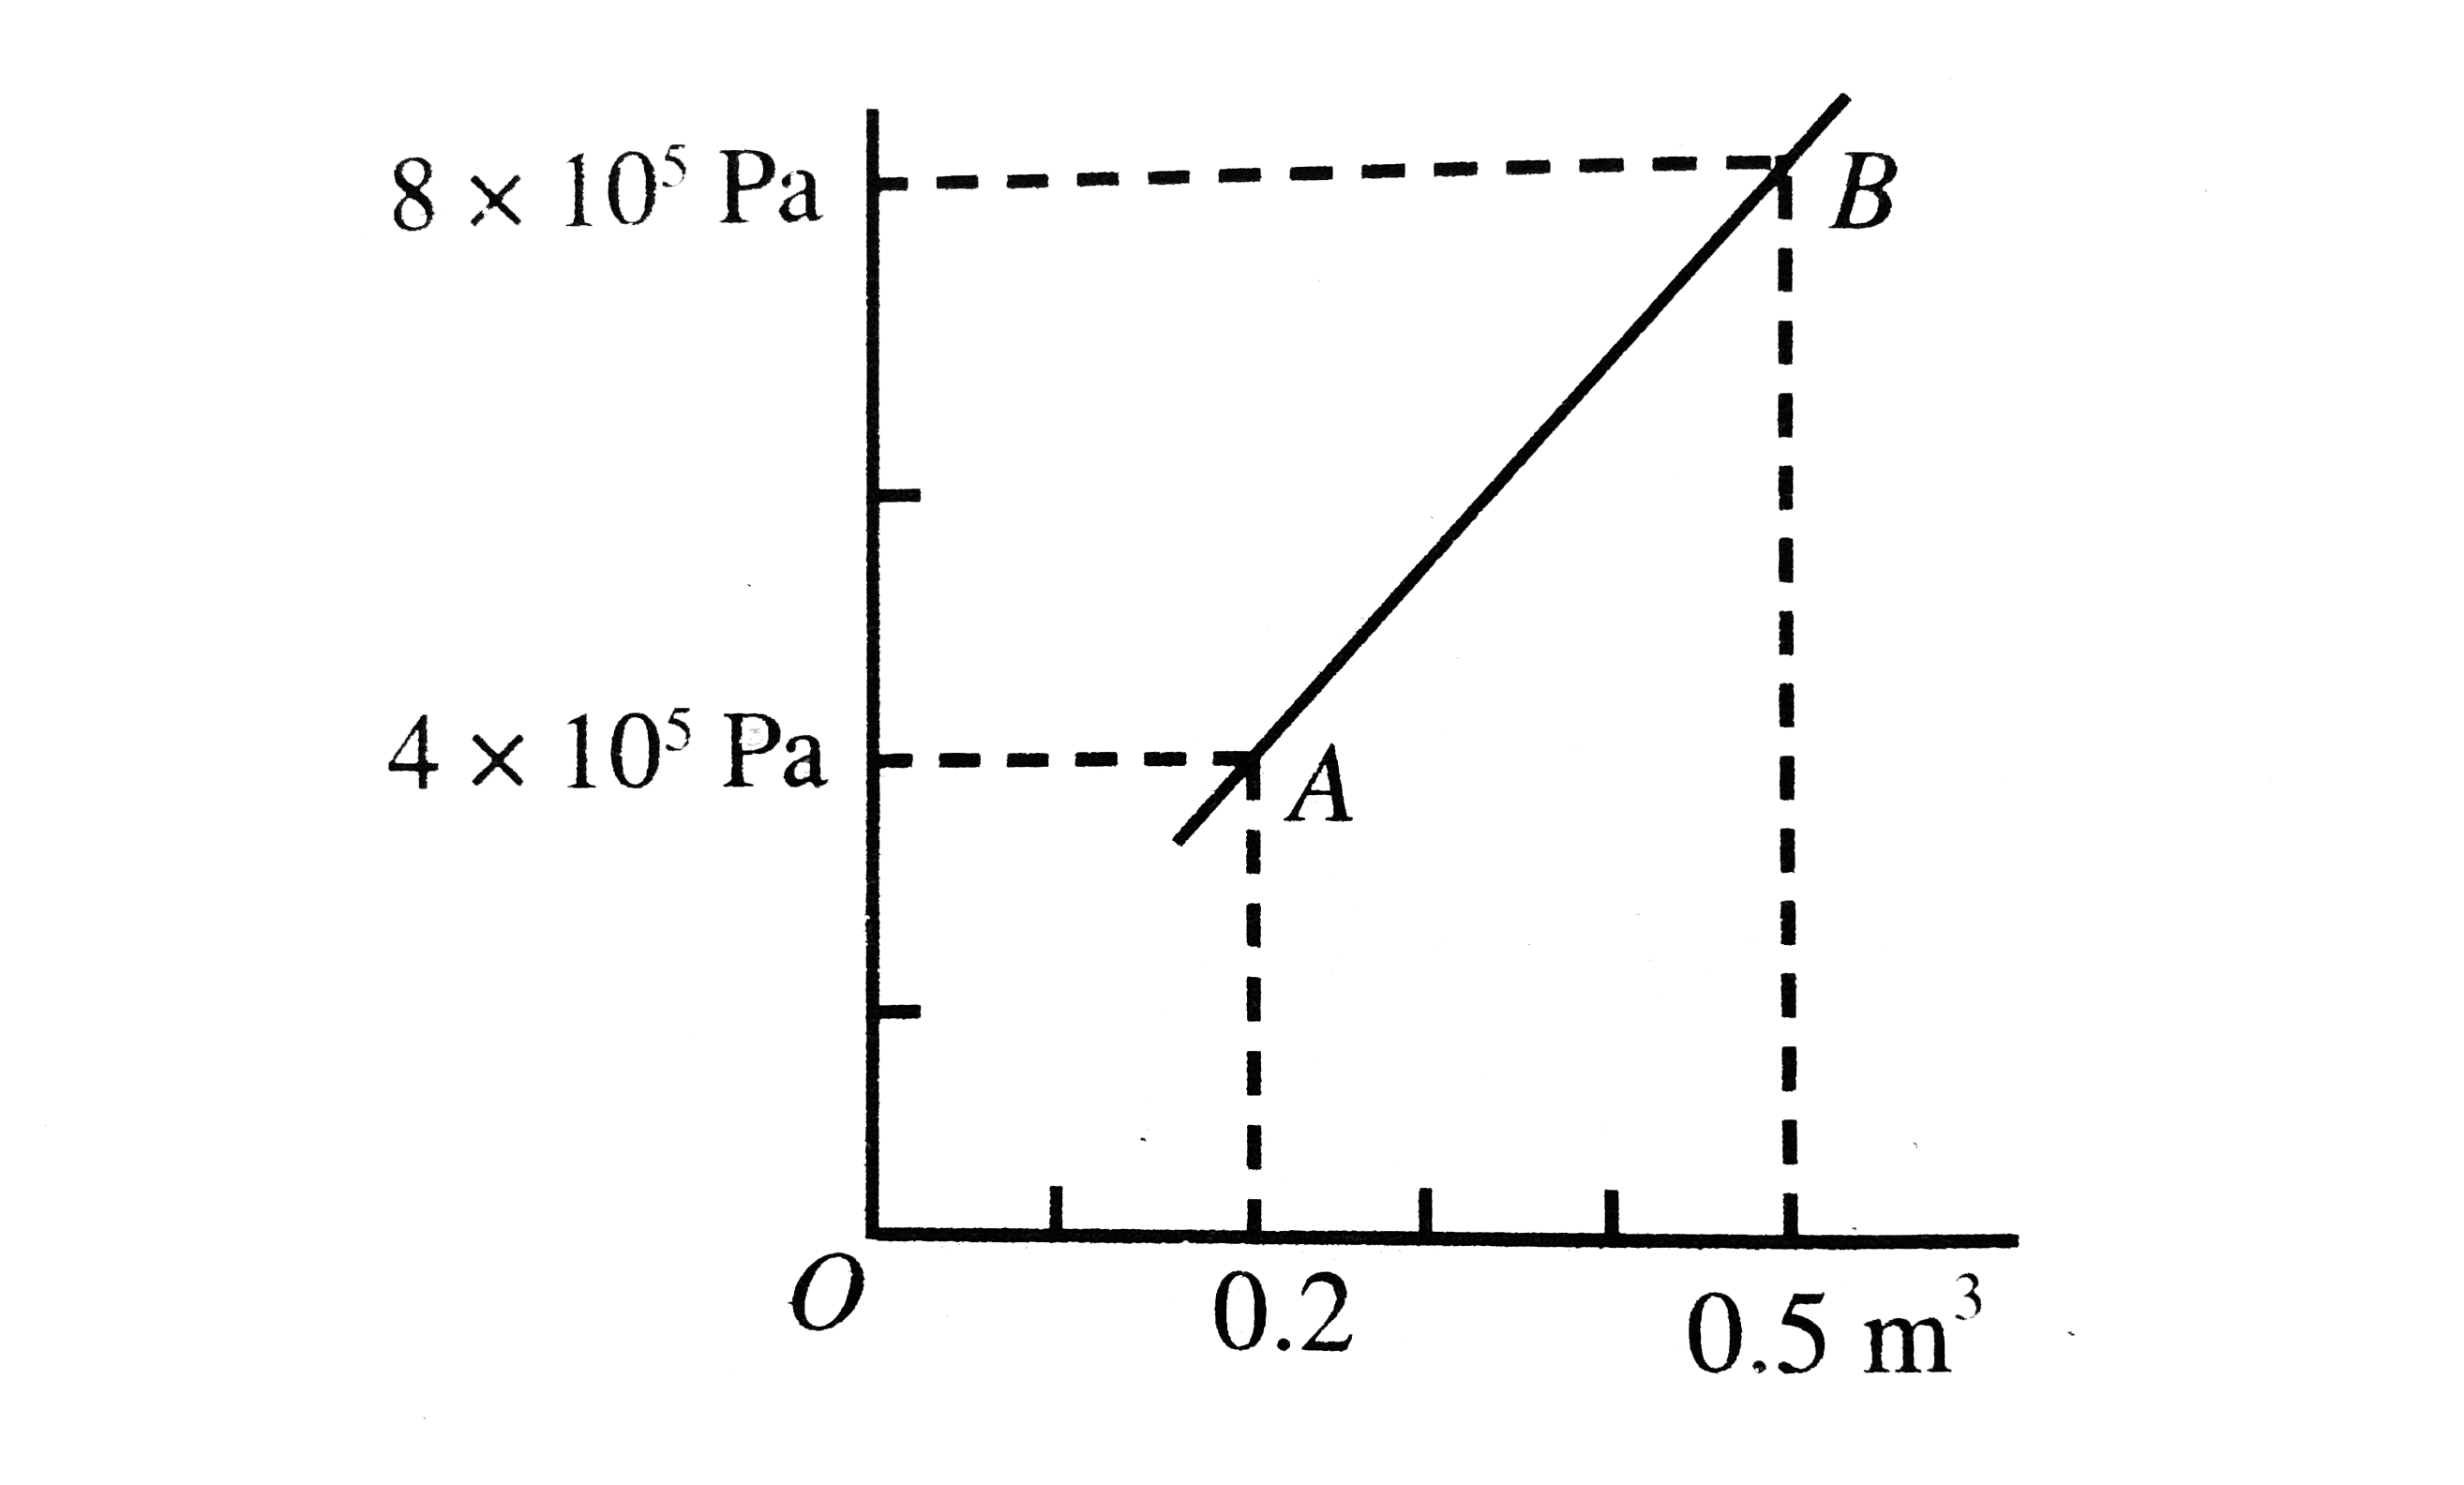
The volume of a monatomic ideal gas increases linearly with pressure, as shown in Fig. Calculate (a) increase in internal energy, (b) work done by the gas and (c ) heat supplied to the gas.
 View Solution
Knowledge Check
- Question 1 - Select One
Pressure versus density graph of an ideal gas is shown in figure
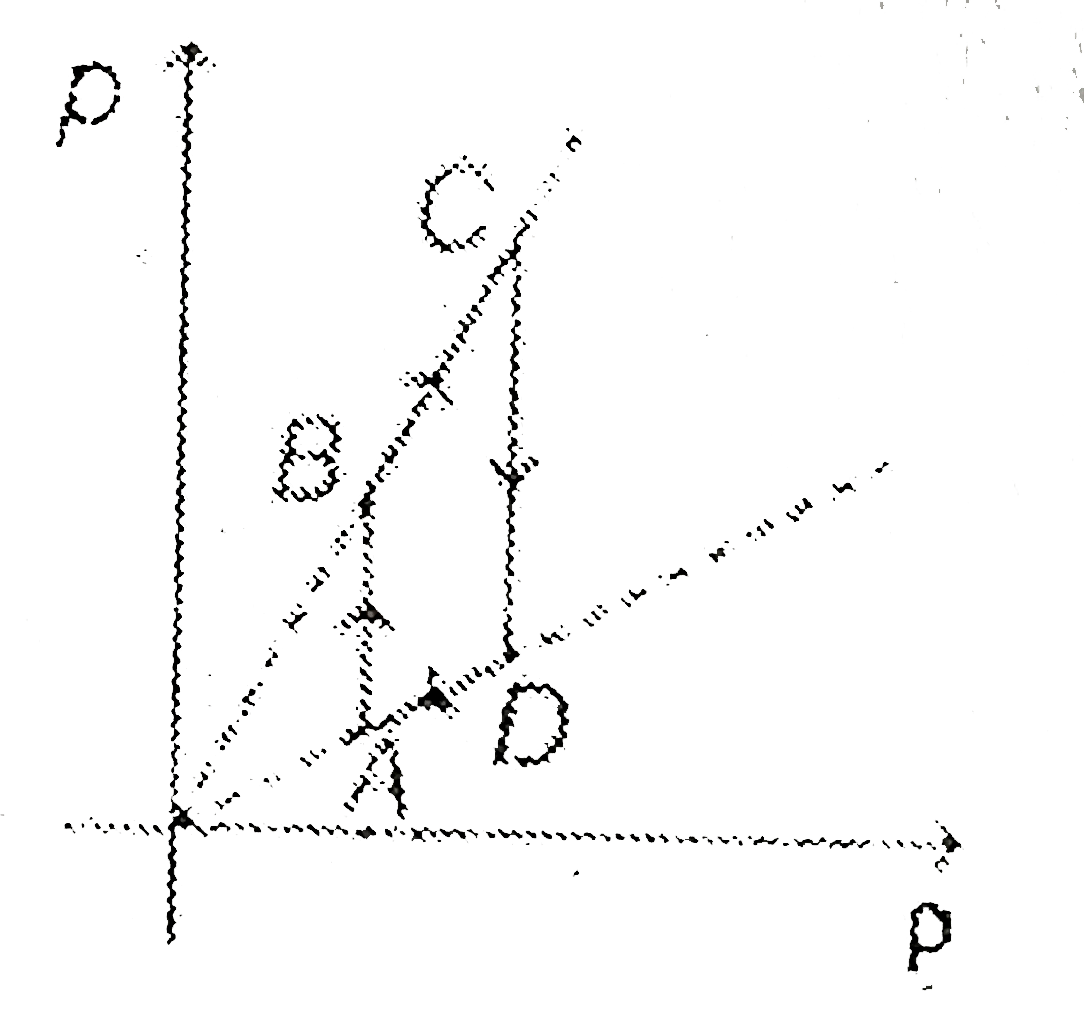 Aduring the process AB work done by the gas is positiveBduring the process AB work done by the gas is negativeCduring the process BC internal energy of the gas is increasingDNone of the above
 - Question 2 - Select One
Pressure versus temperature graphs of an ideal gas are as shown in figure. Choose the wrong statement
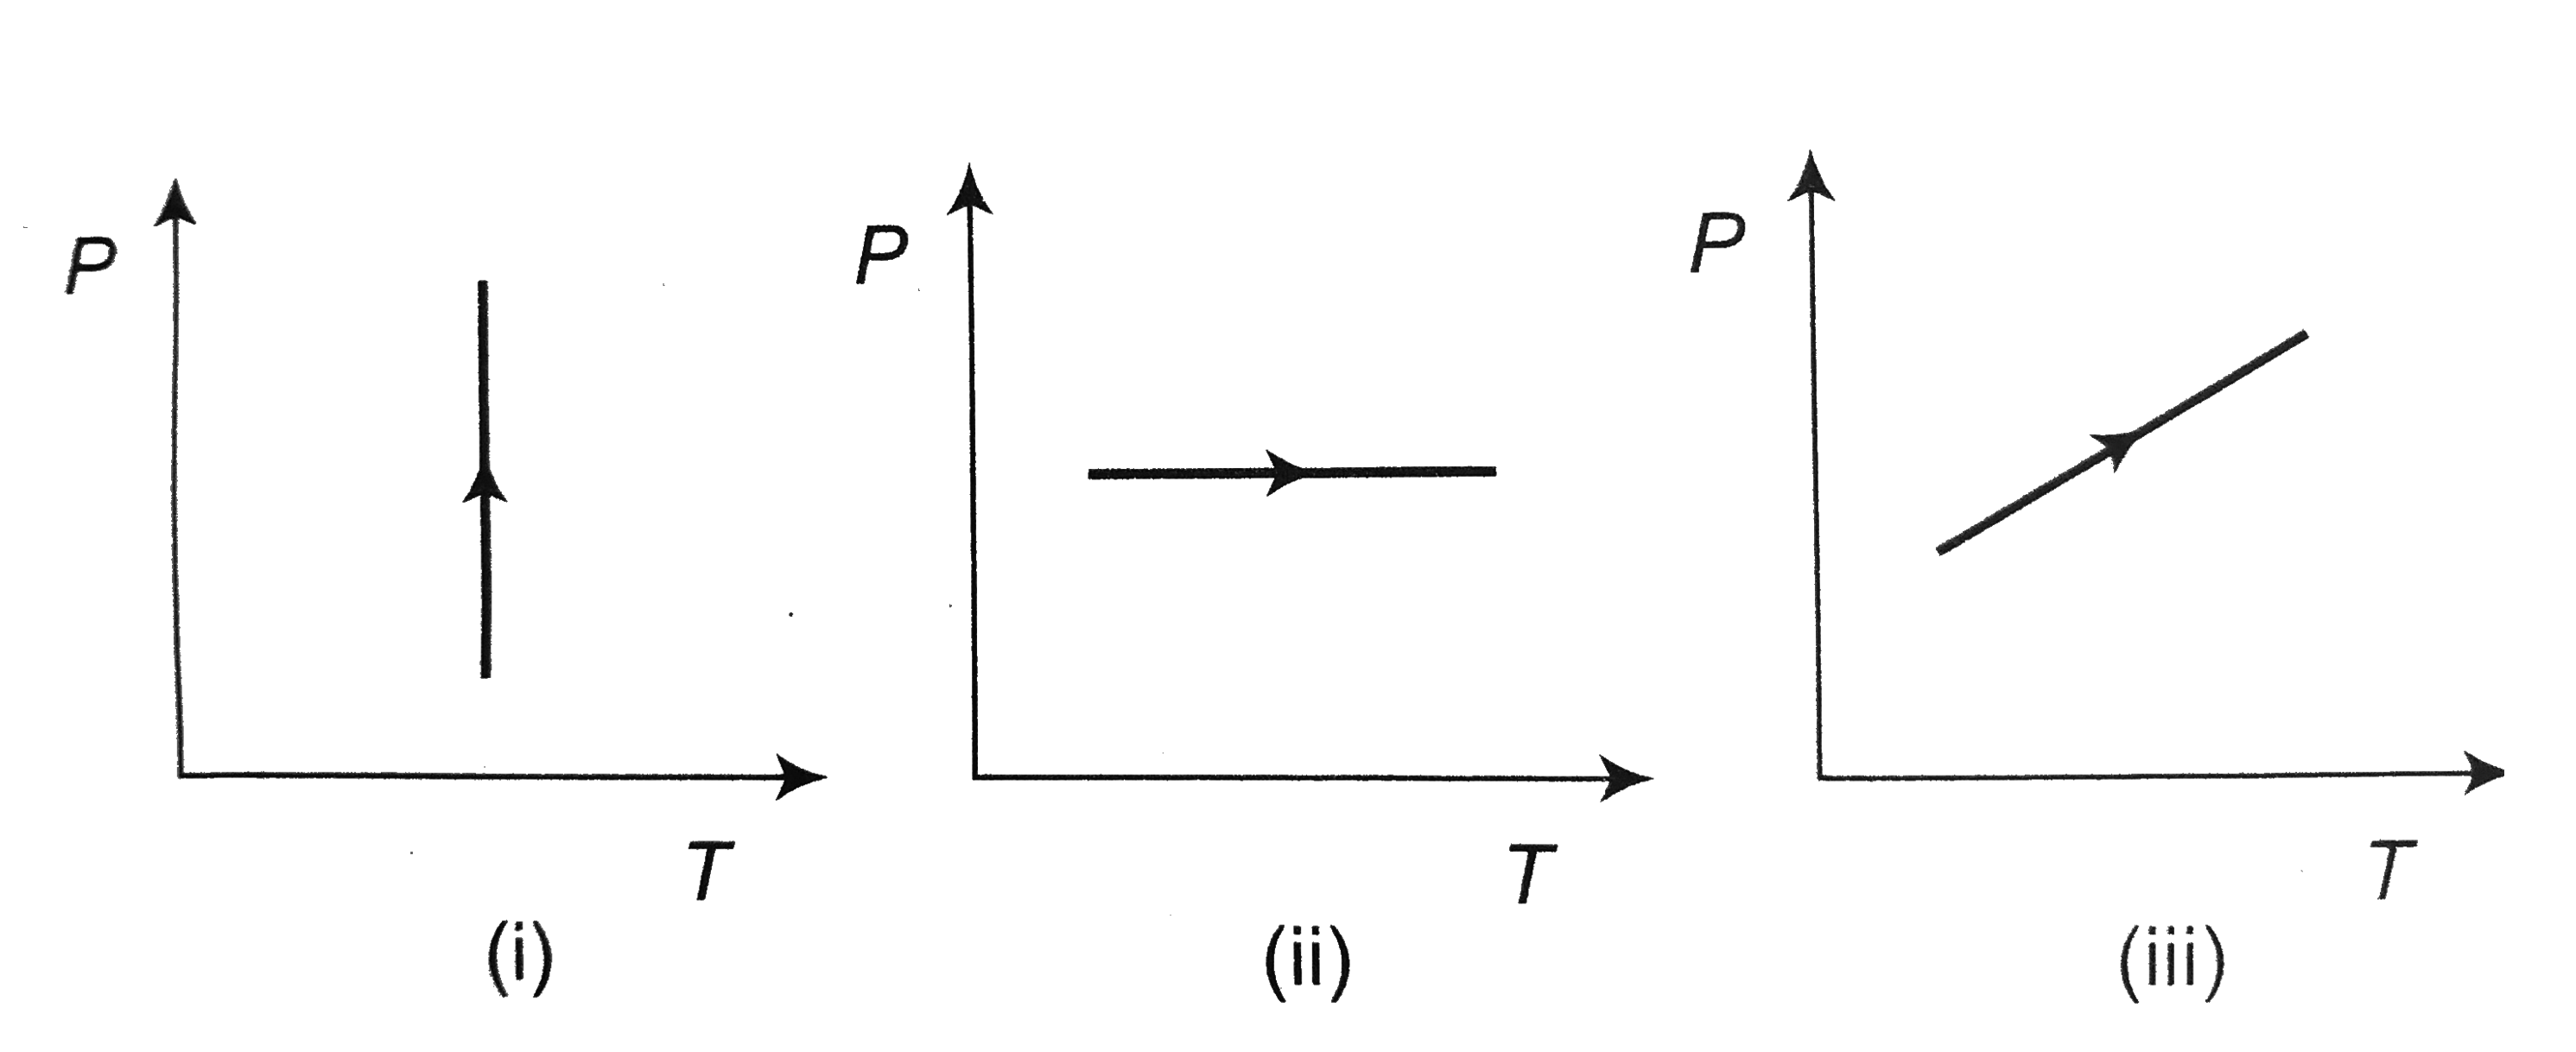 ADensity of gas is increased in graph (i)BDensity of gas is decrease in graph (ii)CDensity of gas is constant in graph (iii)DNone of these
 - Question 3 - Select One
graph of an ideal gas is as shown in figure.
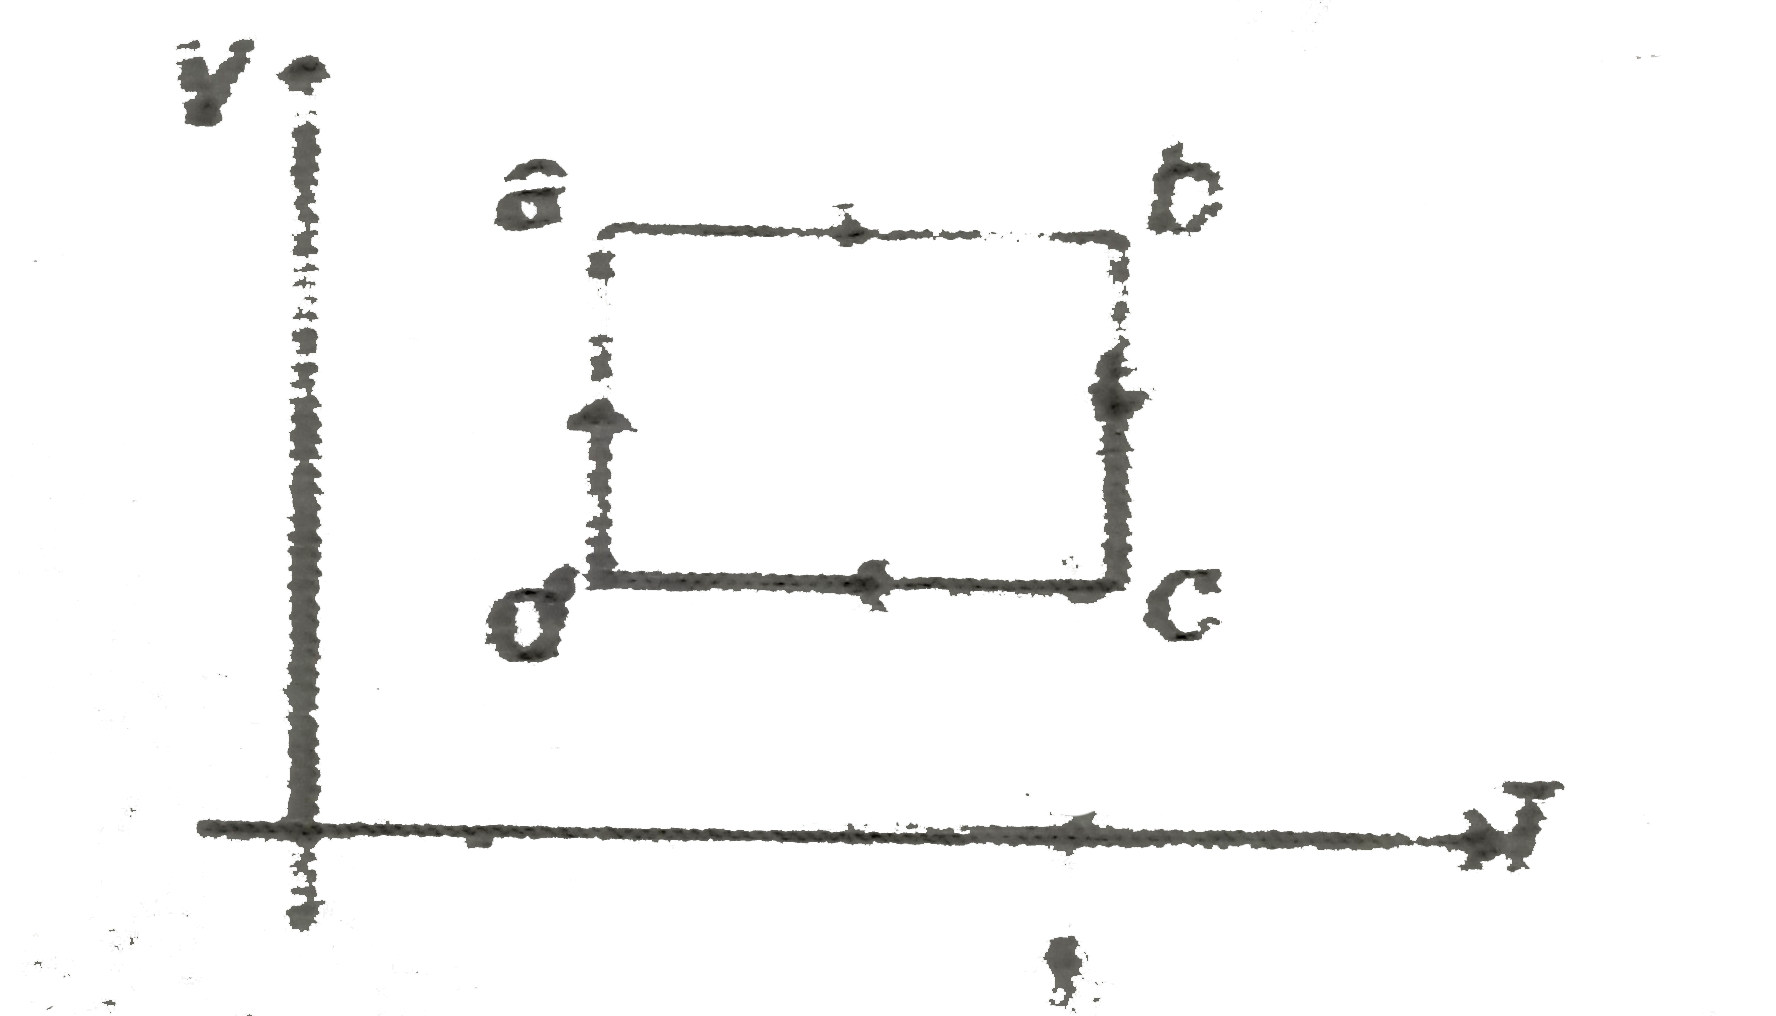
Work done by the gas in complete cyclic process about isAzeroBpositiveCnegativeDData is insufficient
P-T graphs of an ideal gas are as shown in figures-2.42 below. Choose the wrong statement from the options given:
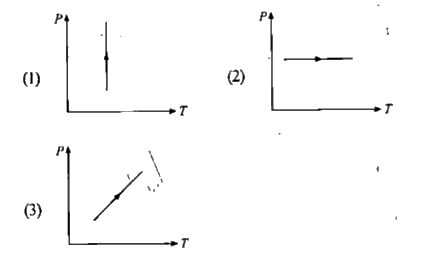 View Solution
graph of an ideal gas is as shown in figure.
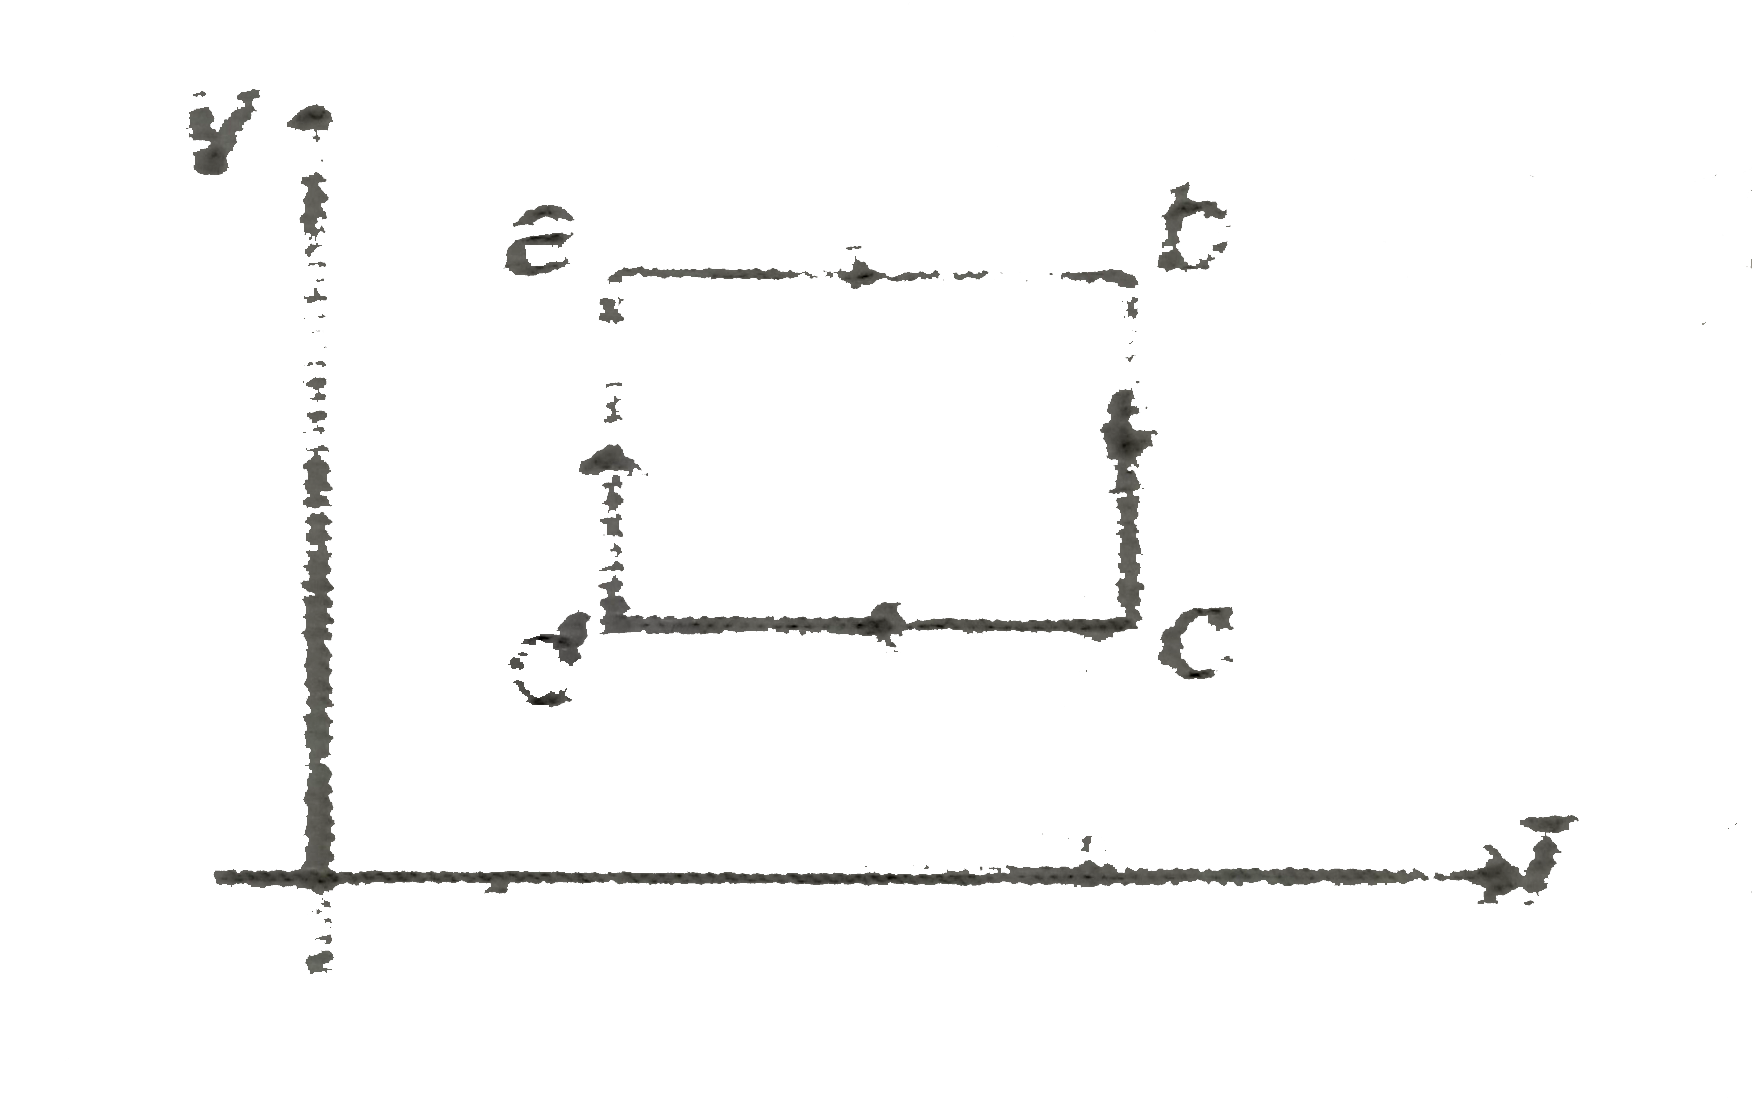
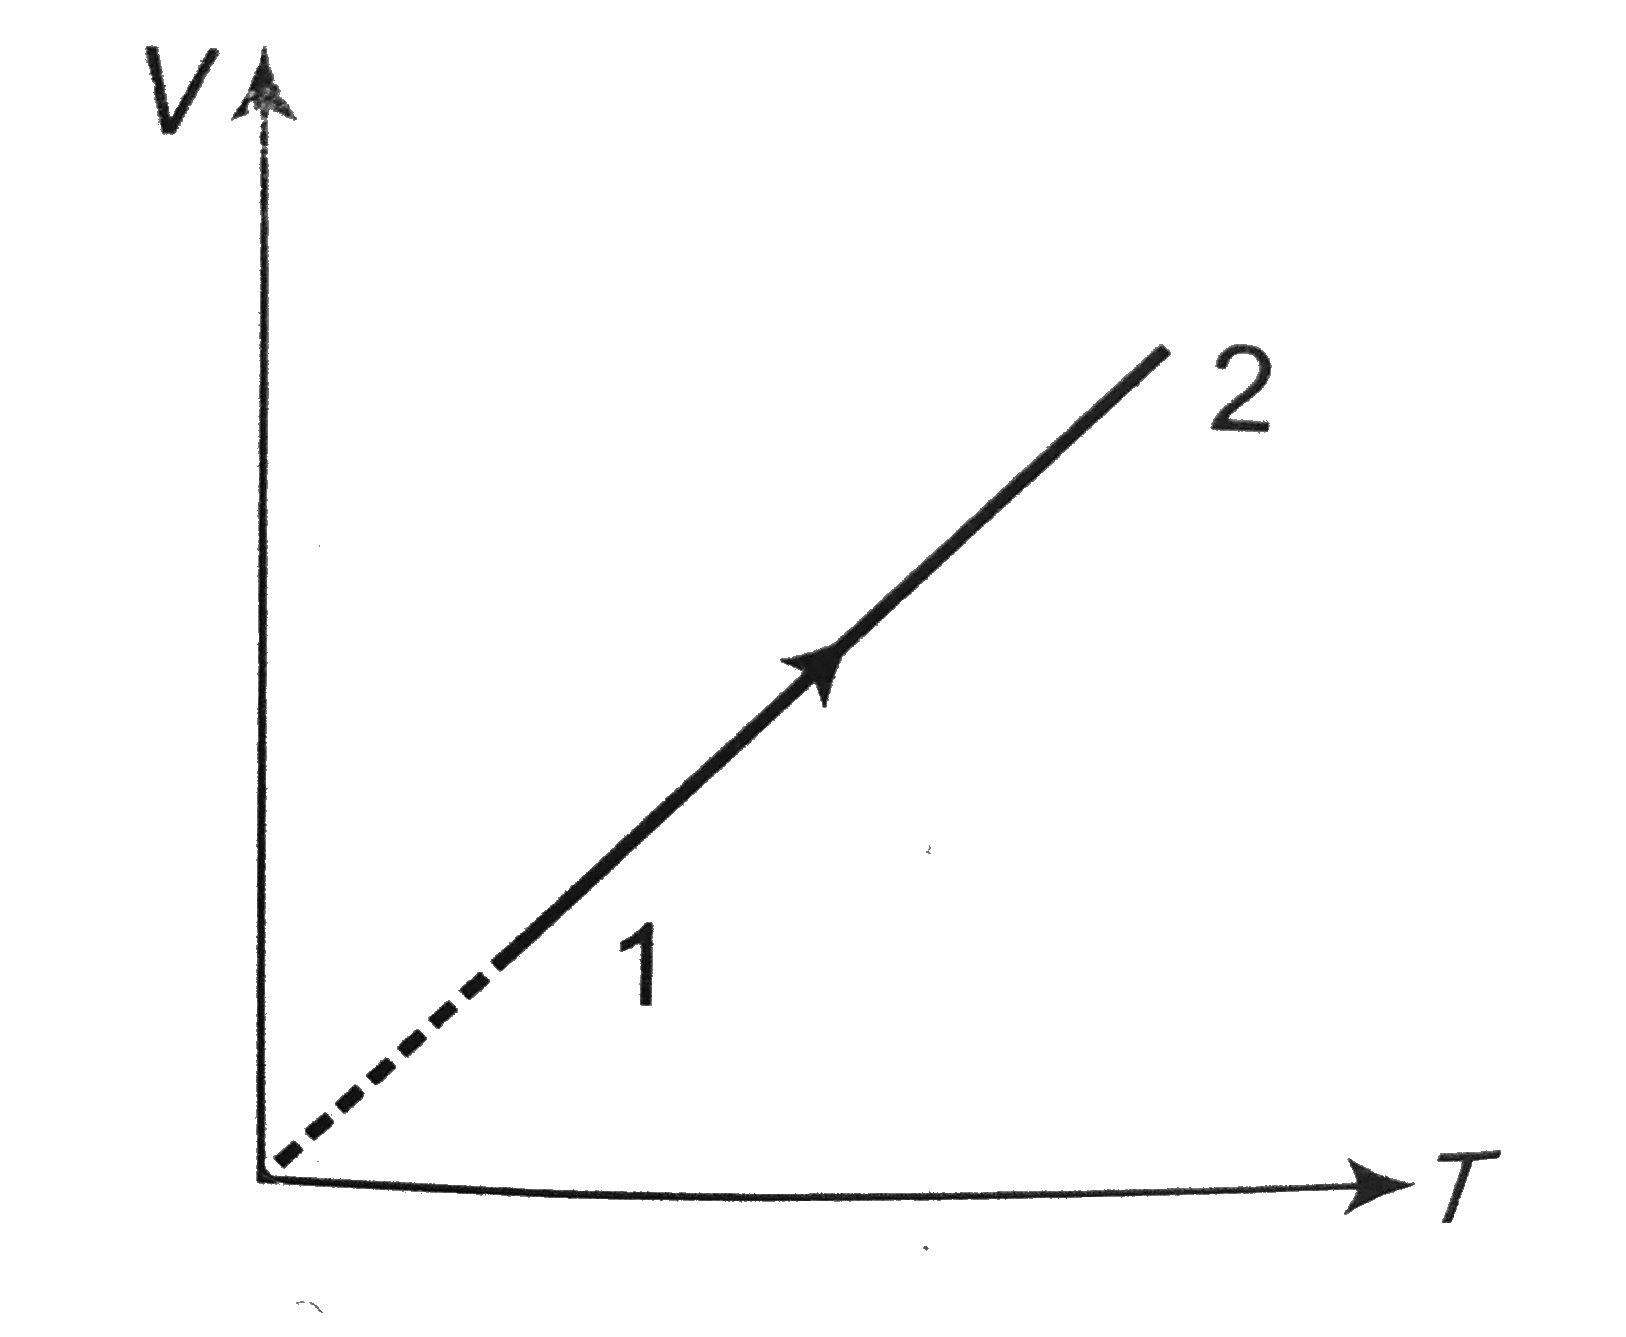
Heat is supplied to the gas in process (s).View SolutionVolume versus temperature graph of two moles of helium gas is as shown in figure. The ratio of heat absorbed and the work done by the gas in process 1−2 is
 View Solution
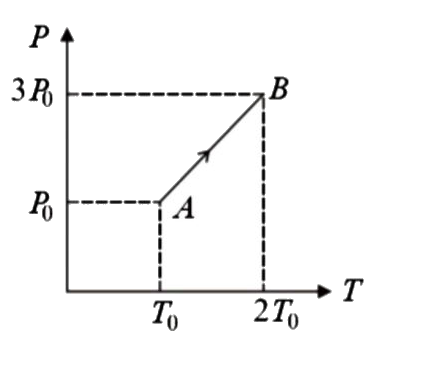
Pressure versus temperature graph of an ideal gas is as shown in figure. Density of the gas at point A is ρ0. Density at point B will be :-
 View Solution
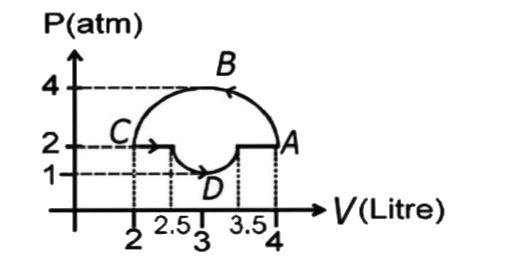
Find work done by the gas in the process shown in figure :
 View Solution

