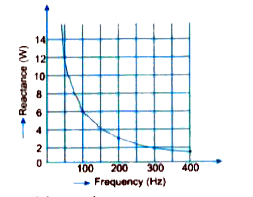
The figure shows the graphical variation of the rectance of a capacitor with frequency of acsource.

(a) Find the capacitance of the capacitor.
(b) An ideal inductor has the same reactance at 100 Hz frequency as the capacitor has at the same frequency. Find the value of inductance of the inductor.
(c ) Draw the graph showing the variation of the rectance of this inductor with frequency.
(a) As per graph for a frequency v = 100 Hz the capacitive reactance XC=6Ω.
∵XC=1Cω=1C.2πv
⇒C=12πv.XC=12×3.14×100×6=2.65×10⁻⁴For265μF
(b) As for v = 100 Hz,
XL=XC=6Ω
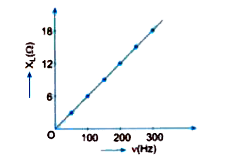
⇒L.2π×100=6⇒L=62π×100=9.55×10⁻³Hor9.55mH
(c ) XL−v graph is shown here:

Topper's Solved these Questions
- CBSE EXAMINATION PAPER 2020 BOOK - U-LIKE SERIESCHAPTER - CBSE EXAMINATION PAPER 2020 EXERCISE - SECTION D
12 Videos
- CBSE EXAMINATION PAPER 2020 BOOK - U-LIKE SERIESCHAPTER - CBSE EXAMINATION PAPER 2020 EXERCISE - SECTION B
1 Videos
- ATOMSBOOK - U-LIKE SERIESCHAPTER - ATOMSEXERCISE - SELF ASSESSMENT TEST (SECTION C)
2 Videos
- CBSE EXAMINATION PAPER 2020 (SOLVED)BOOK - U-LIKE SERIESCHAPTER - CBSE EXAMINATION PAPER 2020 (SOLVED)EXERCISE - SECTION D
11 Videos
Similar Questions
The figure shows the graphical variation of the reactance of a capacitor with frequency of ac source. (a) find the capacitance of the capacitor (b)an ideal inductor has the same reactance at 100 Hz frequency as the capacitor has the same frequency find the value of the inductor. (c) draw the graph showing the variation of the reactance of this inductor with frequency

View SolutionThe figure shows the graphical variation of the reactance of a capacitor with frequency of ac source. (a) find the capacitance of the capacitor (b)an ideal inductor has the same reactance at 100 Hz frequency as the capacitor has the same frequency find the value of the inductor. (c) draw the graph showing the variation of the reactance of this inductor with frequency

View Solution
Knowledge Check
The reactance of an inductor at 50 Hz is 100Ω. If the frequency is increased to 60 Hz, the reactance of the same inductor becomes
A12ΩB21ΩC1.2ΩD120Ω
Sketch a graph showing the variation of reactance of an inductor with frequency of the applied voltage
View SolutionHow the reactance of an inductor depends on frequency ?
View SolutionDraw a labelled graph showing the variation of inductive reactance (XL) verses frequency (f)
View SolutionPlot a graph showing variation of capacitive reactance with the change in the frequency of the AC source.
View SolutionSketch a graph to show how the reactance of(i) a capacitor (ii) an inductor varies as a function of frequency ?
View Solution(i) Draw the graphs showing variation of inductive reactance and capacitive reactance with frequency of applied a.c. source.
(ii) Can the voltage drop across the inductor or the capacitor in a series LCR circuit be greater than the applied voltage of the a.c. source ? Justify your answer.
View SolutionA resistor, a capacitor of 100μF capacitance and an inductor are in series with on AC source of frequency 50Hz. If the current in the circuit is in phase with the applied voltage. The inductance of the inductor is
View Solution
