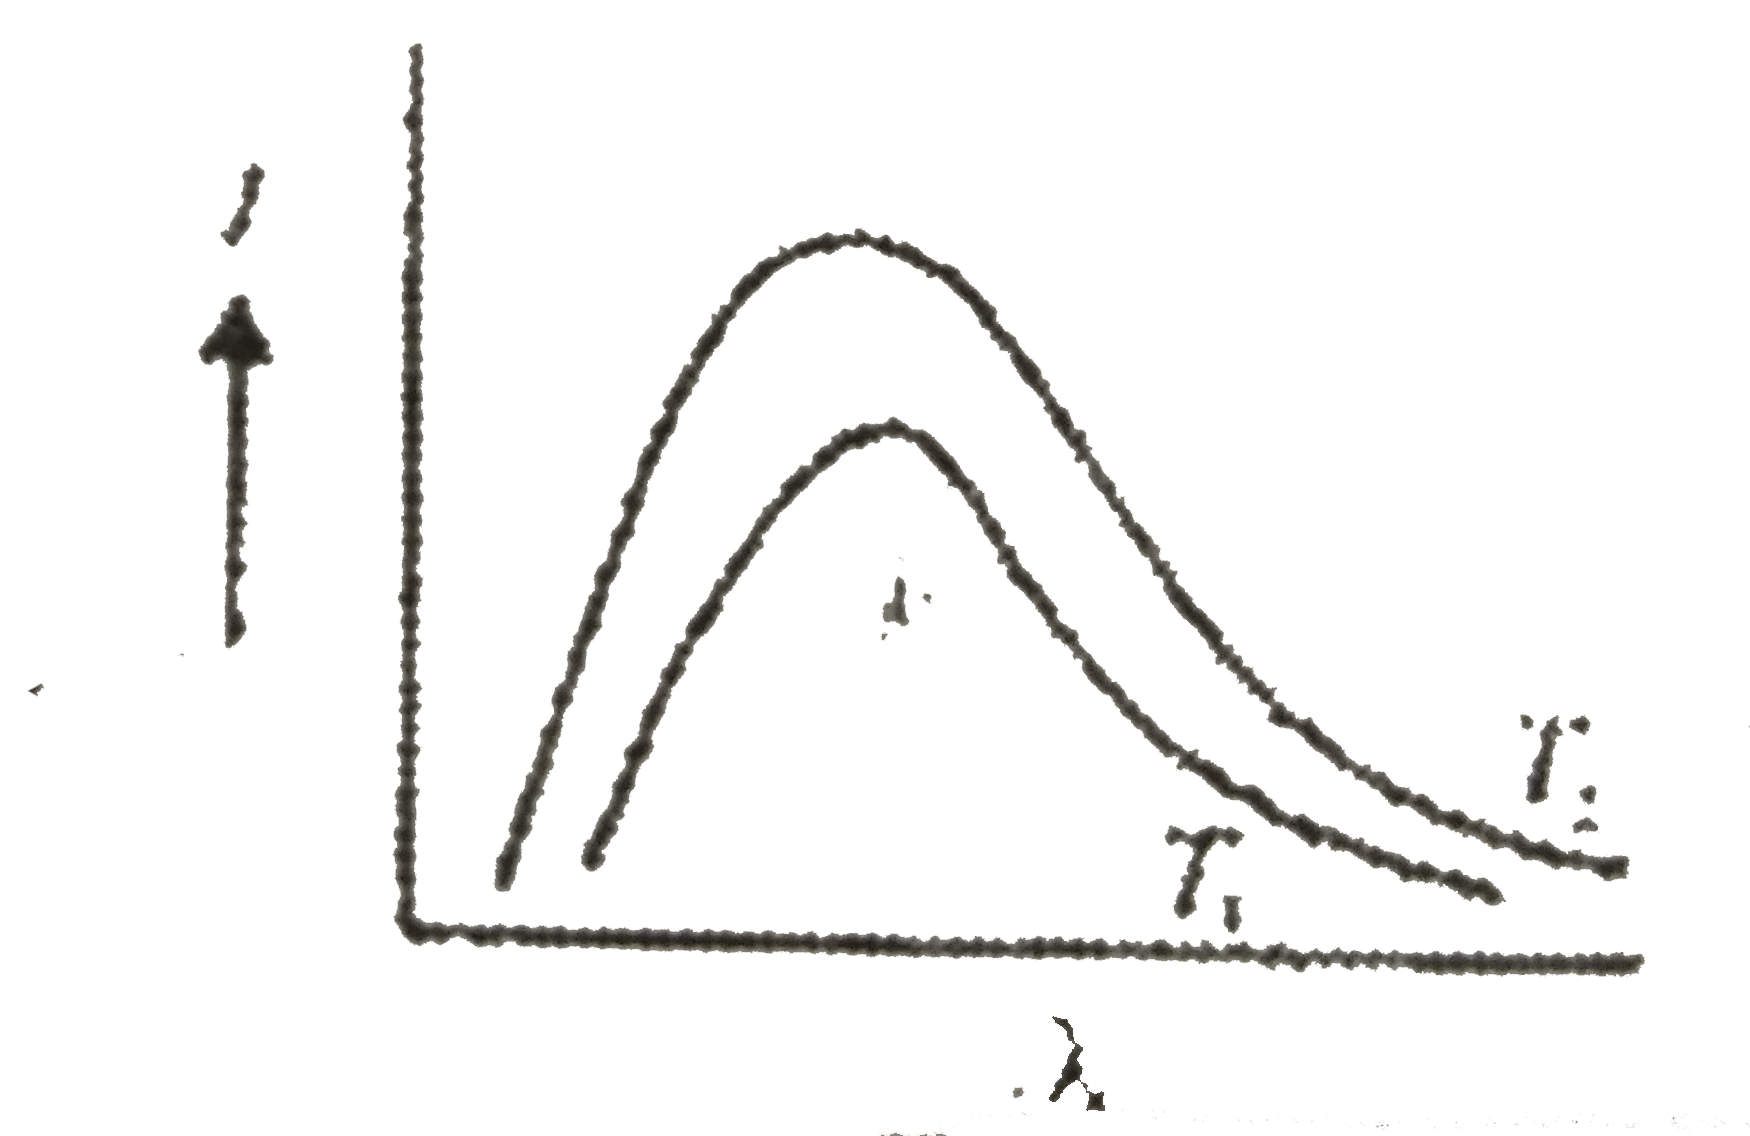
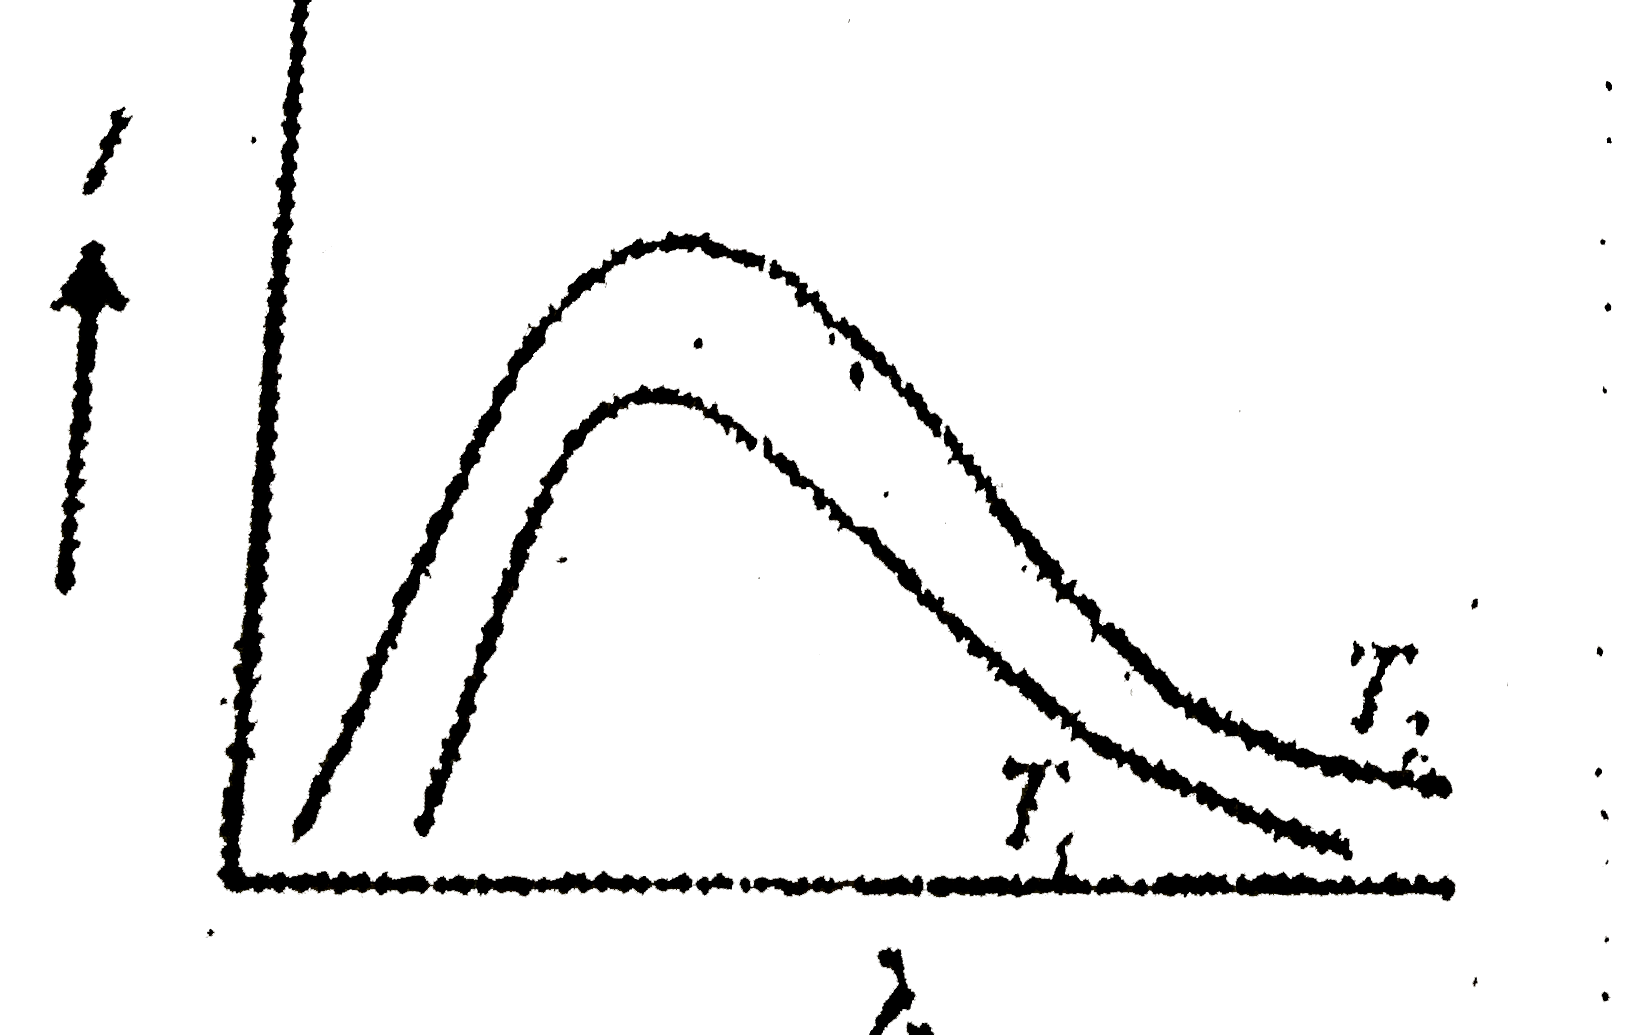
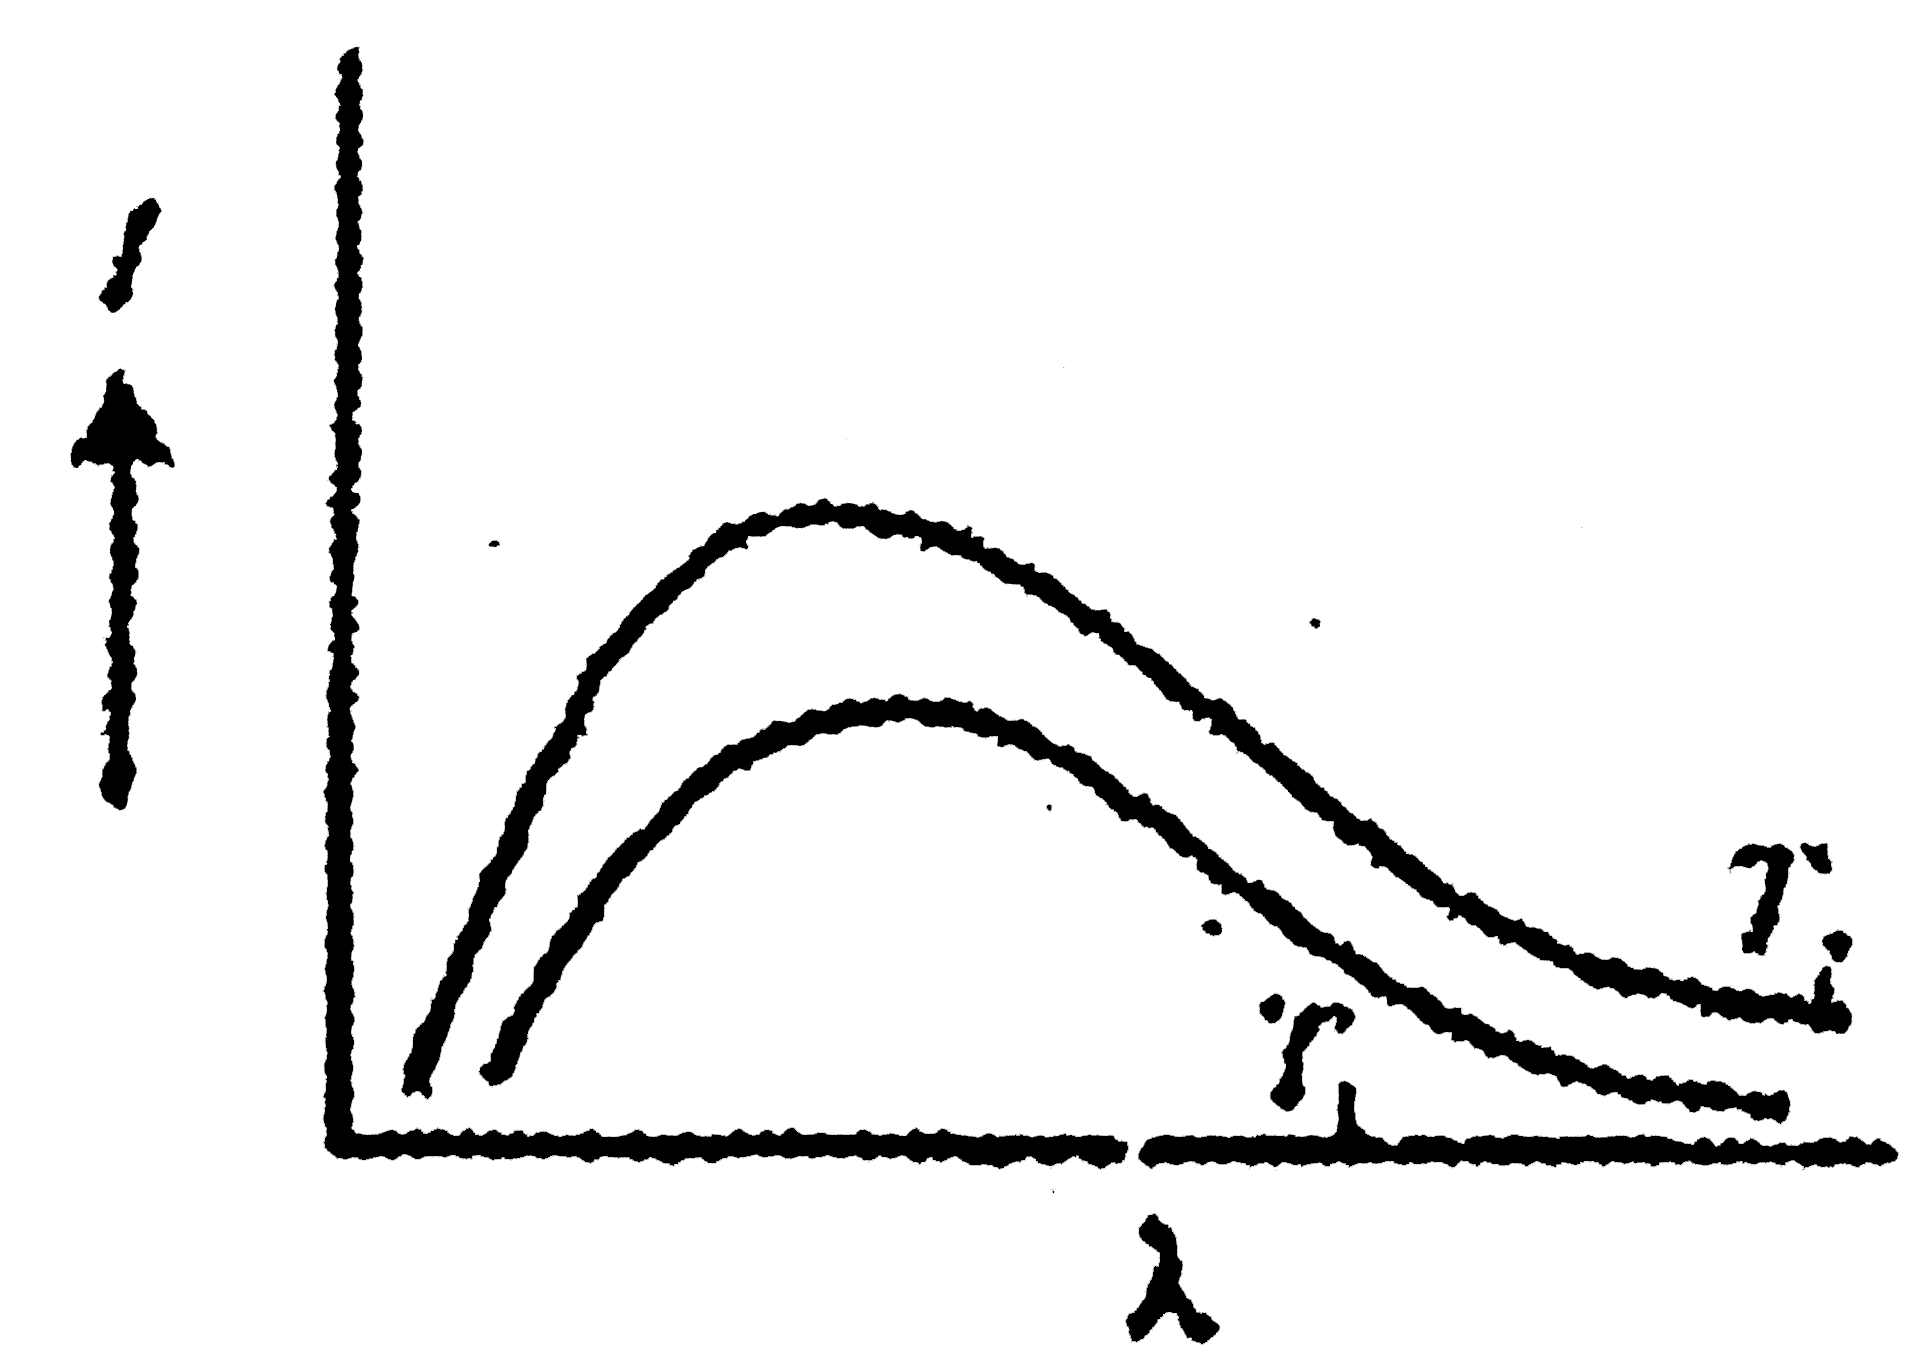
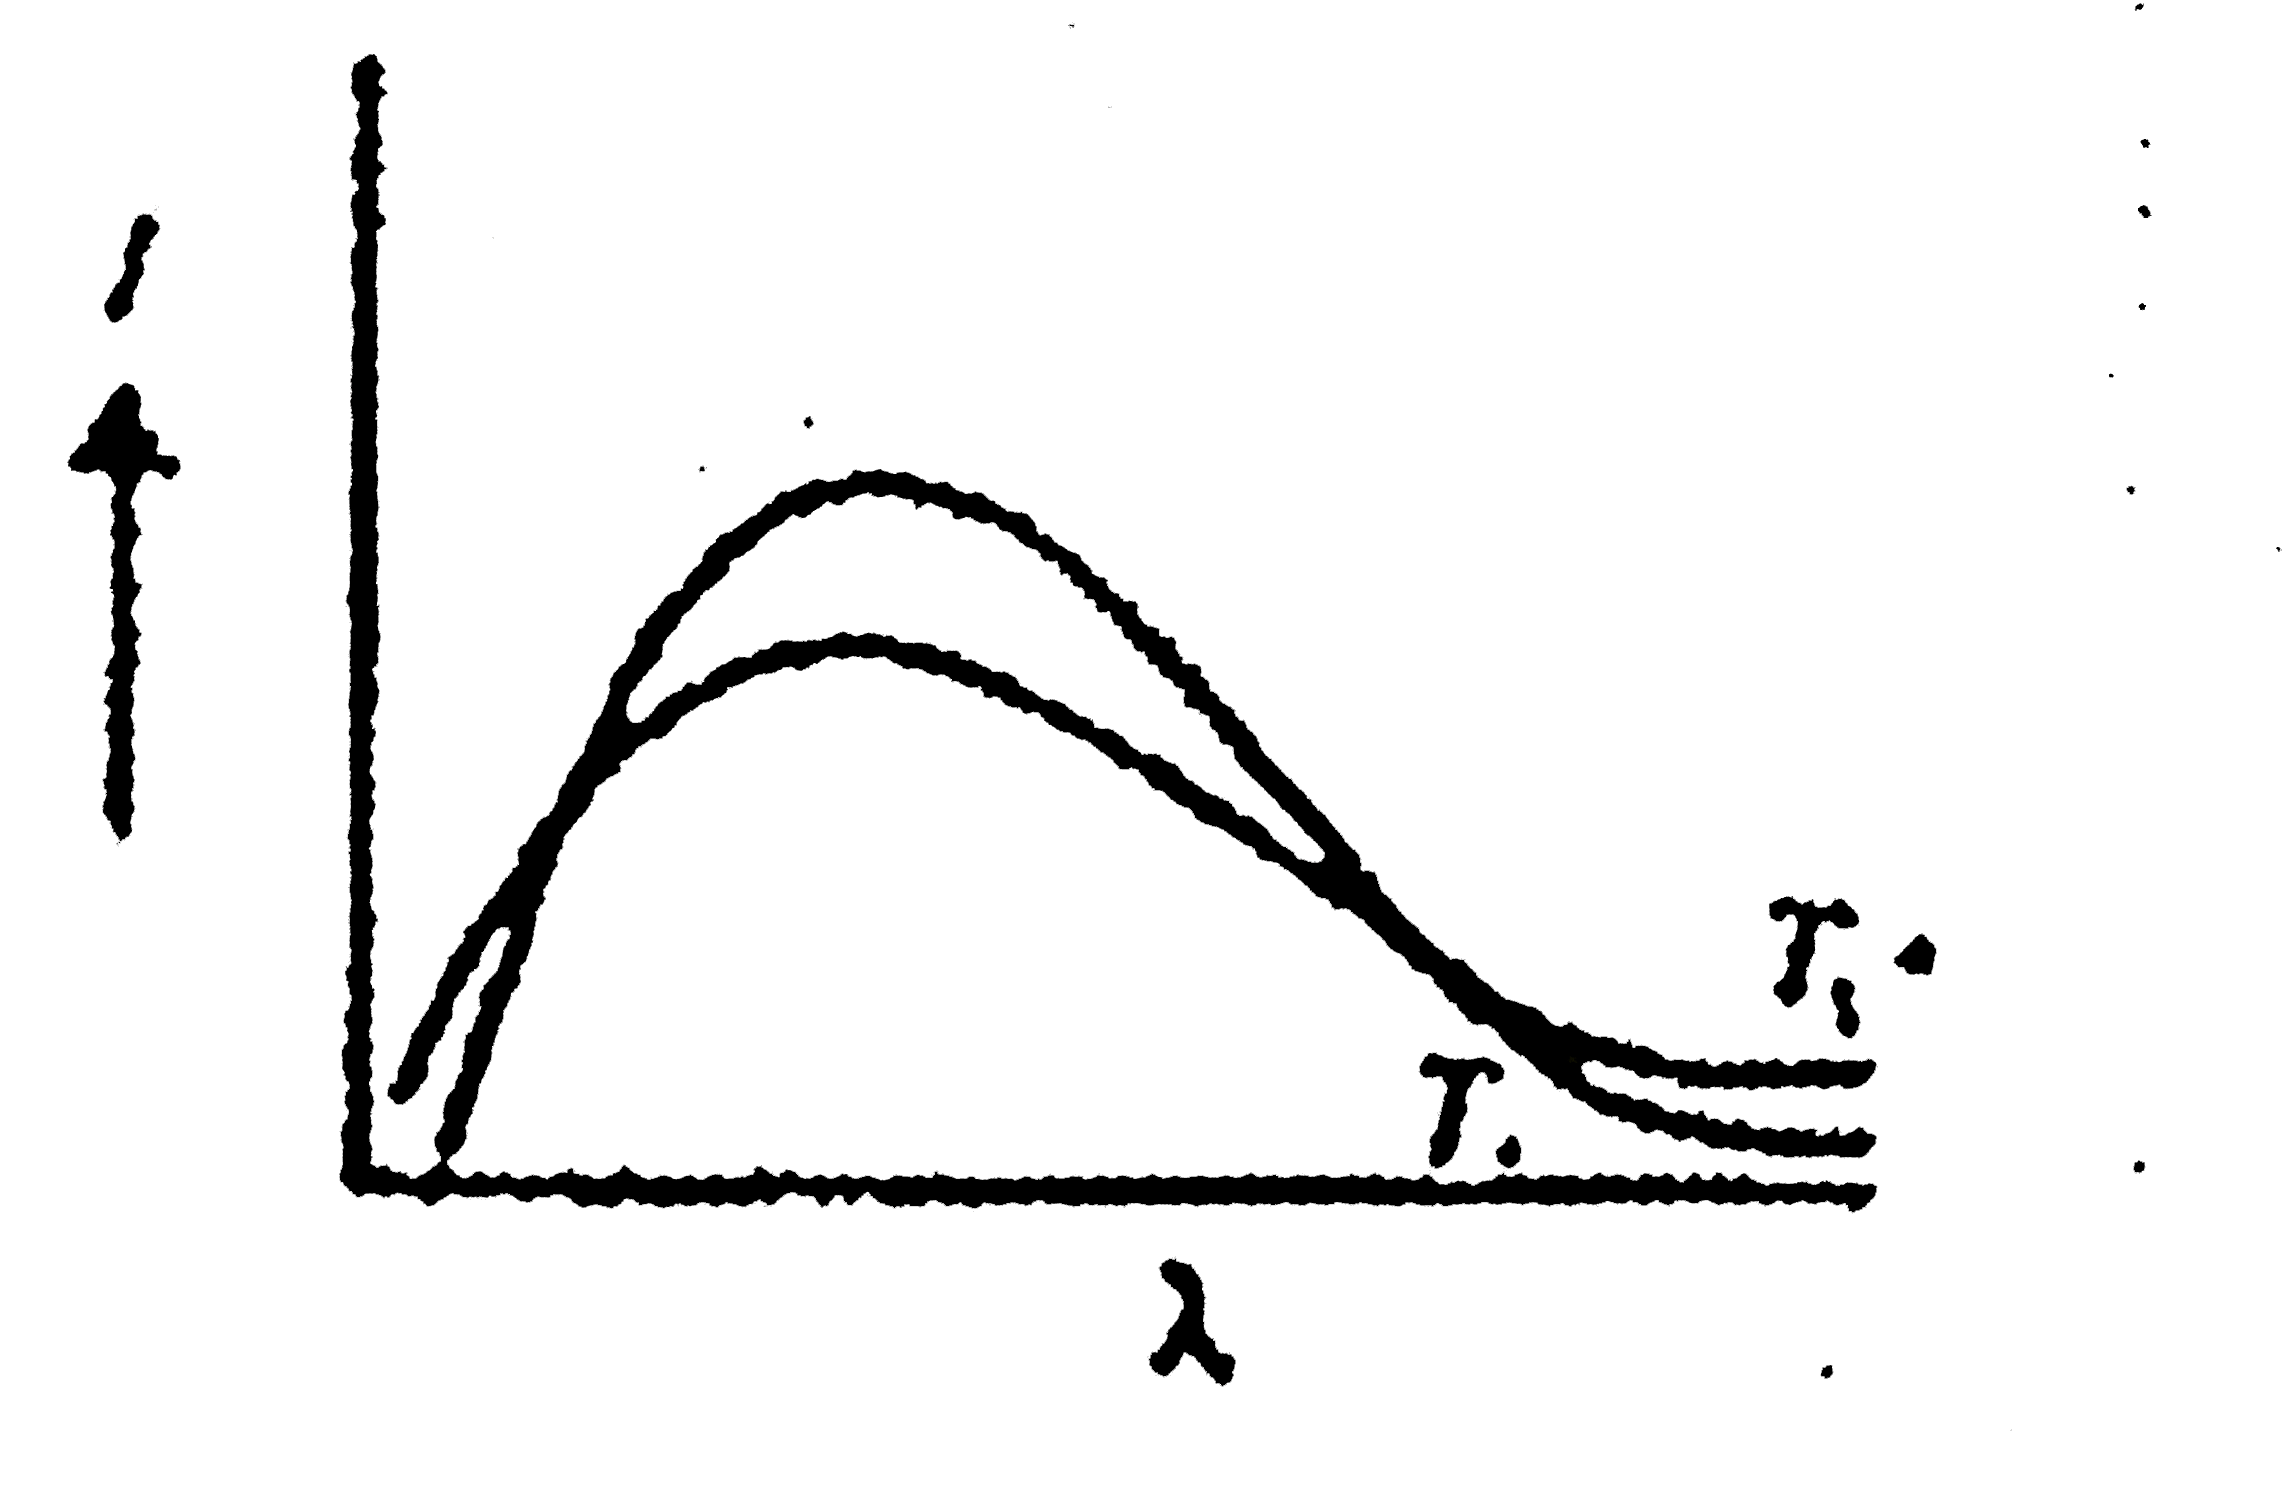
Shown below are the black body radiation curves at temperature T1 and T2(T2>T1). Which of the following plots is correct?
A
B
C
D
Video Solution
Text Solution
The correct Answer is:C
From Wein's displacement law, we know that,
λmT=constant
Which means that as temperature increases than the wavelength having the maximum intensity shifts towards left. Here, T2>T1
∴λmT2<λmT1
But in plot (a) λmT2=λmT1 in plot (b) λmT2>λmT1 and in plot (d) λmT2>λmT1. Therefore the correct plot is (c) where λmT2<λmT1.
|
Updated on:21/07/2023
Topper's Solved these Questions
Similar Questions
Knowledge Check
- Question 1 - Select One
Show below are the black body radiation curves at temperature T1 and T2(T2>T1). Which of the following plots is correct?
A B
B C
C D
D
- Question 2 - Select One
A black body radiates heat at temperatures T1 and T2(T2>T1 the frequency corresponding to maxium energy is
Amore atT1Bmore at T2Cequal for T1 and T2Dindependent of T1 and T2 - Question 3 - Select One
A black body radiates heat at temperatures T1 and T2(T2>T1 the frequency corresponding to maxium energy is
Amore atT1Bmore at T2Cequal for T1 and T2Dindependent of T1 and T2
Select the graph that correctly describes the adsorption isotherms at two temperatures T1 and T2(T1>T2) for a gas : (x — mass of the gas adsorbed m-mass of adsorbent P - pressure)
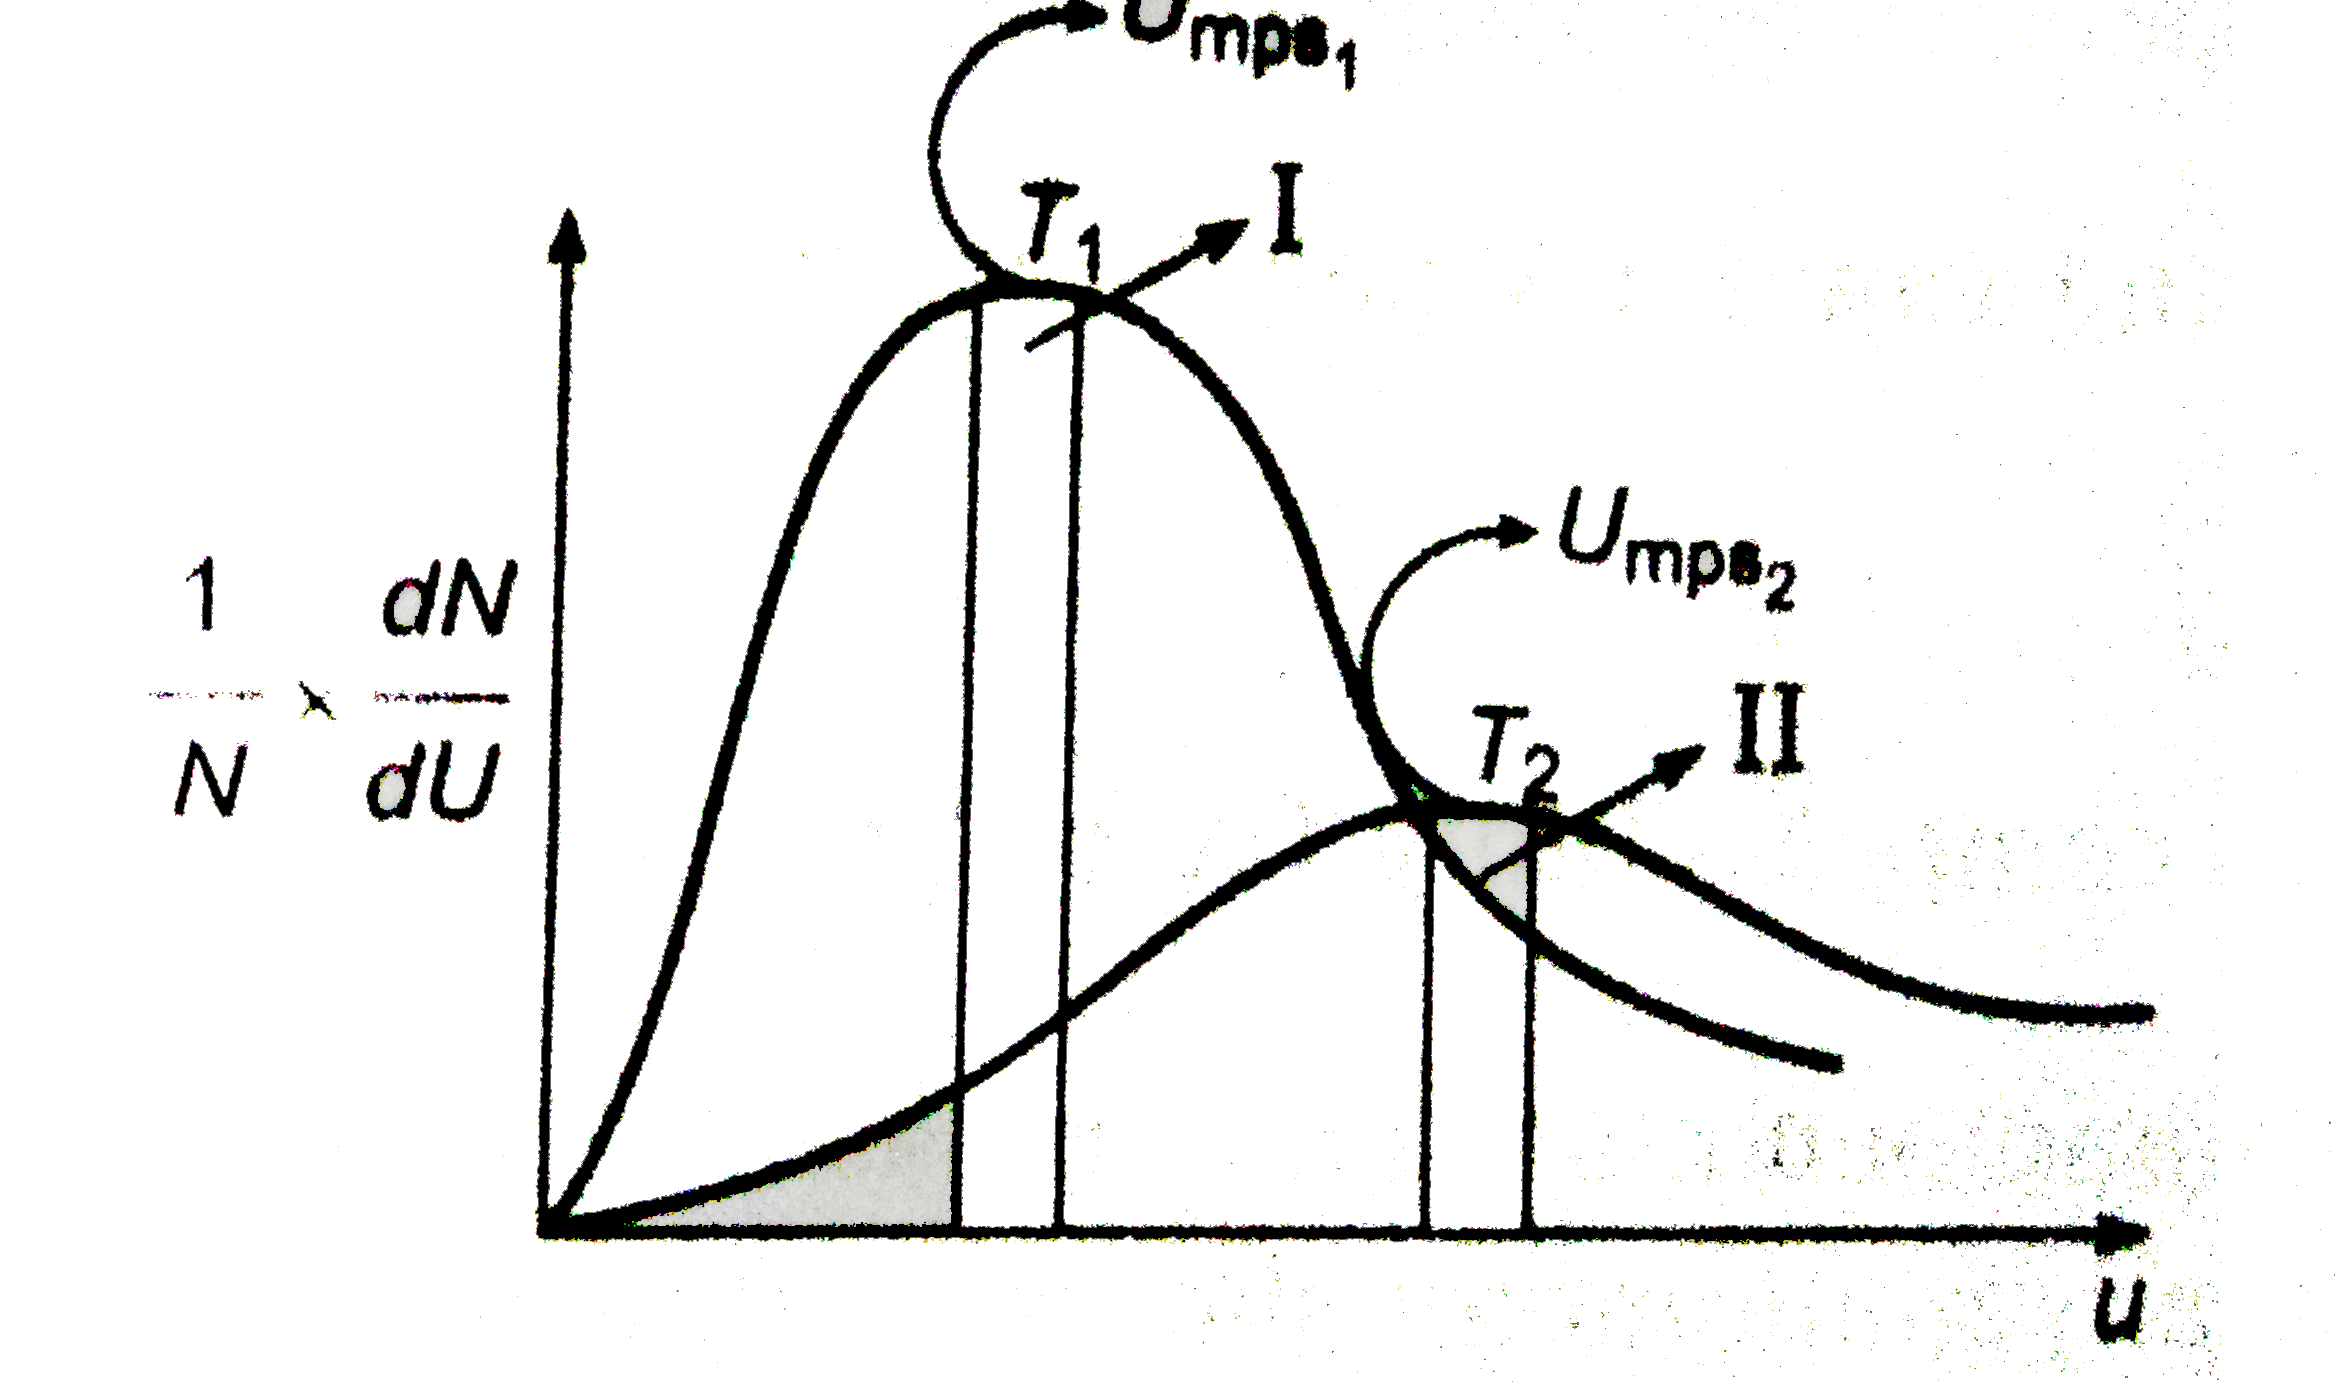
View SolutionFollowing represents the Maxwell distribution curve for an ideal gas at two temperature T1 and T2 . Which of the following option(s) is/are true?
 View Solution
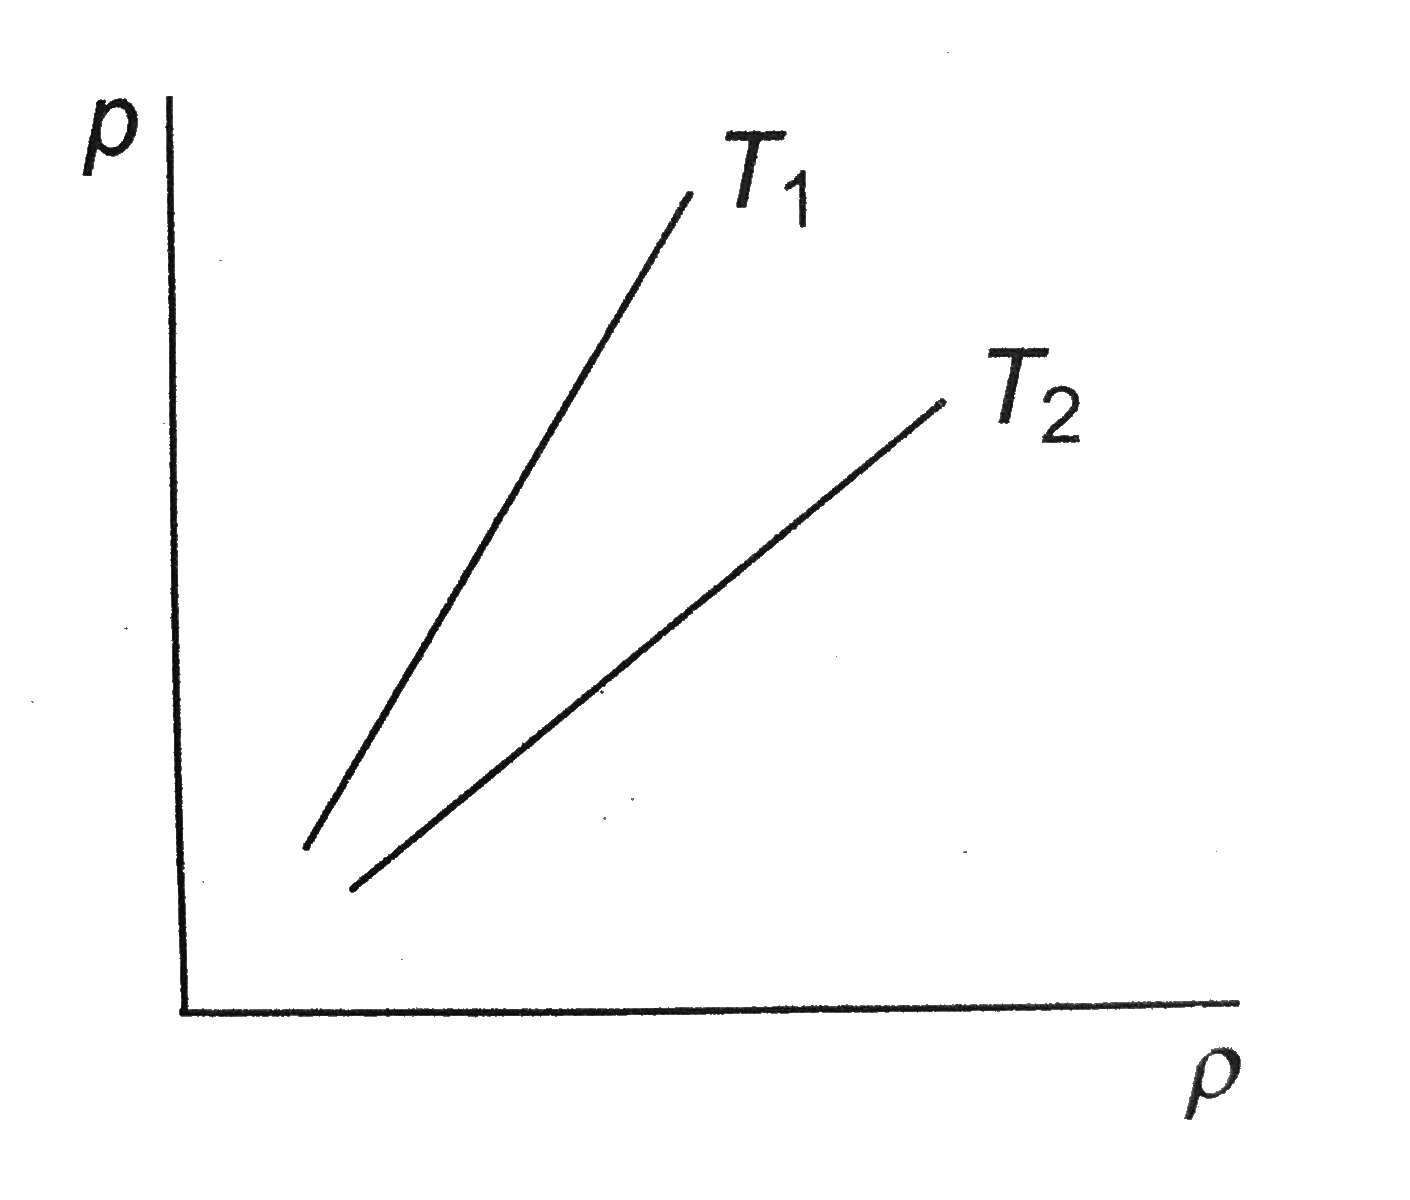
Figure shows graphs of pressure vs density for an ideal gas at two temperature T1andT2. Which of the following is correct?
 View Solution
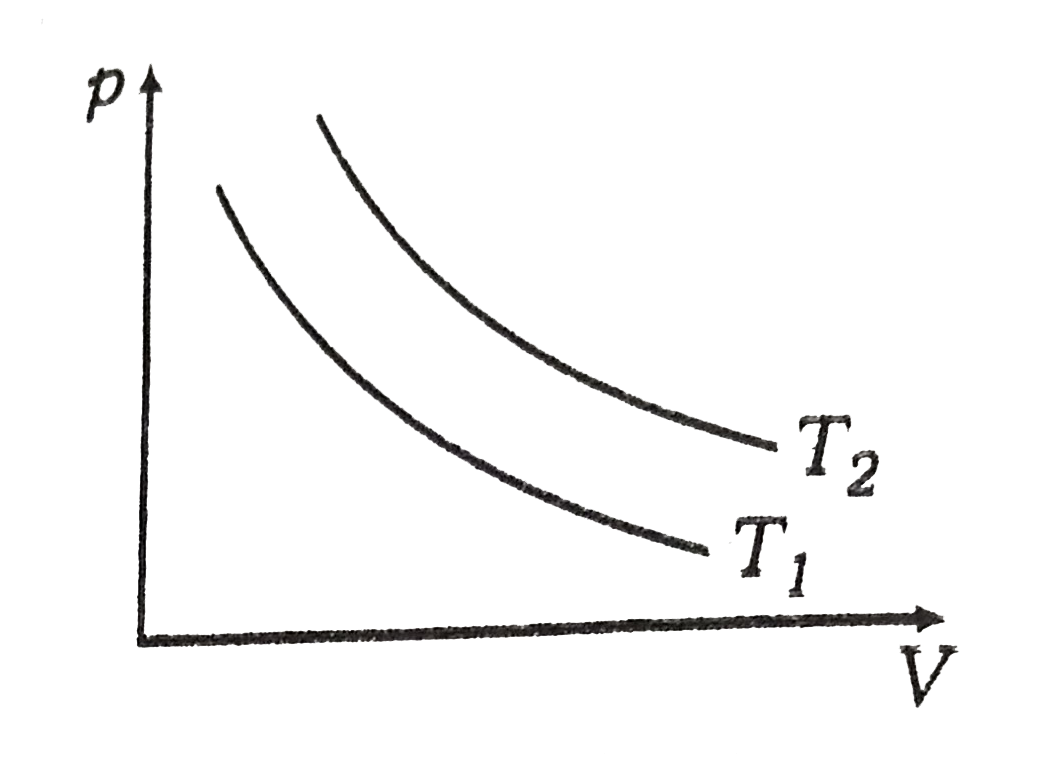
The adjoining fgure shows graph of pressure and volume of a gas at two temperatures T1 and T2 Which one the following is correct
 View Solution
The figure shows the variation of V with i at temperatures T1 and T2. Then T1−T2 is proportional to
 View Solution


