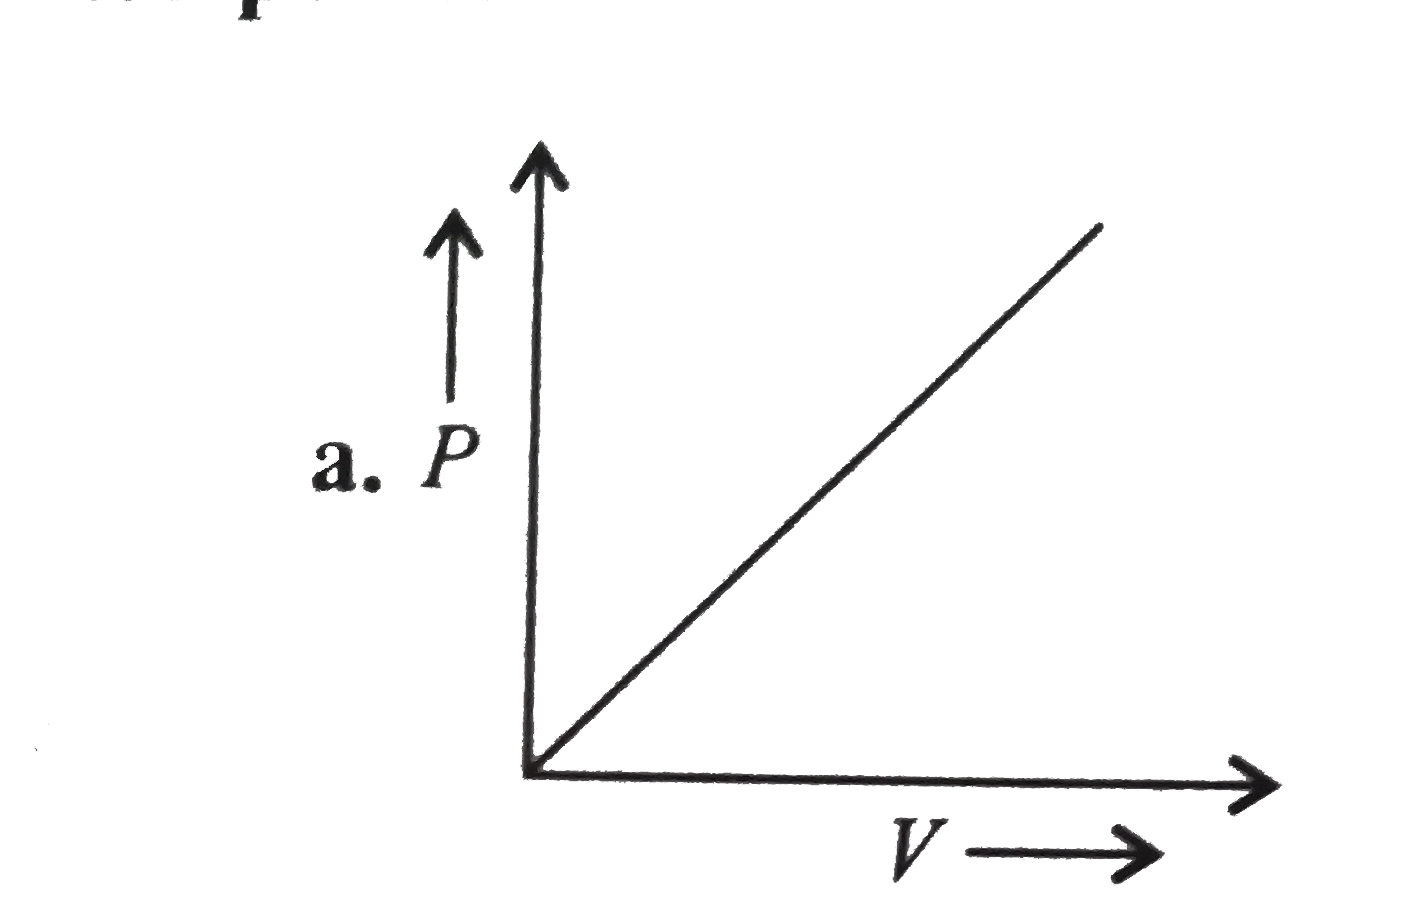
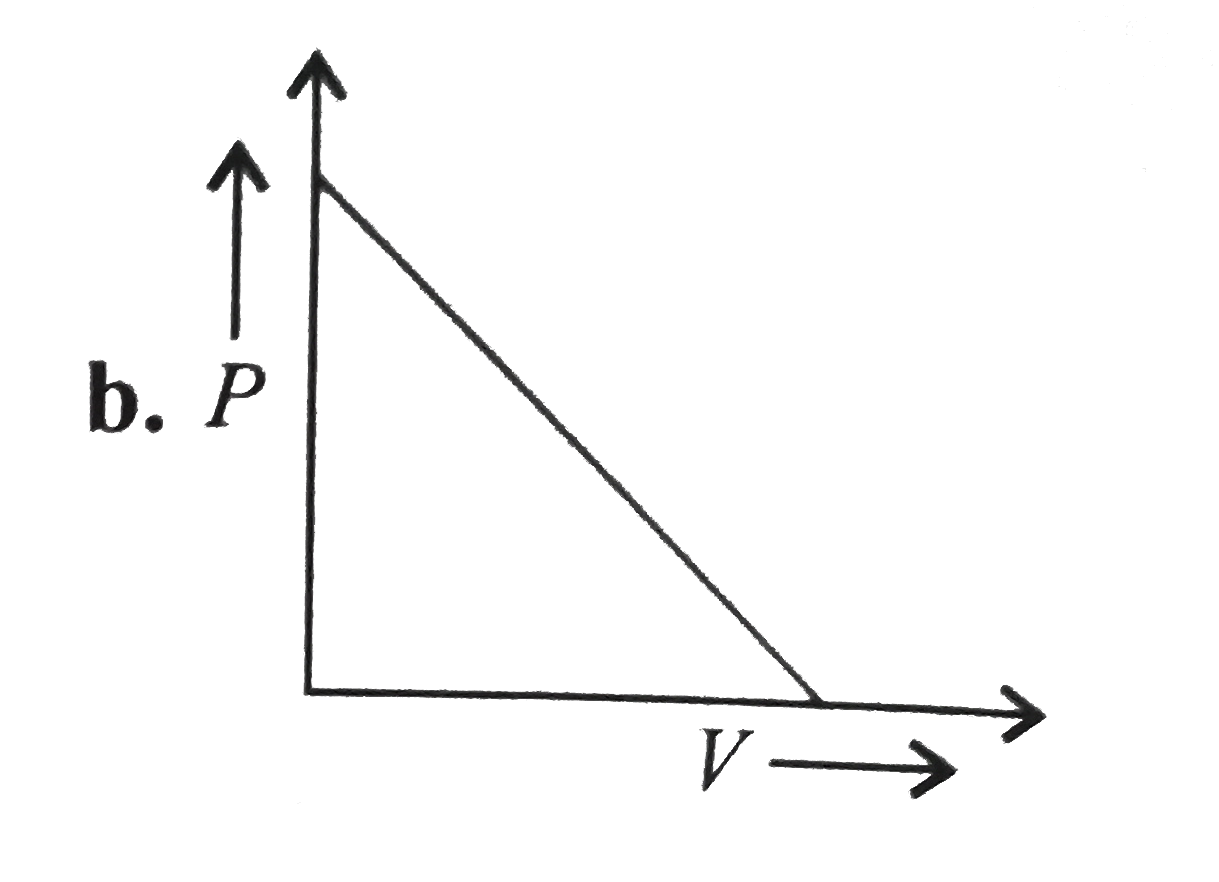
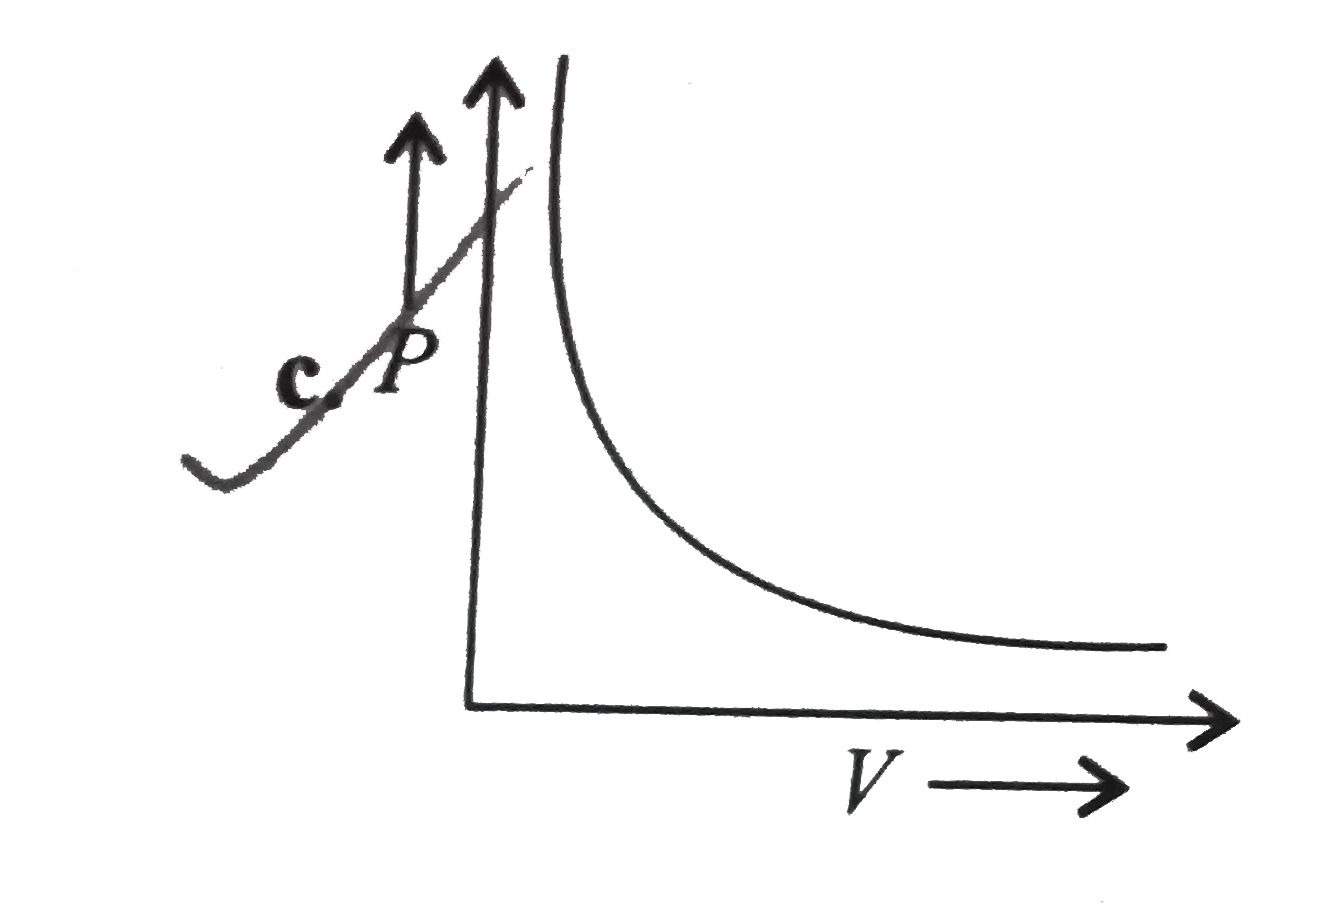
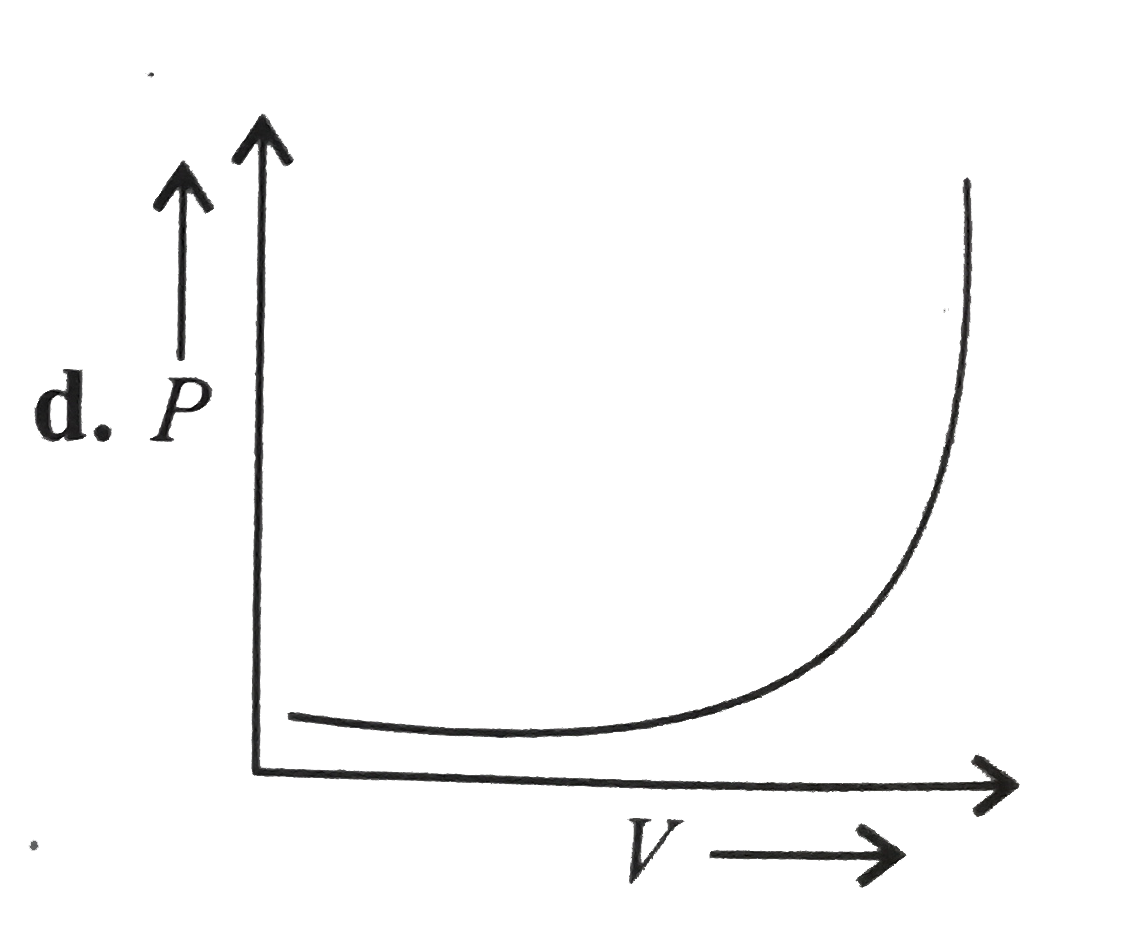
The graph betwene and at constant temperature should look like


To determine the graph between pressure (P) and volume (V) at constant temperature, we can use Boyle's Law, which states that for a given mass of gas at constant temperature, the product of pressure and volume is constant. This can be mathematically expressed as:
1. Boyle's Law Statement:
PV=k
where k is a constant.
2. Understanding the Relationship:
From Boyle's Law, we can derive that:
P∝1V
This means that pressure is inversely proportional to volume. As the volume increases, the pressure decreases, and vice versa.
3. Graphical Representation:
When we plot the graph of pressure (P) against volume (V), we need to understand that since P is inversely proportional to V, the graph will not be a straight line but rather a hyperbola.
4. Sketching the Graph:
- The graph will be a curve that approaches both axes but never touches them (as volume cannot be zero).
- The curve will be in the first quadrant, indicating that both pressure and volume are positive quantities.
5. Conclusion:
Therefore, the graph between pressure (P) and volume (V) at constant temperature will look like a hyperbola, demonstrating the inverse relationship between pressure and volume.
Summary of Steps:
1. State Boyle's Law: PV=k.
2. Understand the inverse relationship: P∝1V.
3. Recognize that the graph will be a hyperbola.
4. Sketch the hyperbola in the first quadrant.
PV=k
where k is a constant.
From Boyle's Law, we can derive that:
P∝1V
This means that pressure is inversely proportional to volume. As the volume increases, the pressure decreases, and vice versa.
When we plot the graph of pressure (P) against volume (V), we need to understand that since P is inversely proportional to V, the graph will not be a straight line but rather a hyperbola.
- The graph will be a curve that approaches both axes but never touches them (as volume cannot be zero).
- The curve will be in the first quadrant, indicating that both pressure and volume are positive quantities.
Therefore, the graph between pressure (P) and volume (V) at constant temperature will look like a hyperbola, demonstrating the inverse relationship between pressure and volume.
1. State Boyle's Law: PV=k.
2. Understand the inverse relationship: P∝1V.
3. Recognize that the graph will be a hyperbola.
4. Sketch the hyperbola in the first quadrant.
Topper's Solved these Questions
- THERMODYNAMICSBOOK - CENGAGE CHEMISTRY ENGLISHCHAPTER - THERMODYNAMICSEXERCISE - Exercise
1 Videos
- THERMODYNAMICSBOOK - CENGAGE CHEMISTRY ENGLISHCHAPTER - THERMODYNAMICSEXERCISE - Ex 6.1
26 Videos
- STOICHIOMETRYBOOK - CENGAGE CHEMISTRY ENGLISHCHAPTER - STOICHIOMETRYEXERCISE - Archives Subjective
33 Videos
Similar Questions
The slope of the graph between log P and log V at constant temperature for a given mass of gas is
View SolutionThe graph between PV vs P at constant temperature is linear parallel to the pressure axis.
View SolutionWhat is the type of graph between log P and log V at constant temperature?
View SolutionA student measures the focal length of a convex lens by putting an object pin at a distance u from the lens and measuring the distance v of the image pin. The graph between u and v plotted by the student should look like
View SolutionWhat is the type of graph between log P and log(1V) at constant temperature for a given amount of gas ?
View SolutionThe slope of the plot between pV and p at constant temperature is
View SolutionThe law describing realtionship between P and V of ideal gas at constant temperature is called..........
View SolutionThe graph between 1v and 1u for a concave mirror looks like.
View SolutionThe graph between 1v and 1u for a concave mirror looks like.
View SolutionThe graph between (P/T) and T for a gas at constant volume will be:
View Solution
