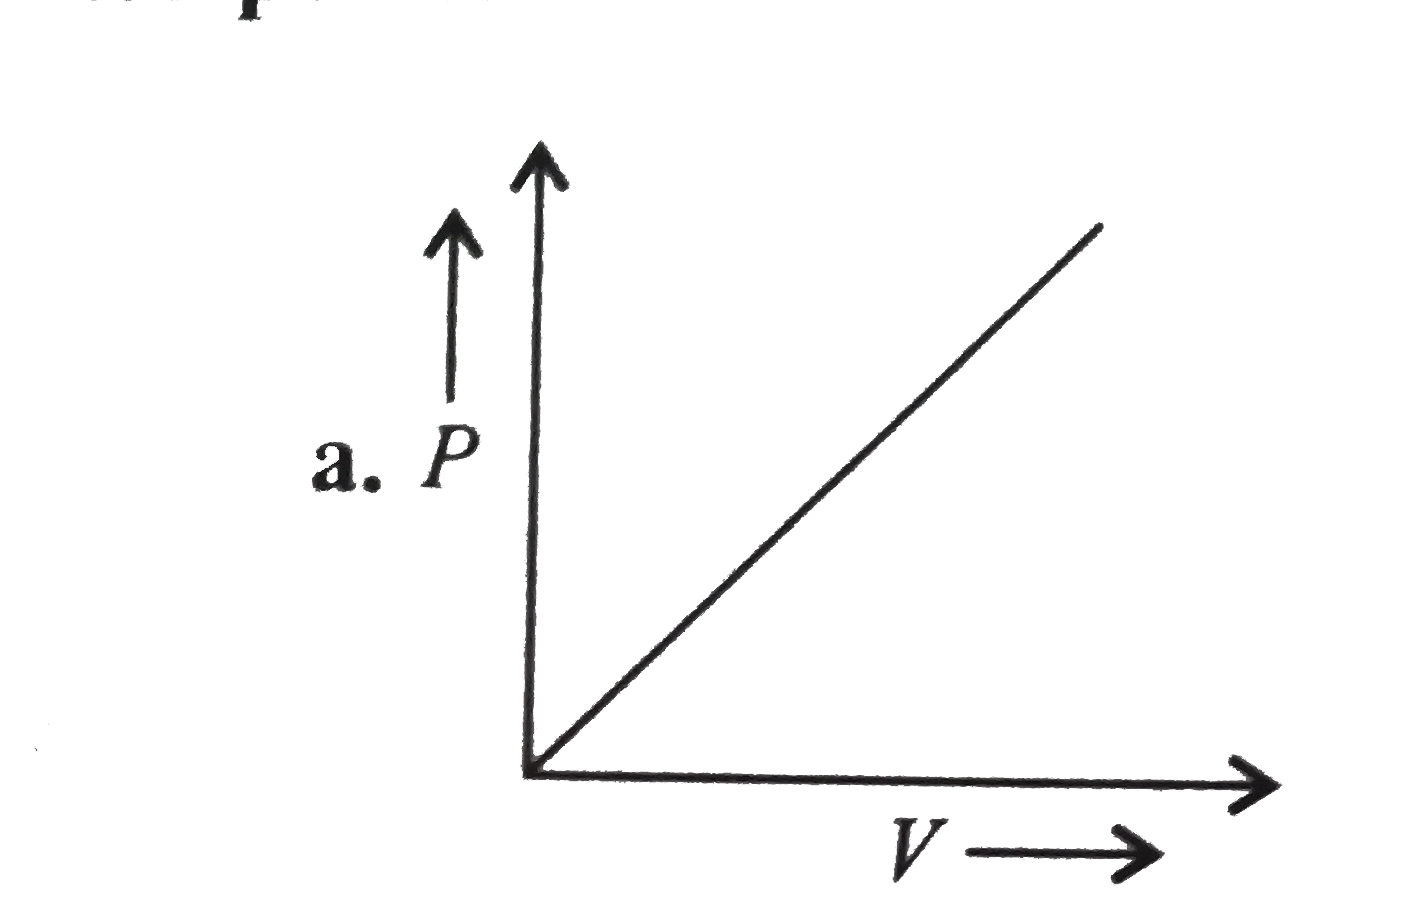
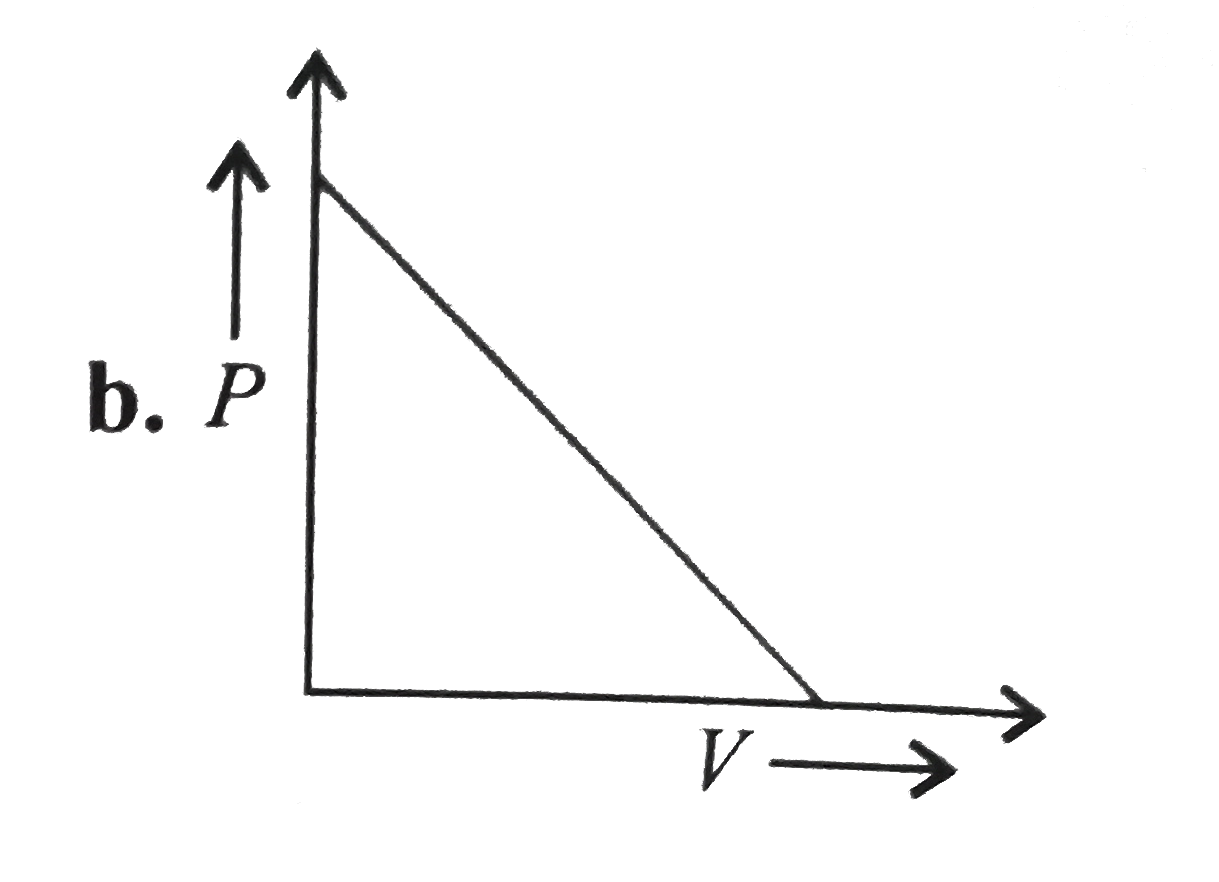
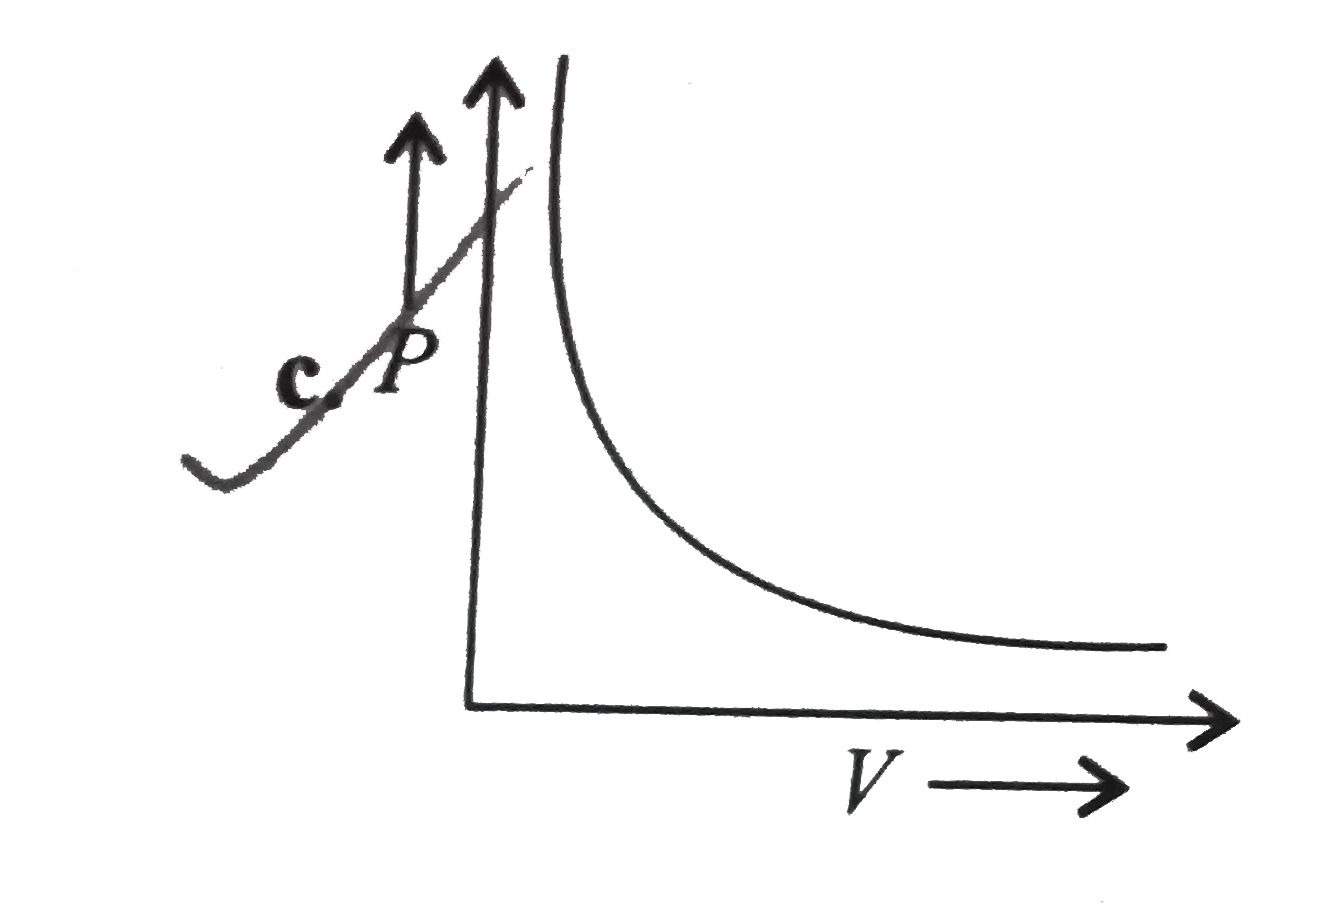
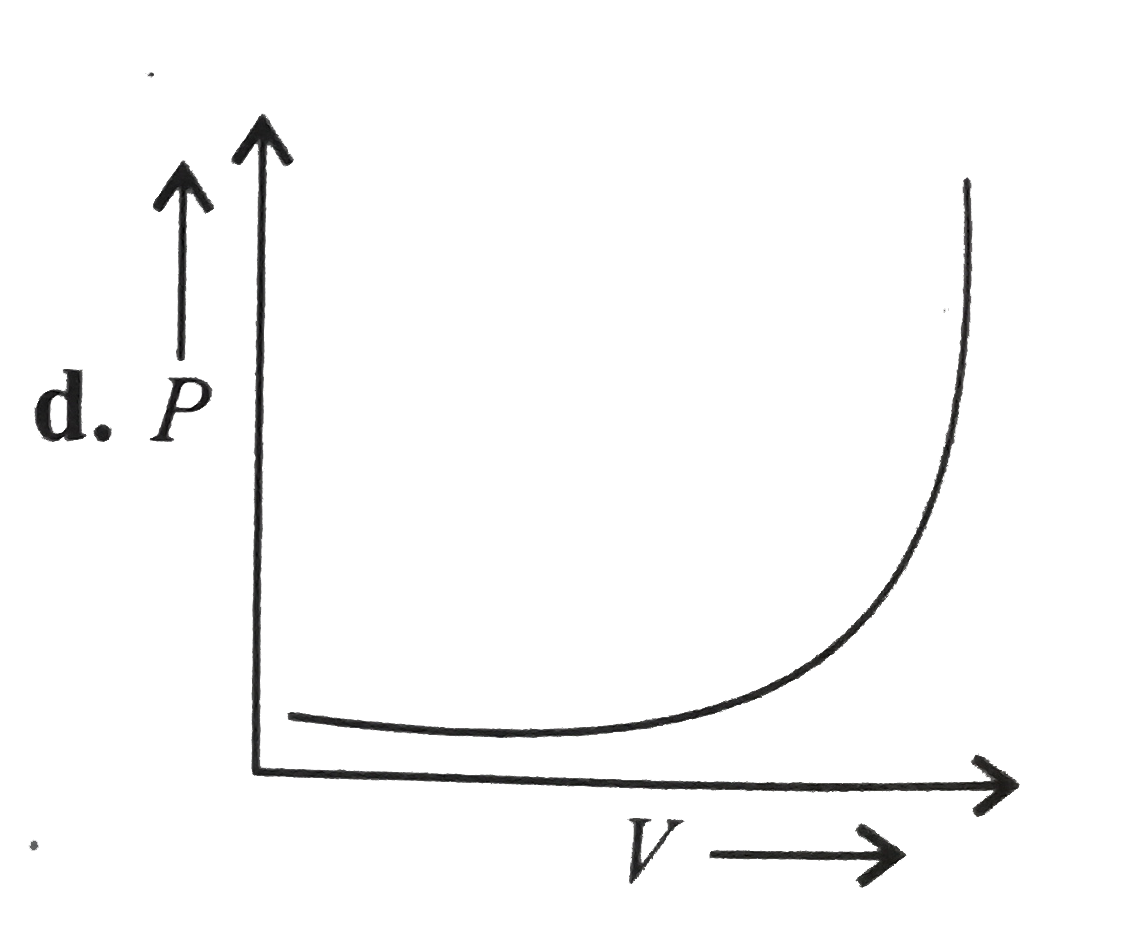
The graph betwene P and V at constant temperature should look like
A

B

C

D

Video Solution
Text Solution
P∝1V (Boyle's law)
|
Topper's Solved these Questions
Similar Questions
Knowledge Check
Graph between p and V at constant temperature is
AstraightBcurved increasingCstraight line with slopeDparabolic curve decreasingGraph between p and V at constant temperature is
AstraightBcurved increasingCstraight line with slopeDnone of theseSlope of the plot between V and P at constant temperature
AzeroB1C1//2D1√2
What is the type of graph between log P and log V at constant temperature?
View SolutionWhat is the type of graph between log P and log(1V) at constant temperature for a given amount of gas ?
View SolutionSingle option match maxtix :
Column-IColumn-II(A)(Vm−b)(P+aV2m)=RT(p)isotherm(B)R/N(q)Isobar(C)Molar volume(r)Equation for real gases(D)Graph between P and V at constant temperature(s)22.4litre at STP(E)Graph between V and T at constant pressure(t)Boltzmann's constant
View SolutionA student measures the focal length of a convex lens by putting an object pin at a distance u from the lens and measuring the distance v of the image pin. The graph between u and v plotted by the student should look like
View SolutionGraph between P & V below critical temperature is
View Solution
