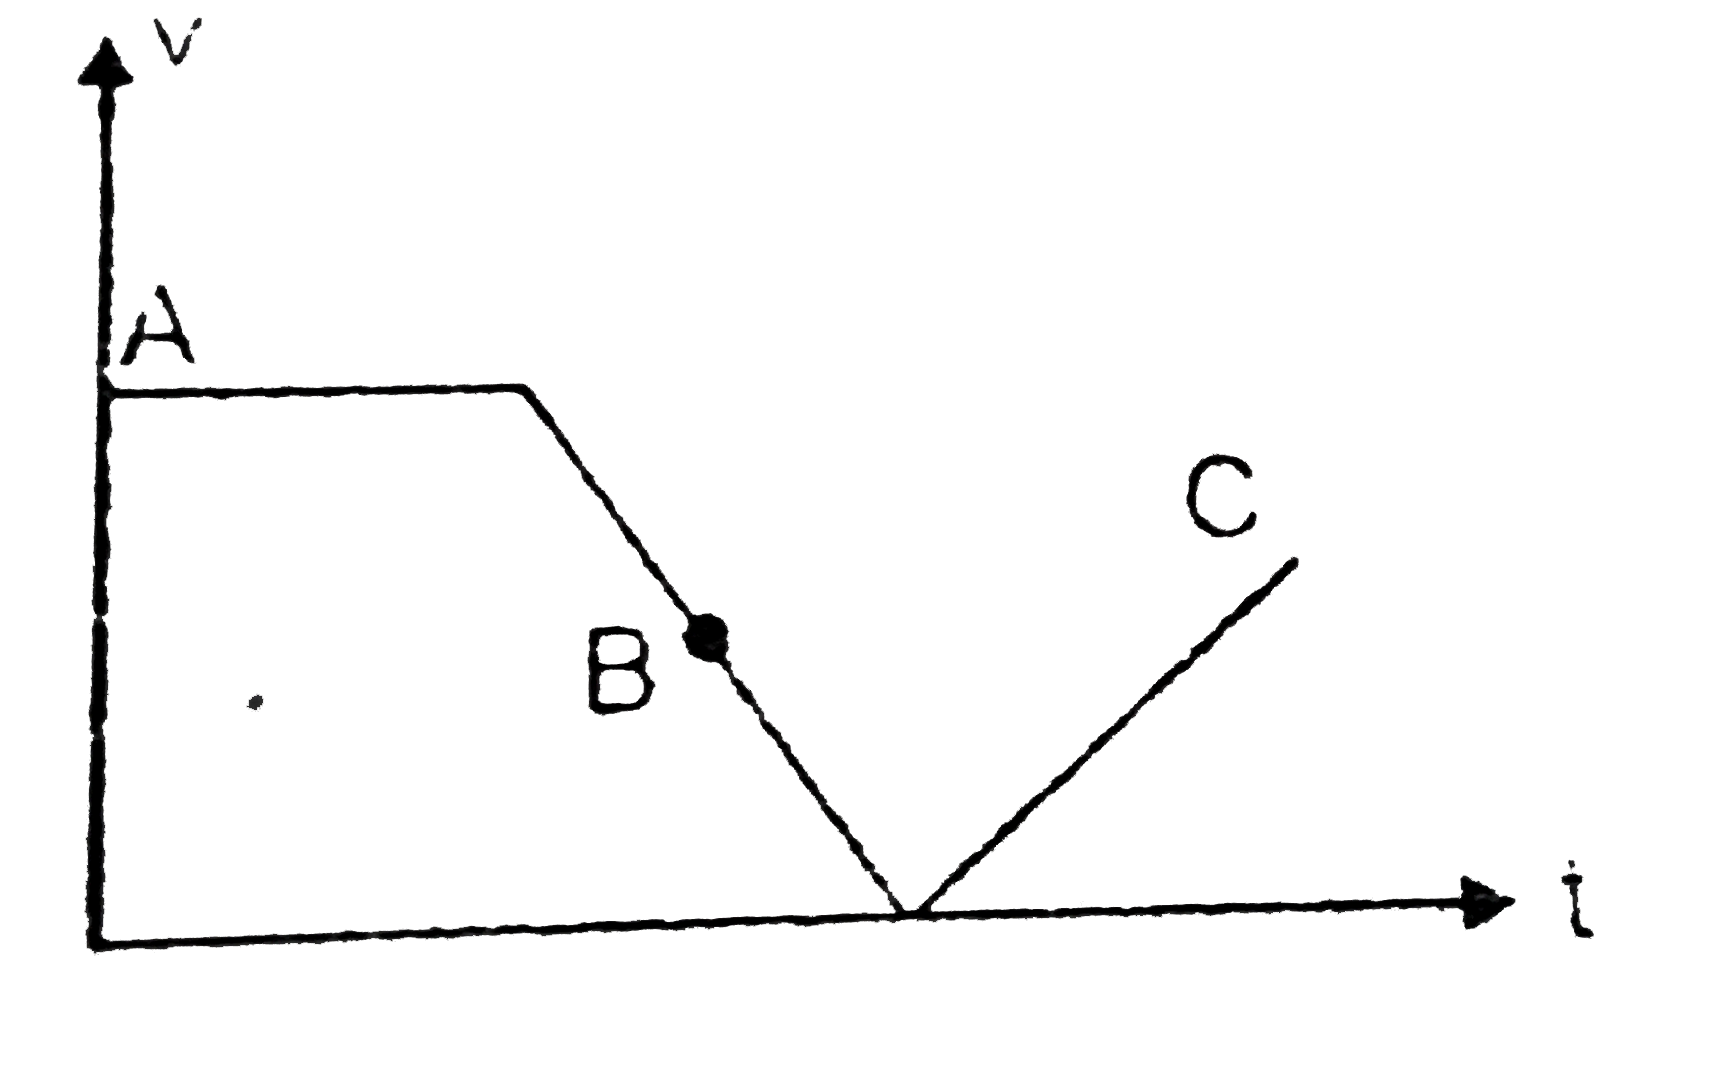
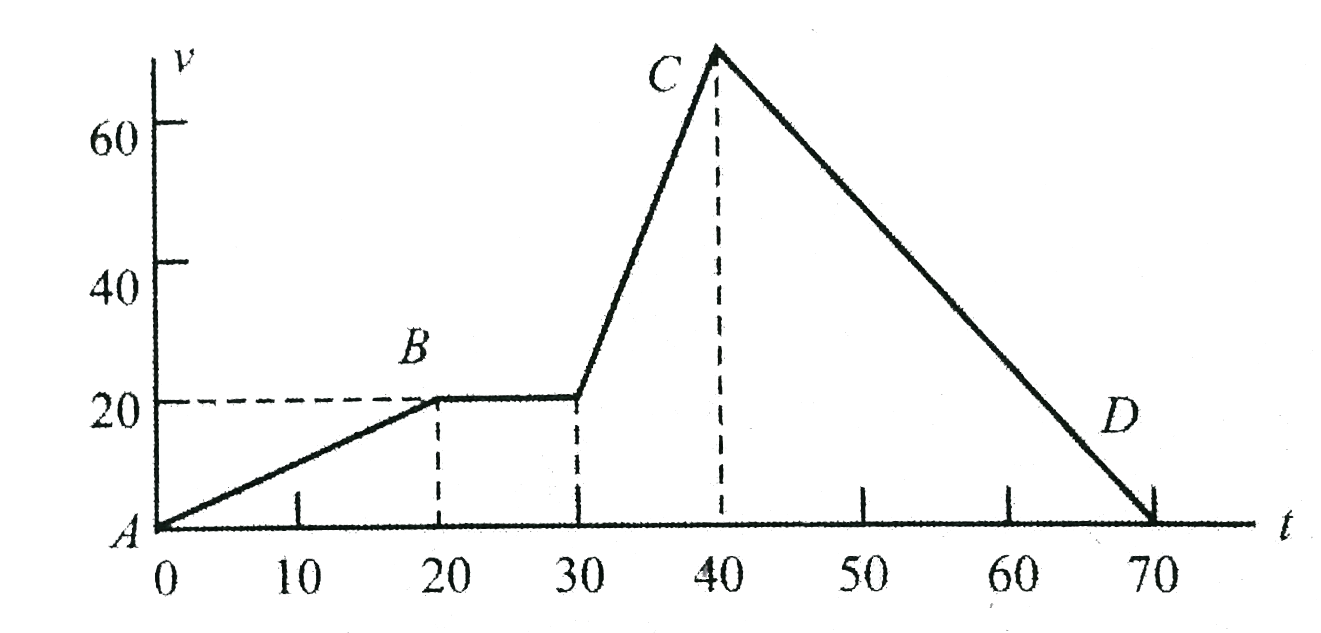
The velocity time curve of a moving point is shown in Fig. Find the retardation of the particle for the porion CD.
 .
.
4ms−2
2ms−2
3ms−2
6ms−2
The correct Answer is:B
The slope of the velocity-time graph represents acceleration or positive, it represents accelecration and if the slope is negatitve, positive, it represents acceleation and if the slope is negative, it represents retardation. The section CD of the graphe retesebts retardation and magnitude of retardtion is
|→a|=Chan≥∈veloityTimetaken=60(70−40)=2ms−2.
Topper's Solved these Questions
- BOOK - CENGAGE PHYSICSCHAPTER - KINEMATICS-1EXERCISE - Solved Examples9videos
KINEMATICS-1
- BOOK - CENGAGE PHYSICSCHAPTER - KINEMATICS-1EXERCISE - Exercise 4.117videos
KINEMATICS-1
- BOOK - CENGAGE PHYSICSCHAPTER - GRAVITATIONEXERCISE - INTEGER_TYPE1videos
GRAVITATION
- BOOK - CENGAGE PHYSICSCHAPTER - KINEMATICS-2EXERCISE - Exercise Integer9videos
KINEMATICS-2
Similar Questions
Knowledge Check
- Question 1 - Select One
velocity time graph of a particle is shown in figure. Find displacement of the particle.
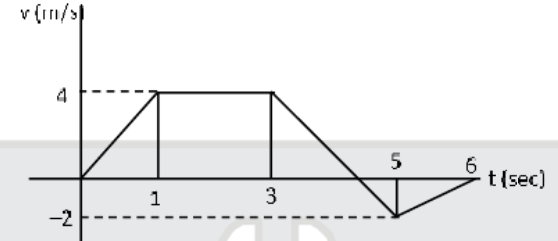 A7B11C5D15
 - Question 2 - Select One
The displacement time curve of a particle is shown in the figure. The external force acting on the particle is :
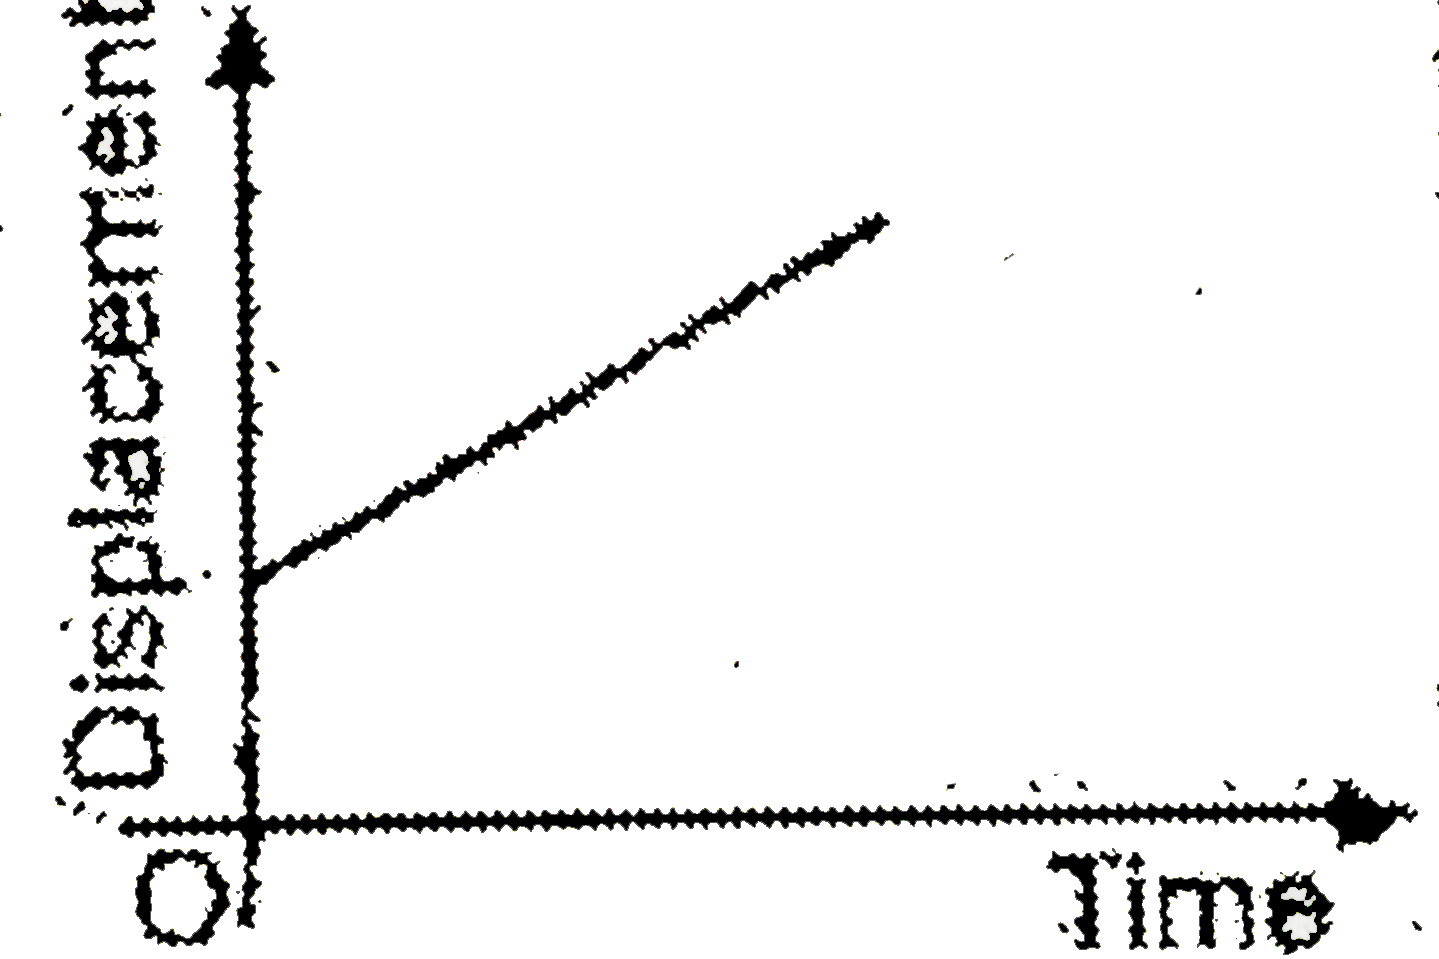 AActing at the beginning part of motionBZeroCNot zeroDNone of these
 - Question 3 - Select One or More
The velocity time plot for a particle moving on straight line is shown in the figure.
 AThe particle has a constant accelerationBThe particle has nevedr turned aroundCThe paeticle has zero displacement.DThe average speed in the interval 0 to 10 s is the same as the average speed in the interval 10 s to 20s.
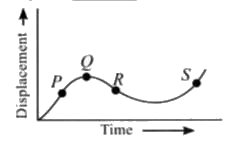
The displacement-time graph of a moving particle is shown in the figure. The velocity of the particle is zero at the point ______.
 View Solution
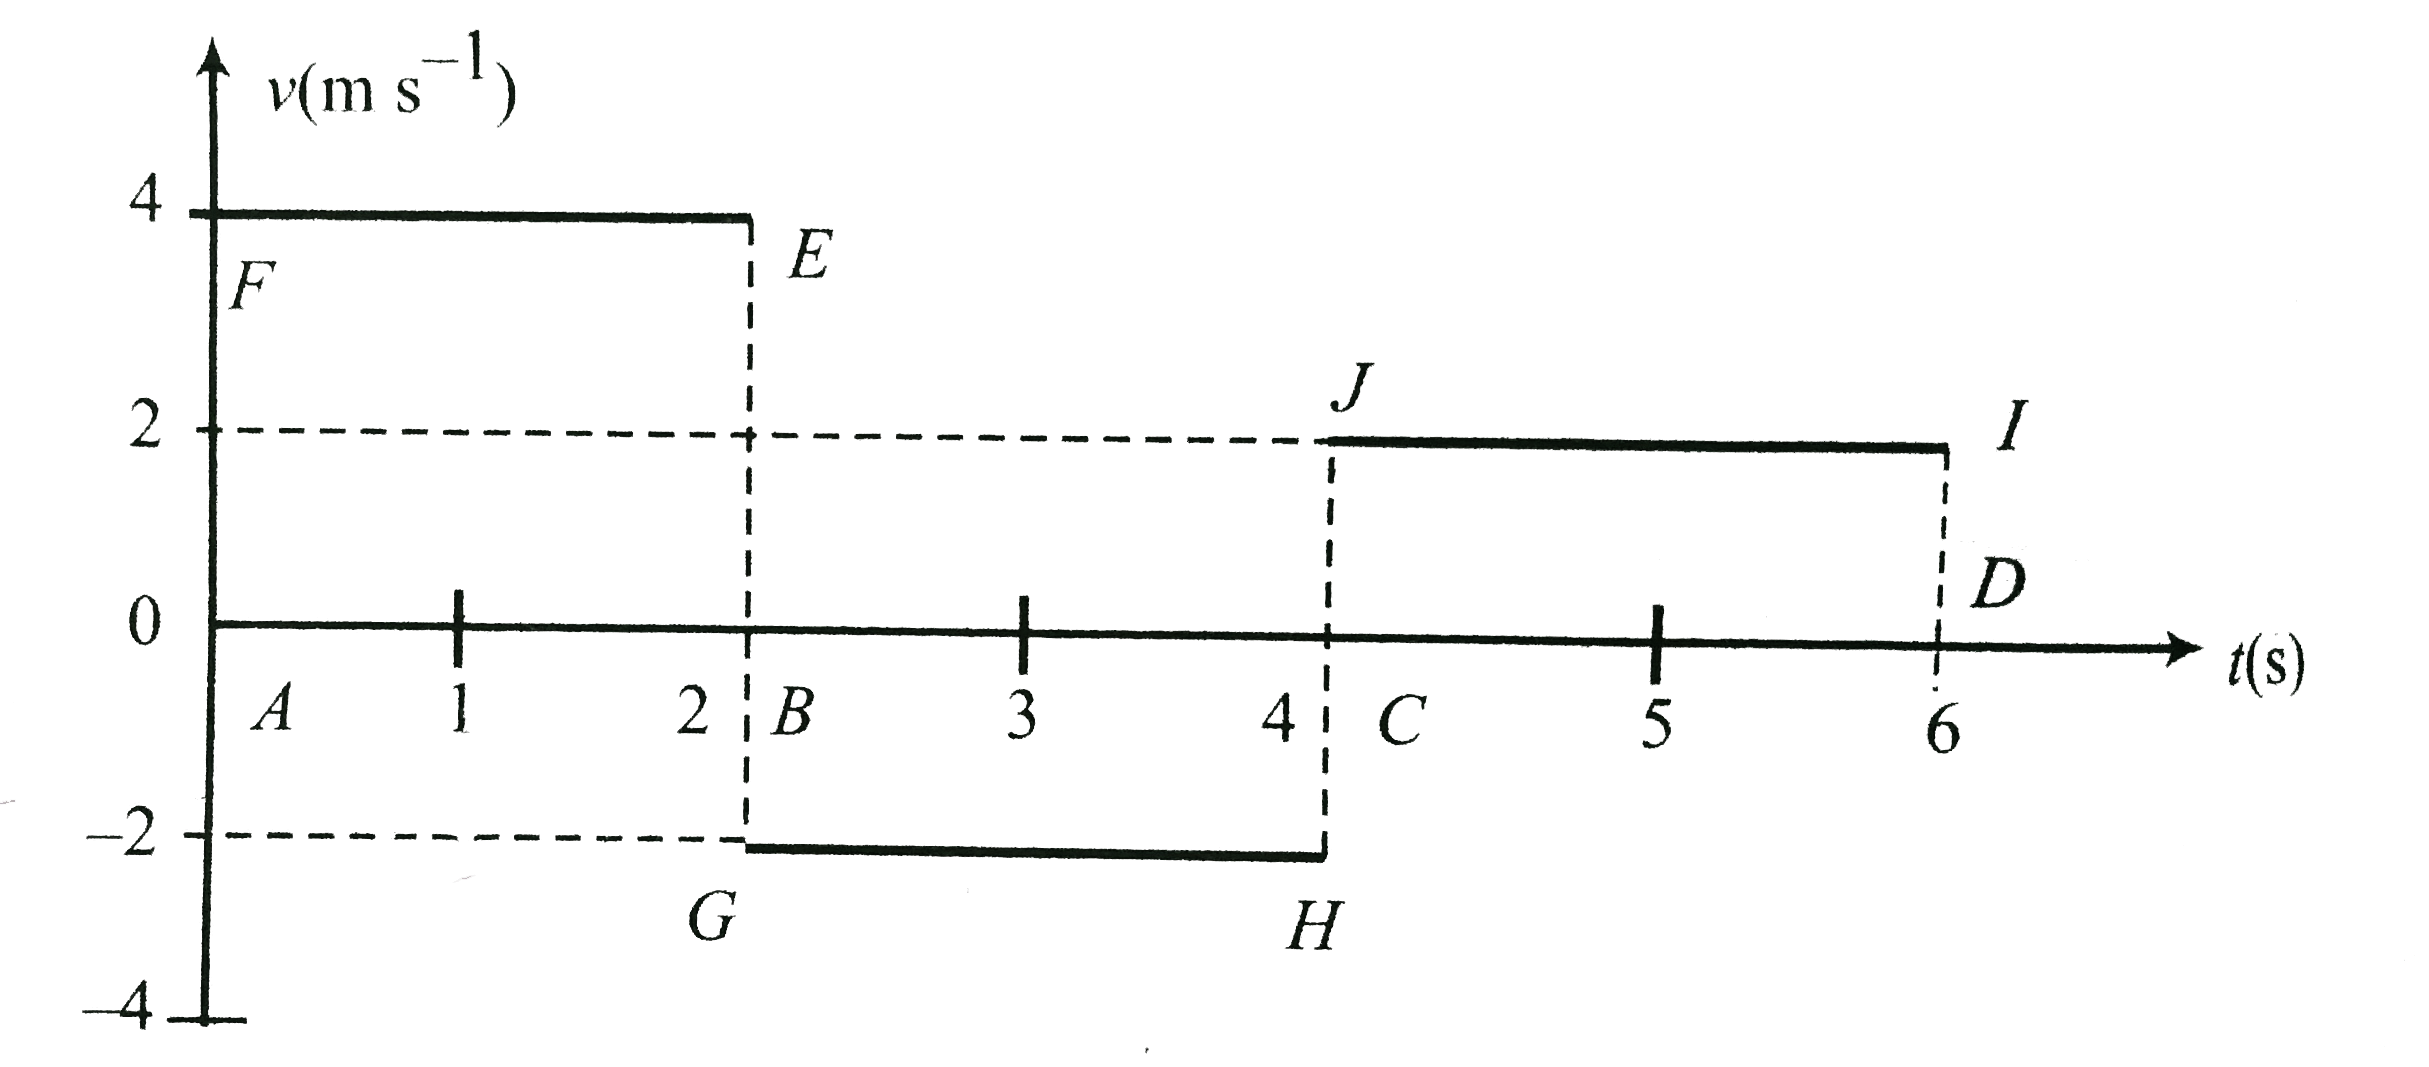
The velocity-time graph of a particle moving in a staight line is shown in the . Find the displacement and the distance trav elled by the particle in 6s.
 .View Solution
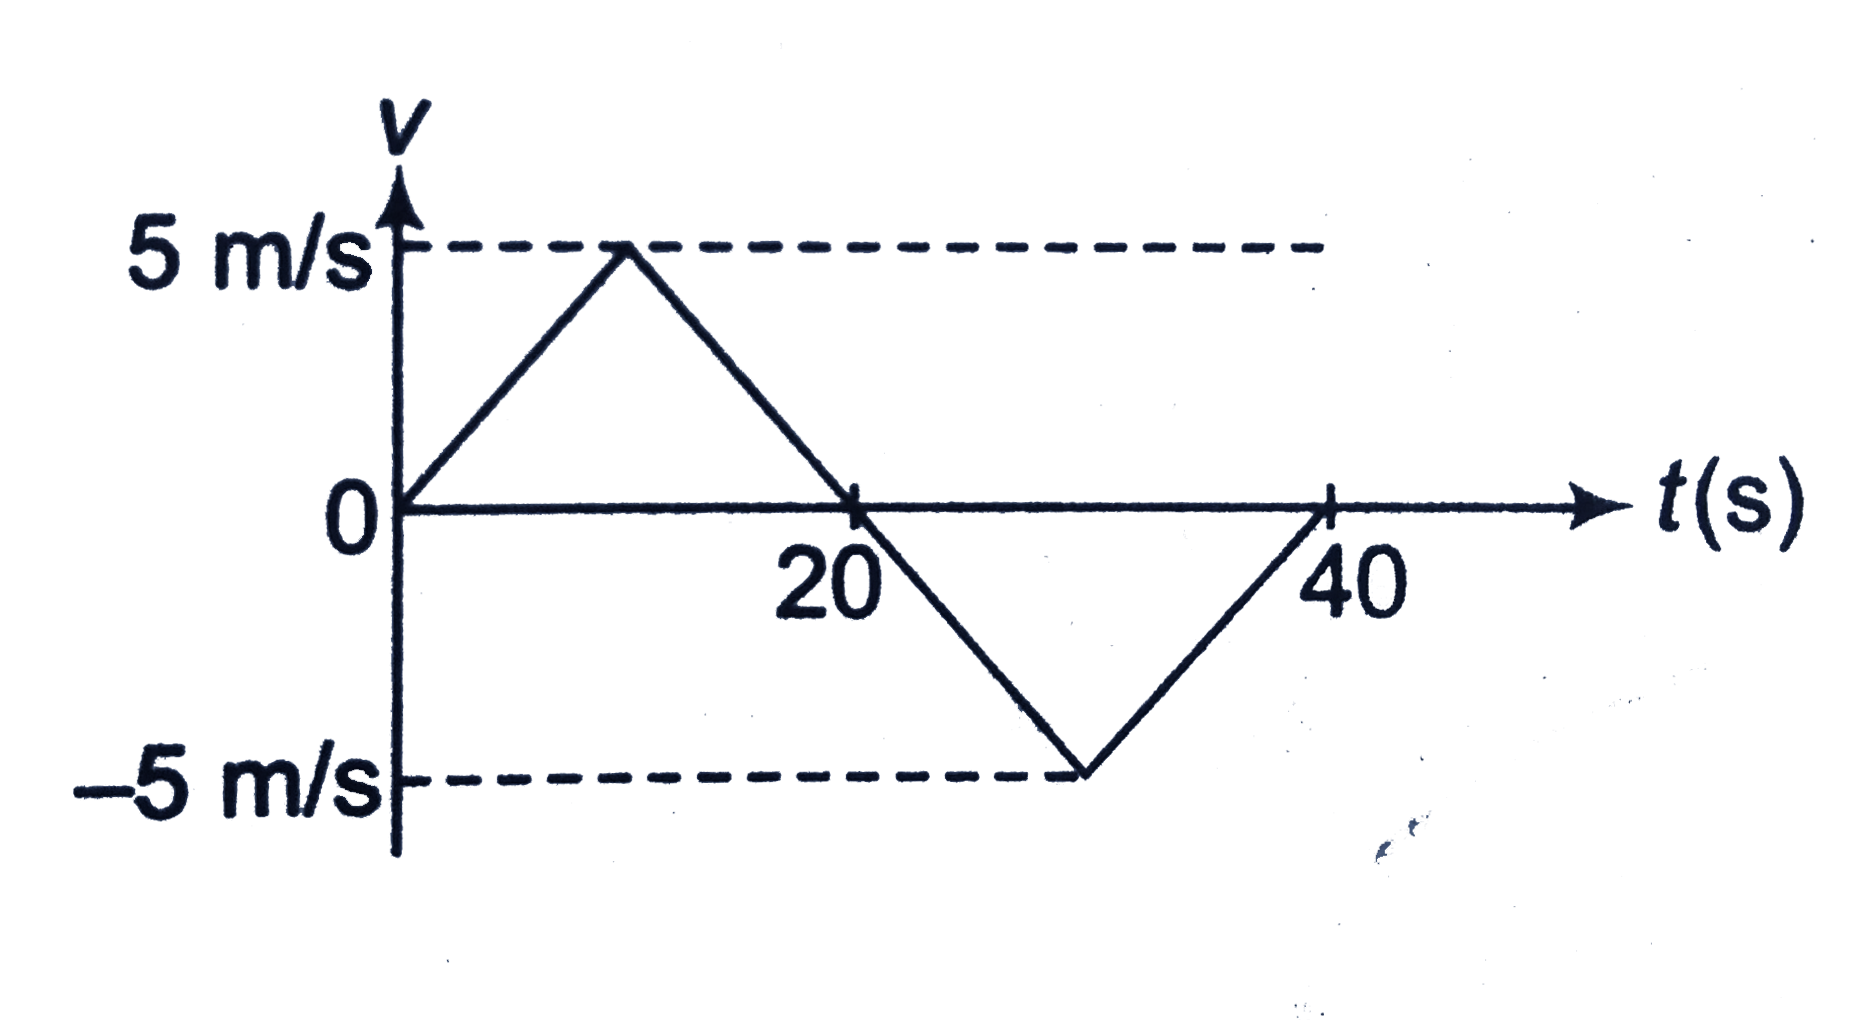
From the velocity-time plot shown in Fig. find the distance travelled by the particle during the first 40s. Also find the average velocity during this period.
 View Solution
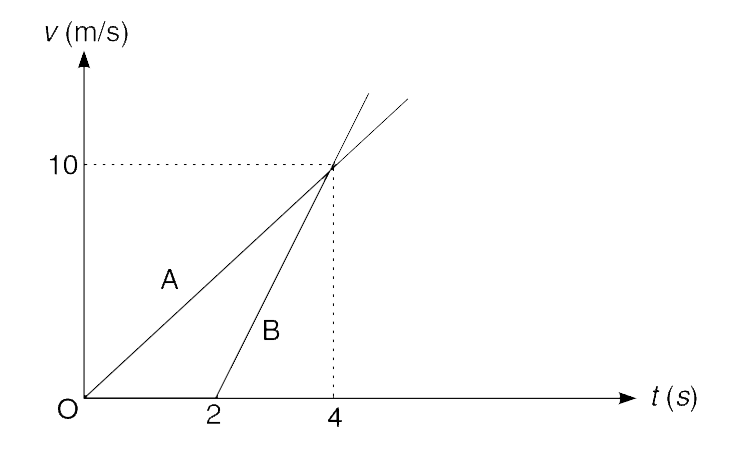
Two particles A and B start from same point and move along a straight line. Velocity-time graph for both of them has been shown in the fig. Find the maximum separation between the particles in the interval 0<t<5 sec.
 View Solution
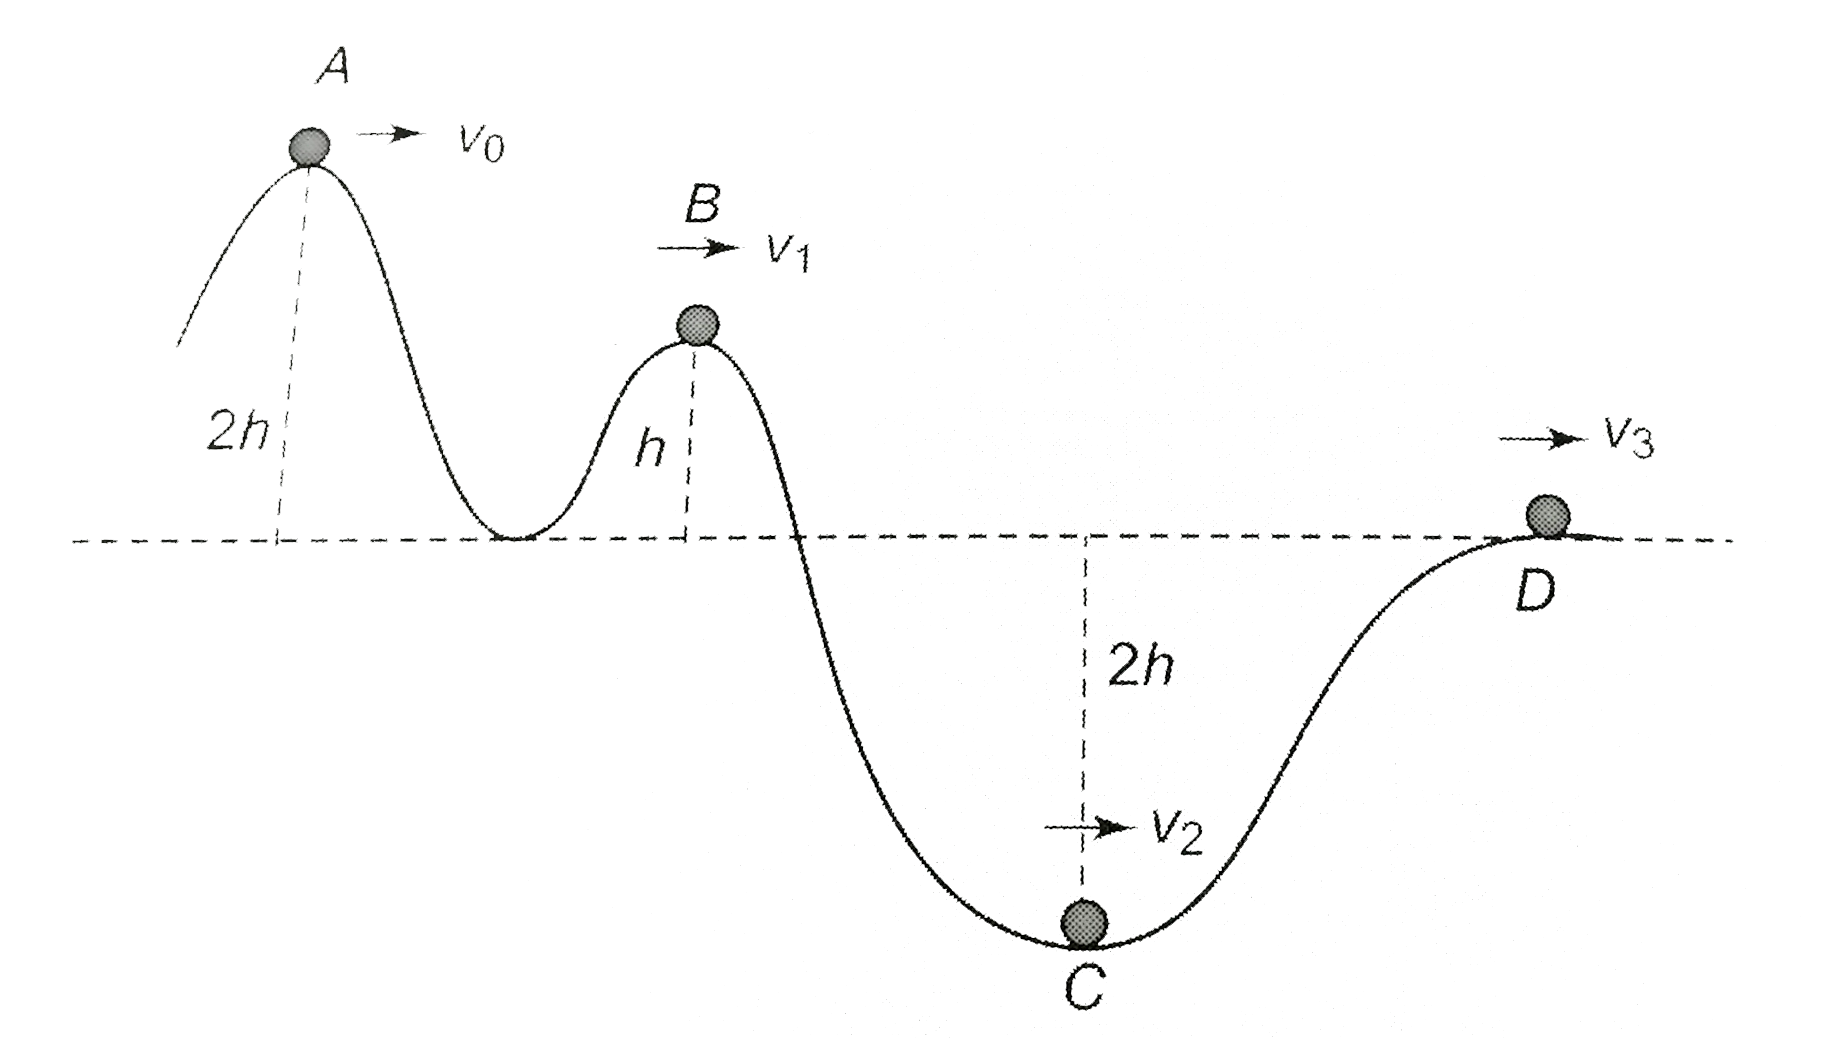
A particle is given velocity v0 at point A as shown in the figure. Find the speed of particle at point B,C and DView Solution


