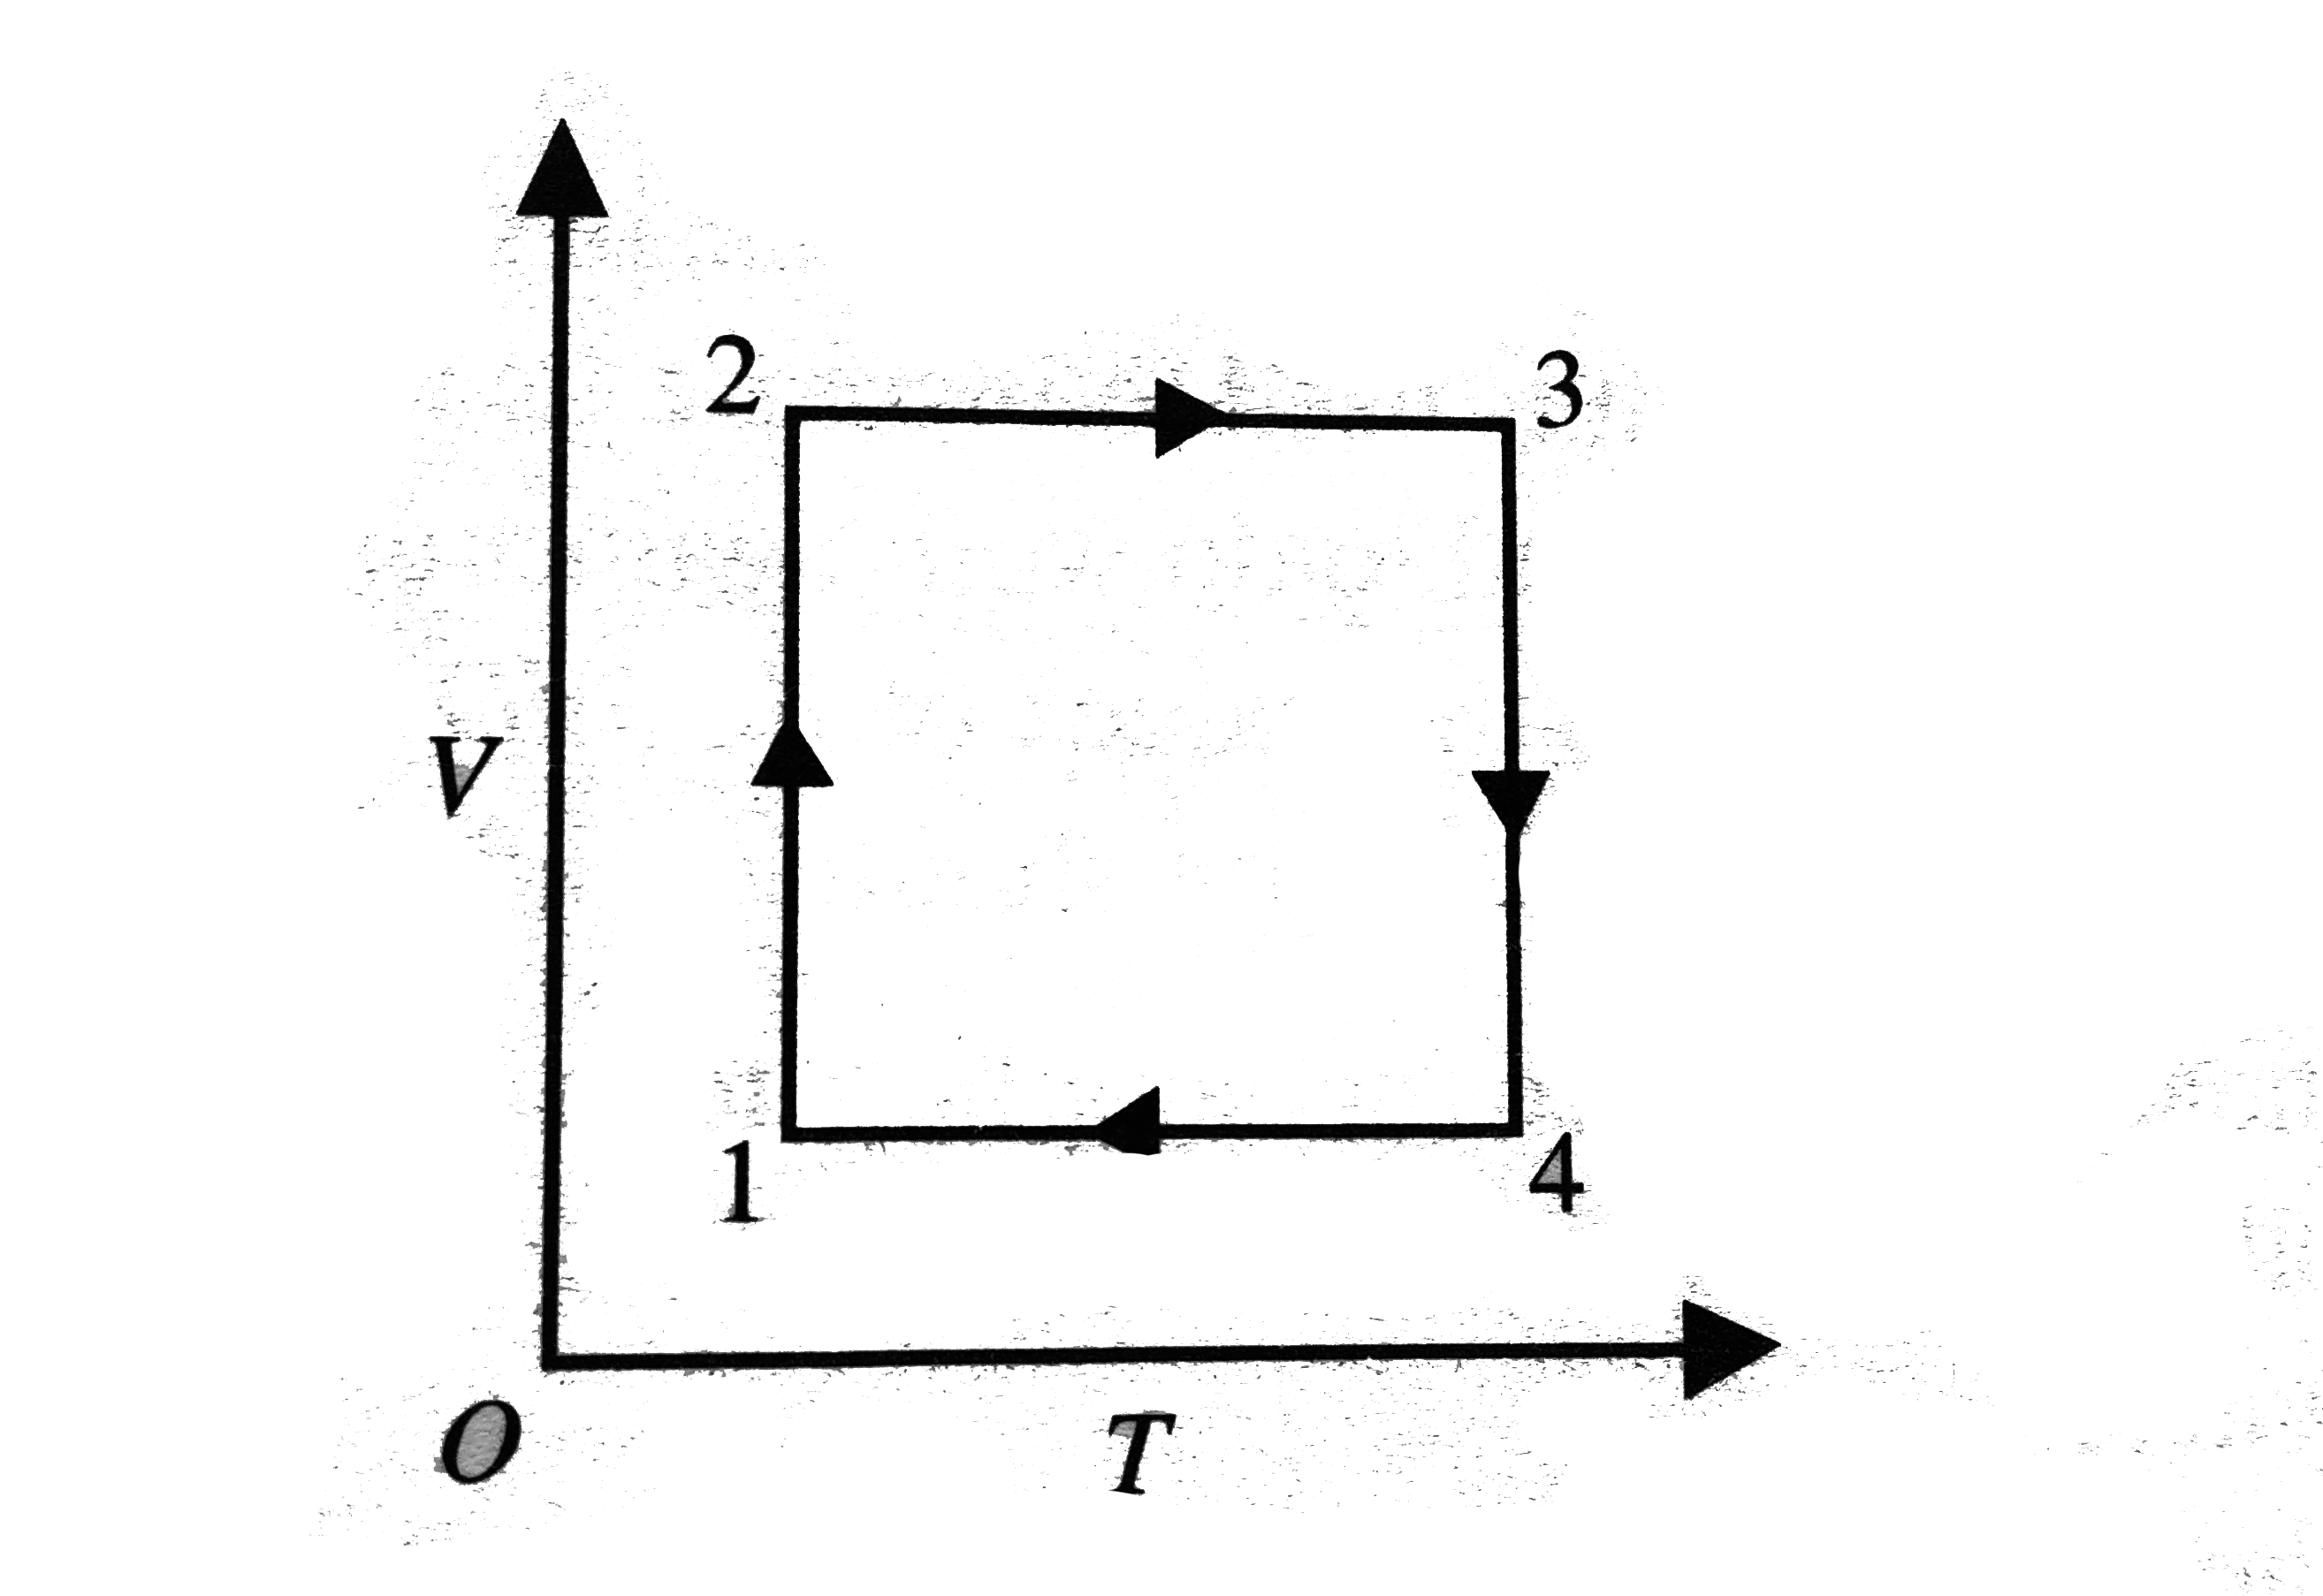
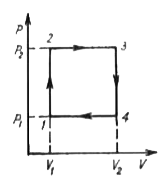
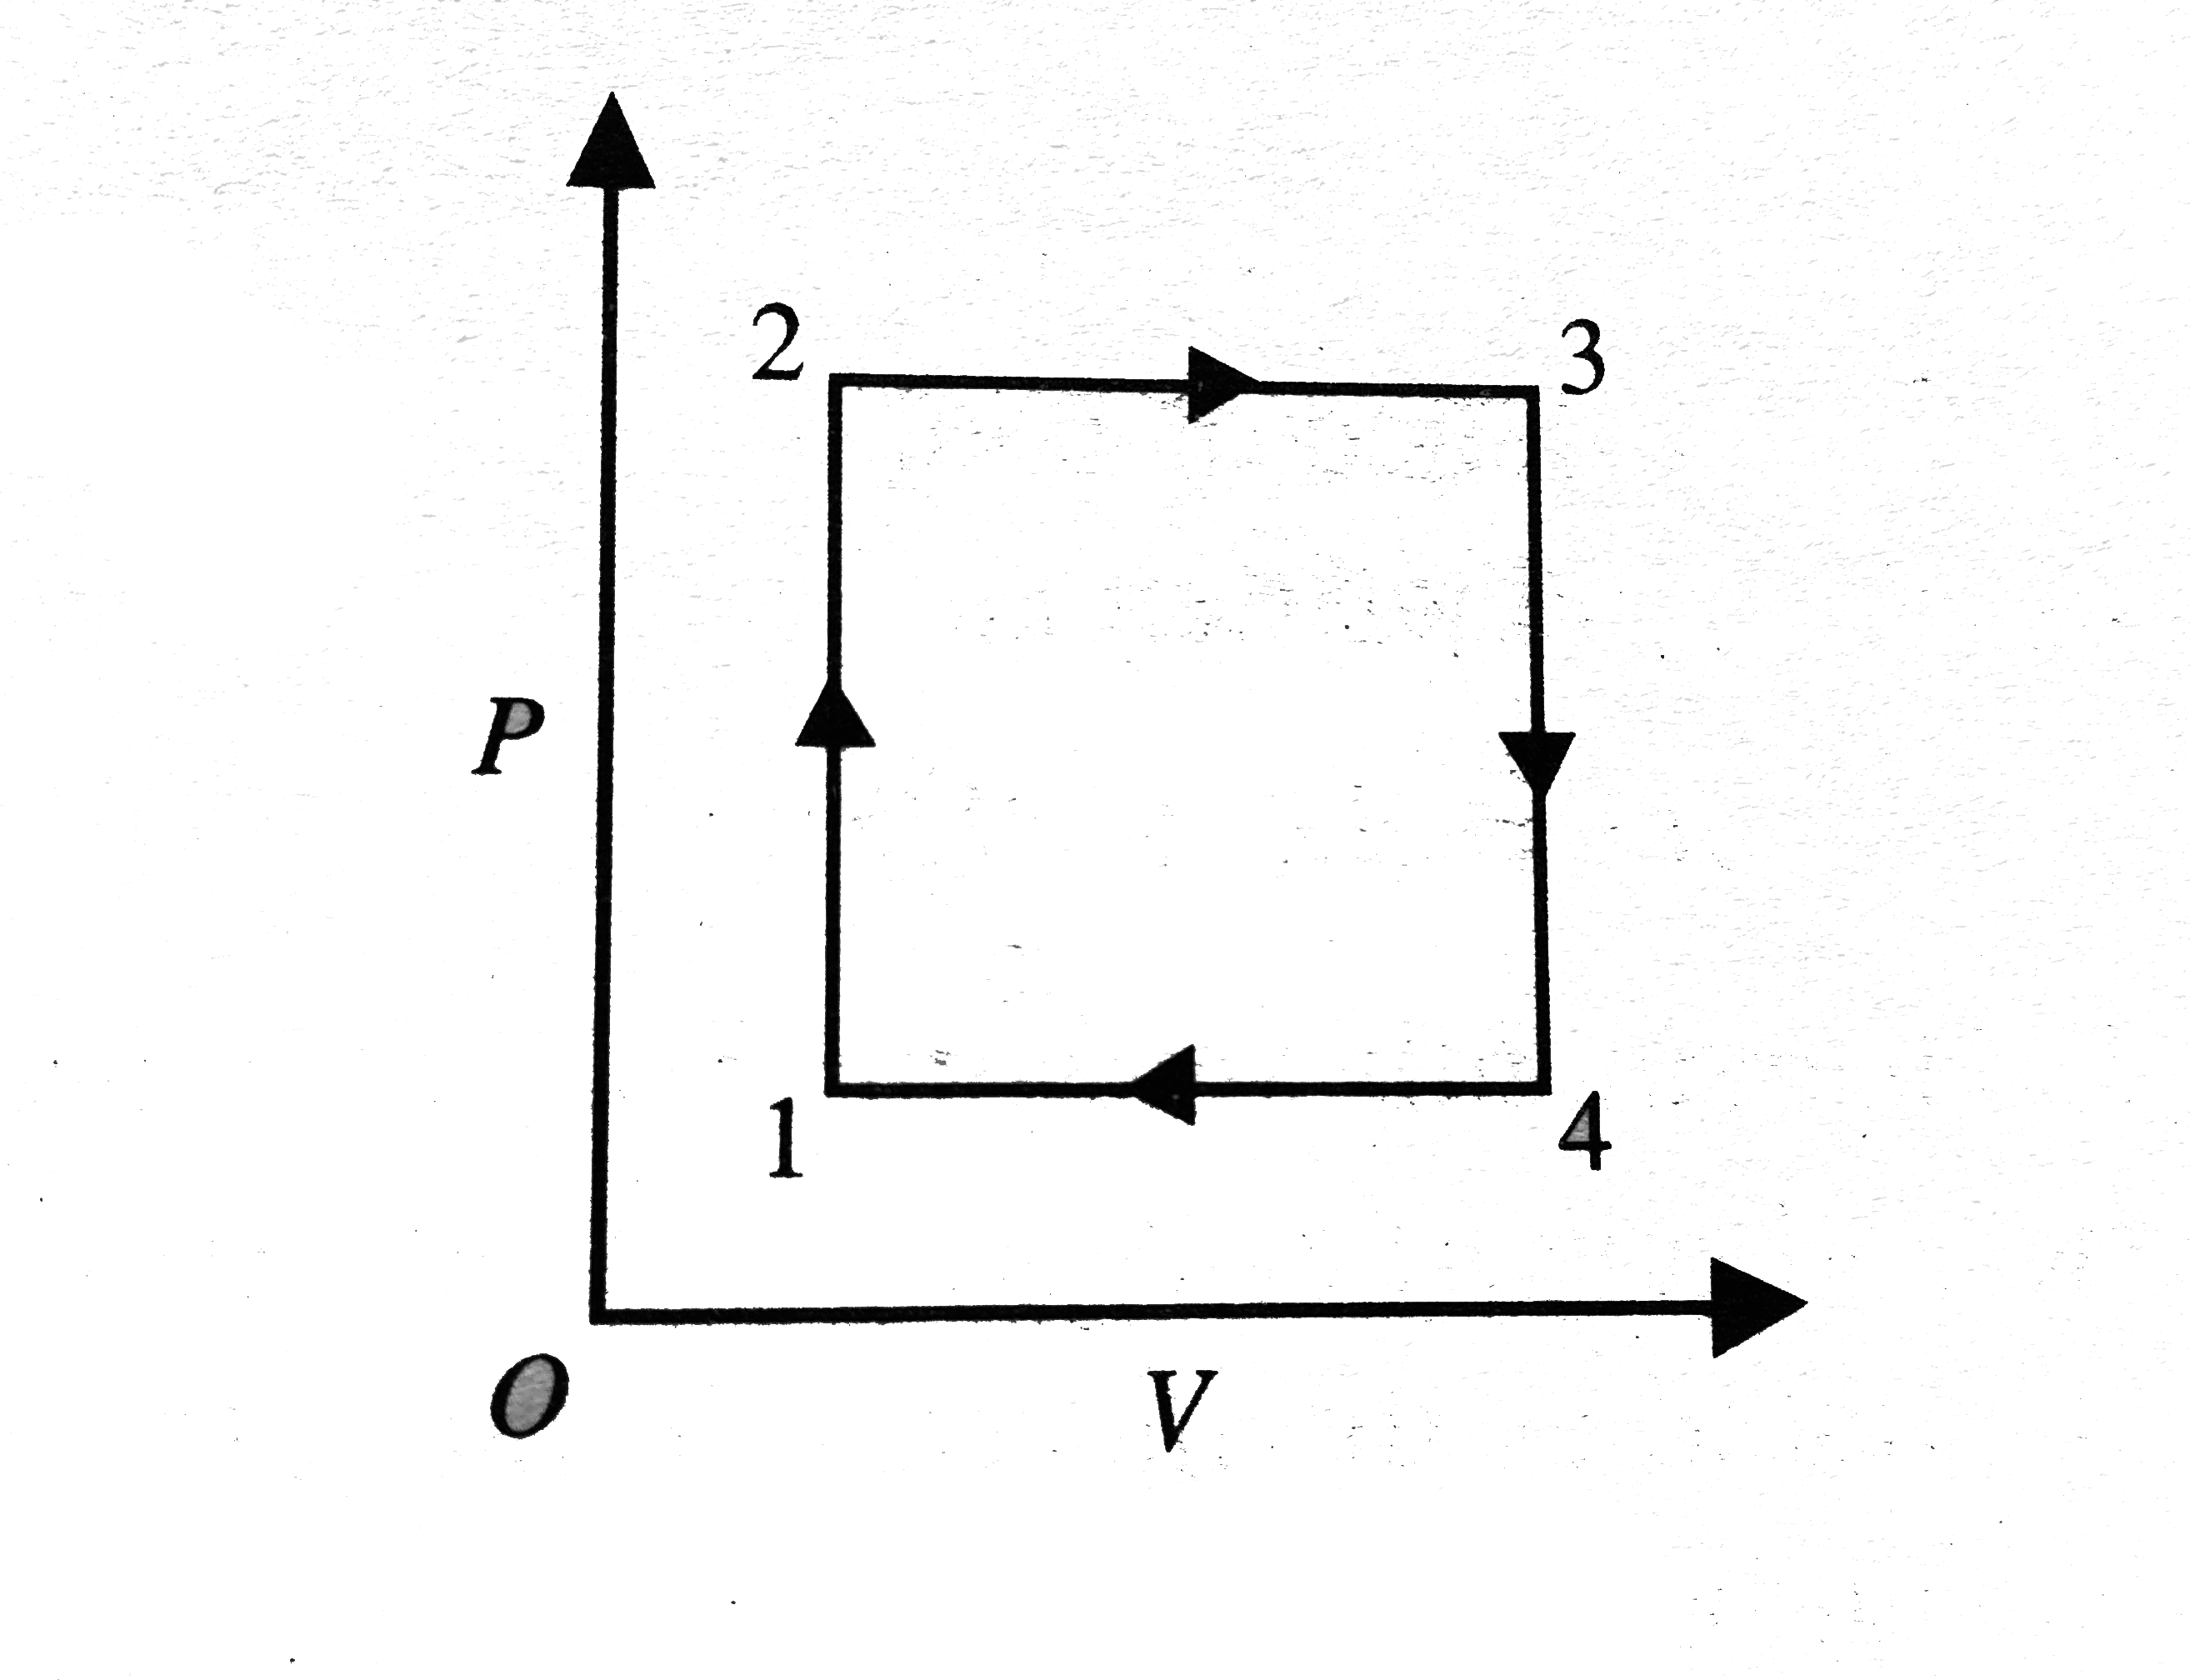
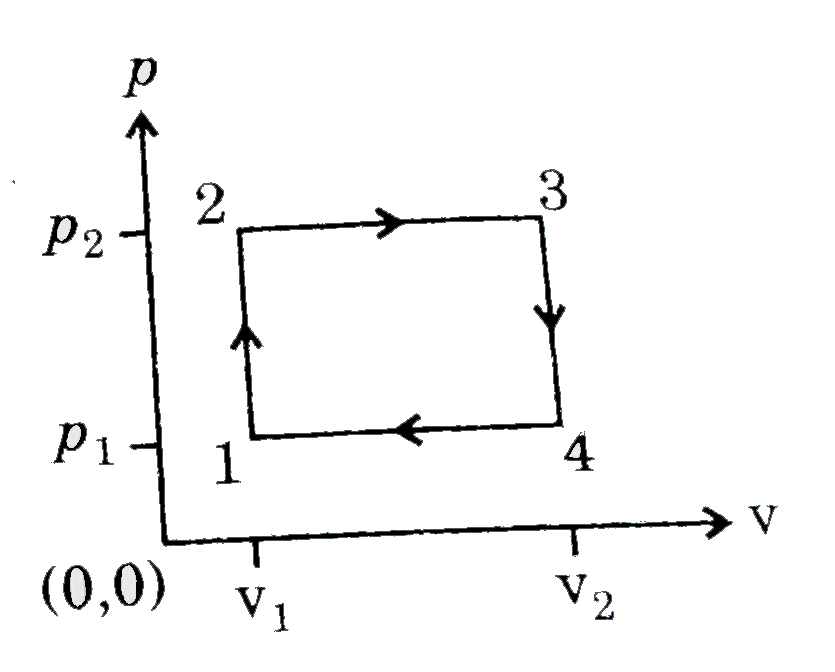
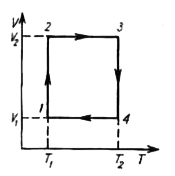
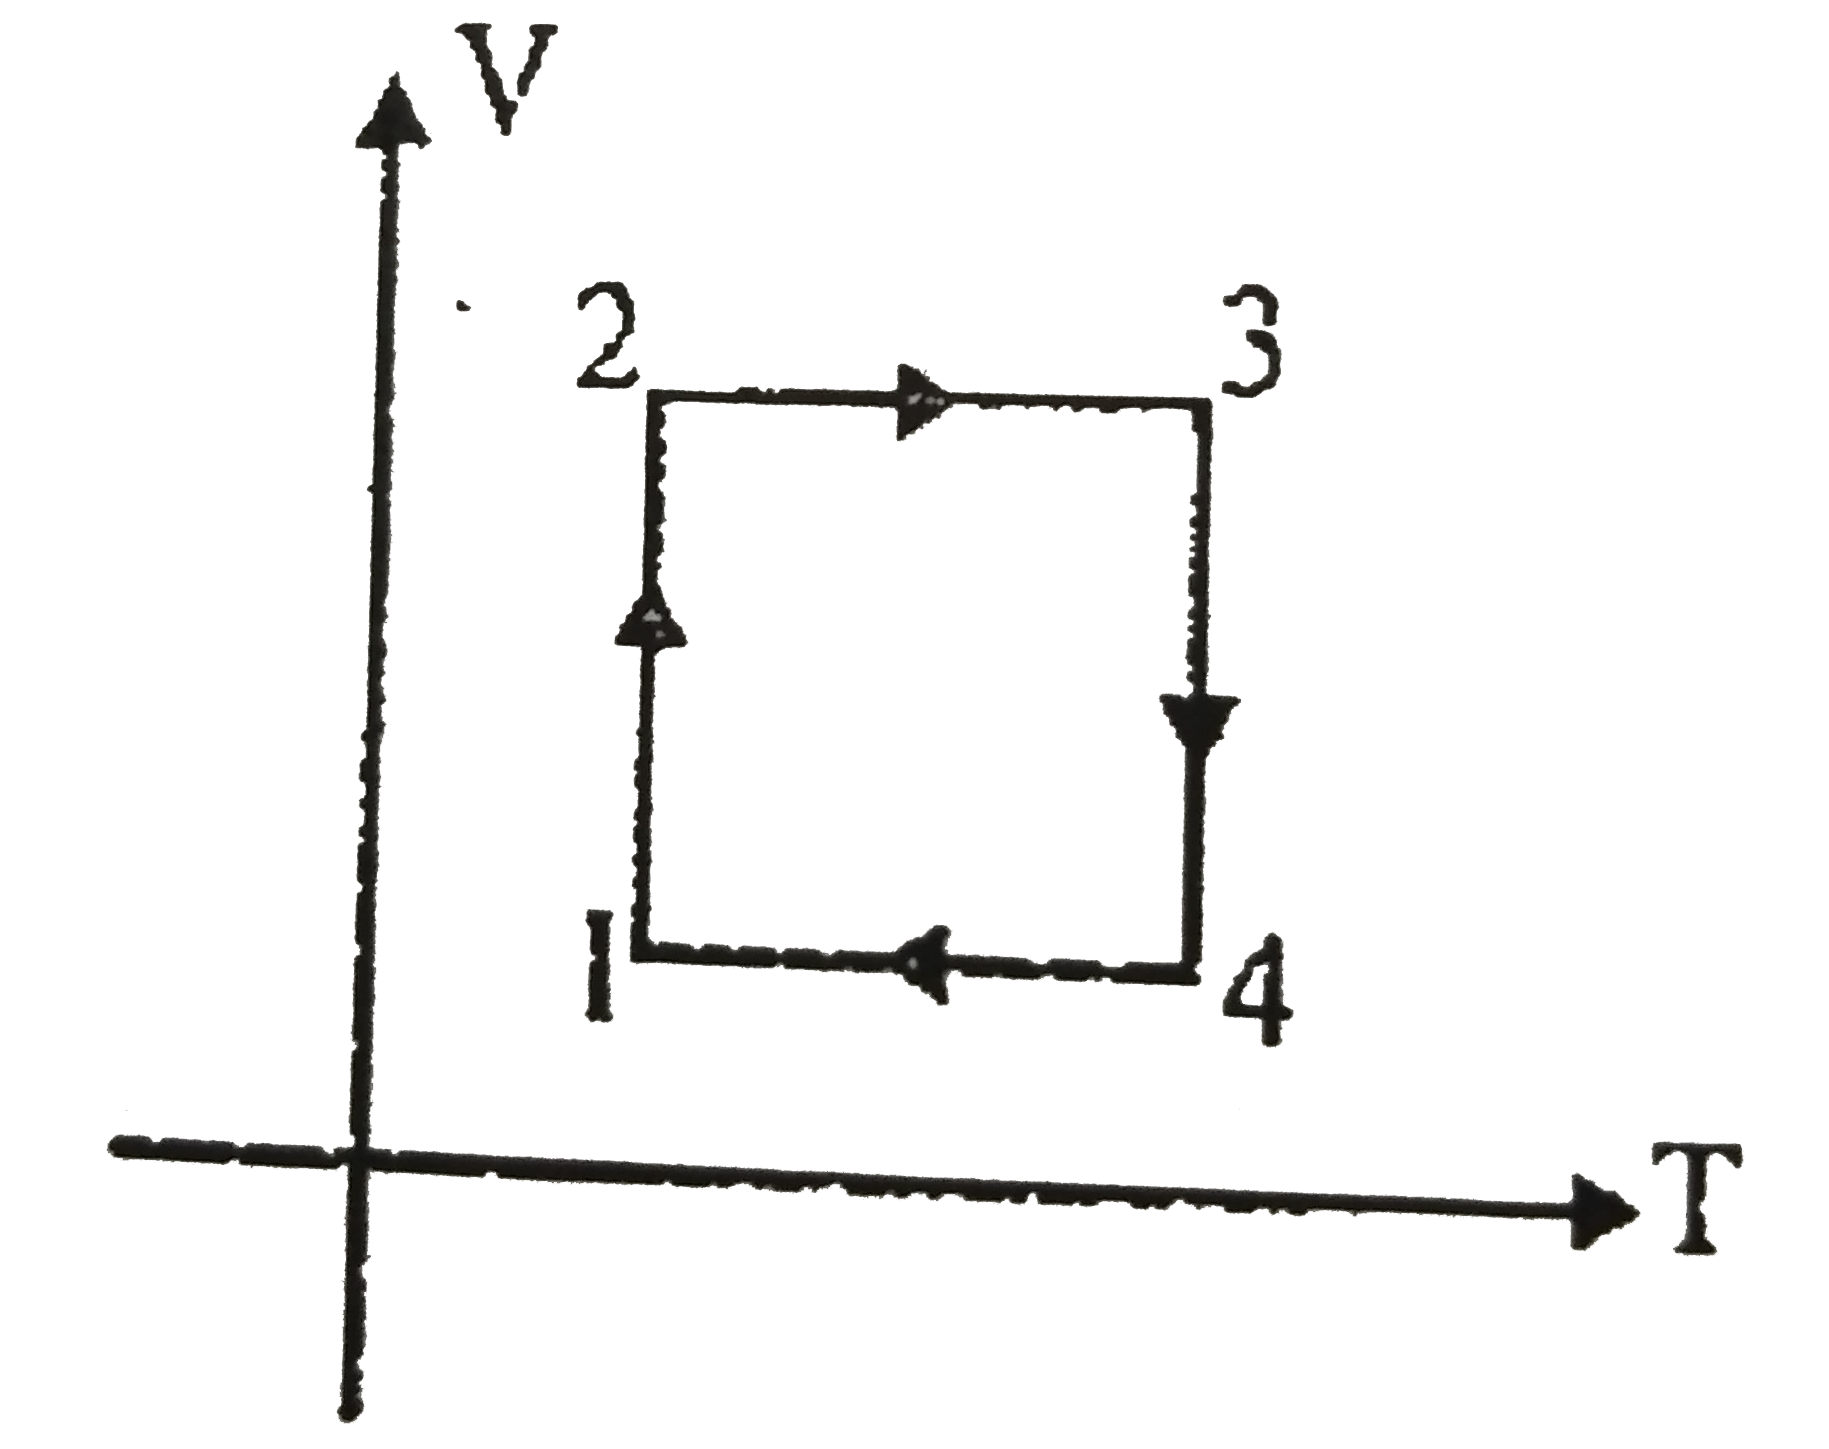
A gas has been subjected to isochoric-isobaric processes 1-2-3-4-1 see Fig. Plot this process on T - V and P - T diagrams.
Video Solution
Text Solution
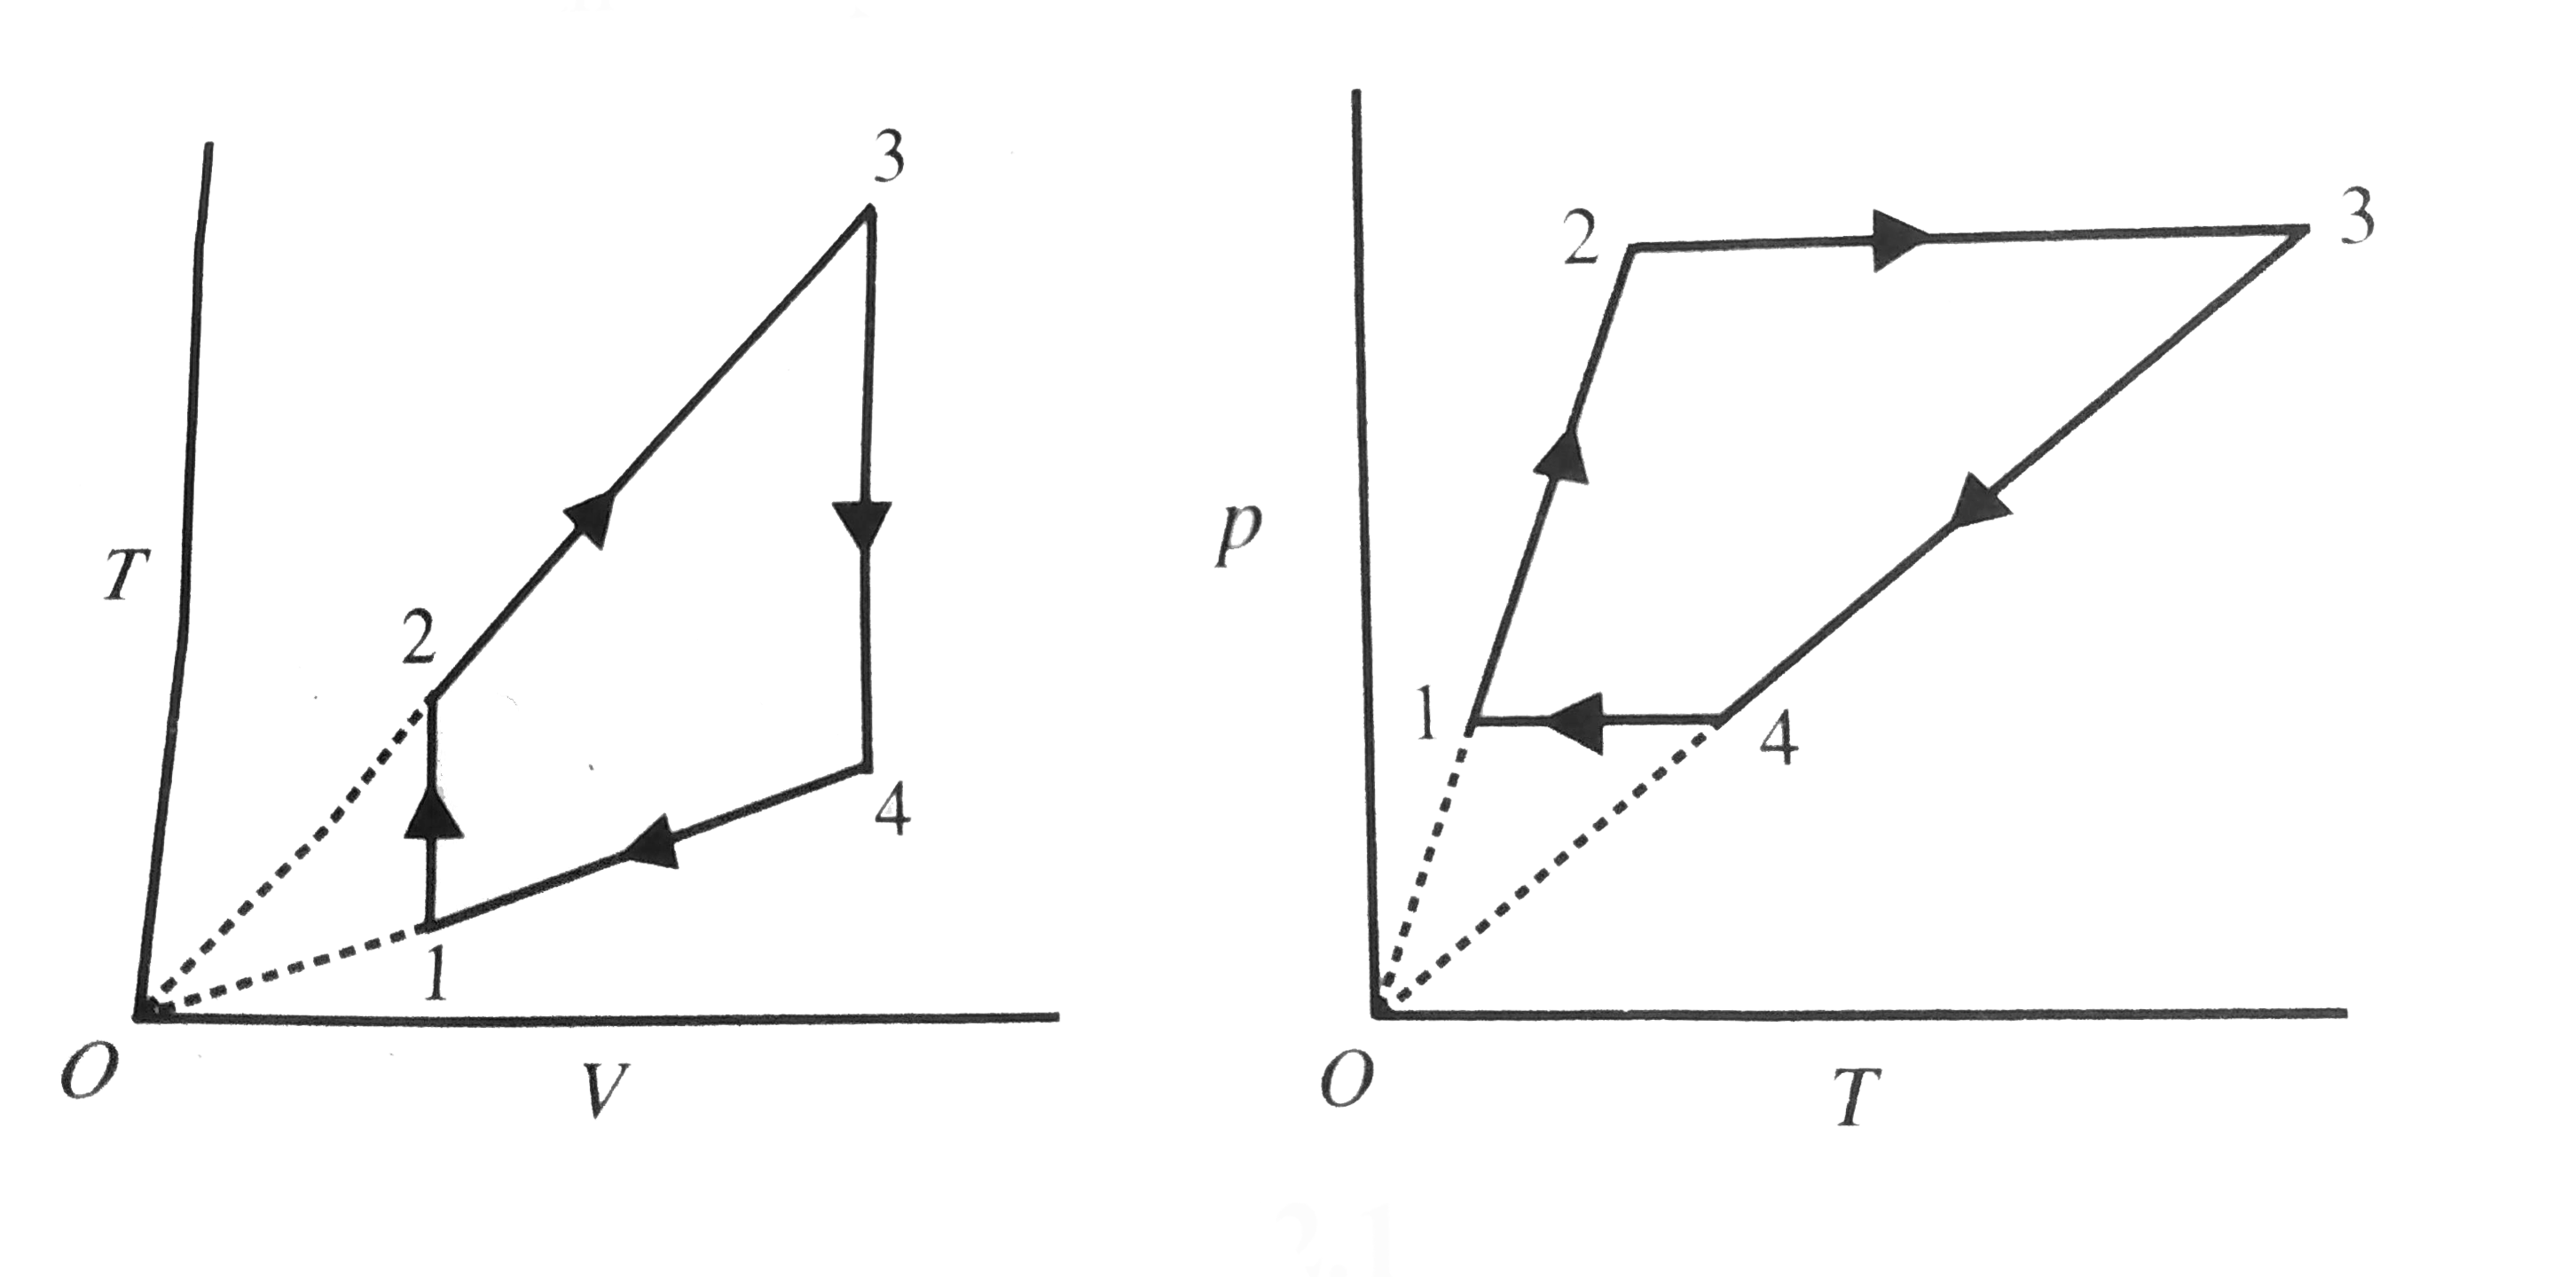
The plot is shown in Fig.
Explanation: Since remains constant, the plot of against is a straight line parallel to the .
For an ideal gas . So when remains constant, . Hence the plot of against is a straight line passing through the origing. The same is repected fro and . The plot of against is shown in the figure and can be explained similarly.
|
Topper's Solved these Questions
- KINETIC THEORY OF GASES AND FIRST LAW OF THERMODYNAMICSBook:CENGAGE PHYSICSChapter:KINETIC THEORY OF GASES AND FIRST LAW OF THERMODYNAMICSExercise:Exercise 2.2
Explore 28 Videos
- KINETIC THEORY OF GASES AND FIRST LAW OF THERMODYNAMICSBook:CENGAGE PHYSICSChapter:KINETIC THEORY OF GASES AND FIRST LAW OF THERMODYNAMICSExercise:Subjective
Explore 22 Videos
- KINETIC THEORY OF GASES AND FIRST LAW OF THERMODYNAMICSBook:CENGAGE PHYSICSChapter:KINETIC THEORY OF GASES AND FIRST LAW OF THERMODYNAMICSExercise:Solved Examples
Explore 14 Videos
- KINETIC THEORY OF GASESBook:CENGAGE PHYSICSChapter:KINETIC THEORY OF GASESExercise:Compression
Explore 2 Videos
- LINEAR AND ANGULAR SIMPLE HARMONIC MOTIONBook:CENGAGE PHYSICSChapter:LINEAR AND ANGULAR SIMPLE HARMONIC MOTIONExercise:Multiple Correct Answer Type
Explore 9 Videos
Similar Questions
Knowledge Check
A gas has been subjected to an isochoric and isobaric cycle. Plot of the graph of this cycle in the pressure-density, V-T and P-T co-ordinates are given below. Choose the correct plots.
 A
A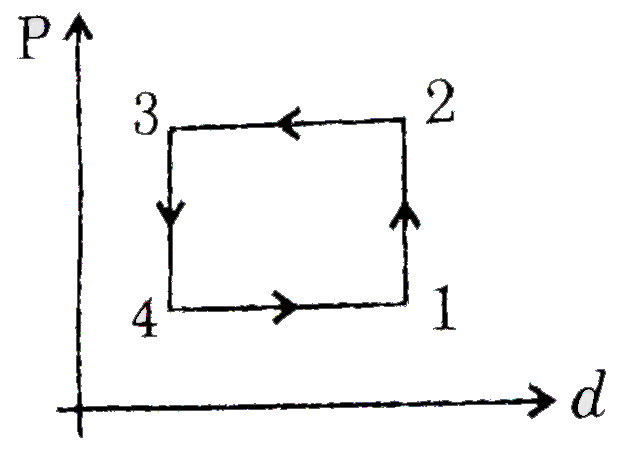 B
B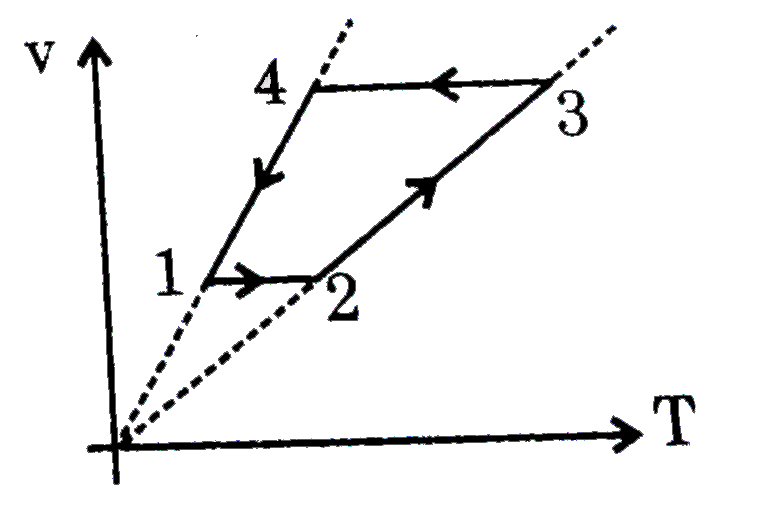 C
C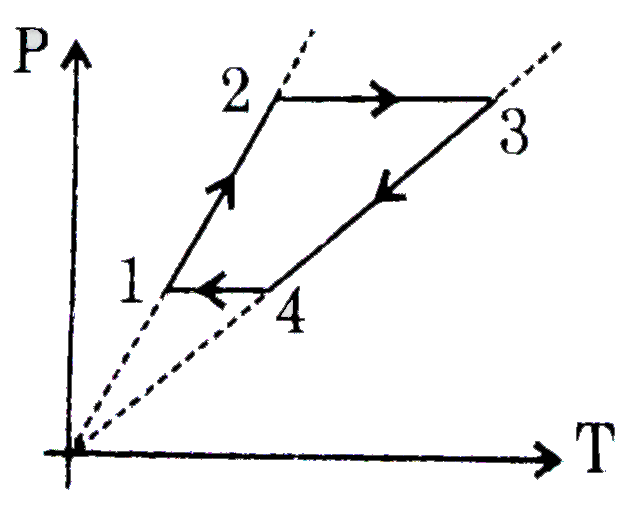 DNone of these
A gas has been subjected to isothermal-isochoric cycle 1-2-3-4-1 (Fig.). Plot the graph of this cycle in p−V,p−ρ, and p-T coordinates.
View SolutionA gas has been subjected to a cycle of isochoric, isothermal process 1-2-3-4-1 as shown in the figure. The graph for this cycle on P-T diagram is
View SolutionDraw at P-T curve for isochoric process.
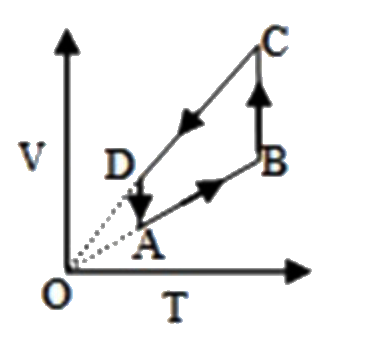
View SolutionA cyclic process is shown on the V - T diagram . The same process on a P - T diagram is shown by
View SolutionDraw at P-T curve for isobaric process.
View SolutionDraw at P-T curve for isobaric process.
View SolutionDraw at P-T curve for isochoric process.
View Solution
