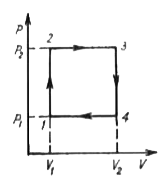
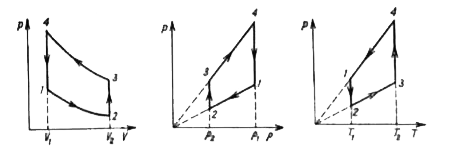
A gas has been subjected to isothermal-isochoric cycle 1-2-3-4-1 (Fig.). Plot the graph of this cycle in p−V,p−ρ, and p-T coordinates.
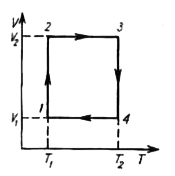
The cycles are shown in Figs.
Similar Questions
Knowledge Check
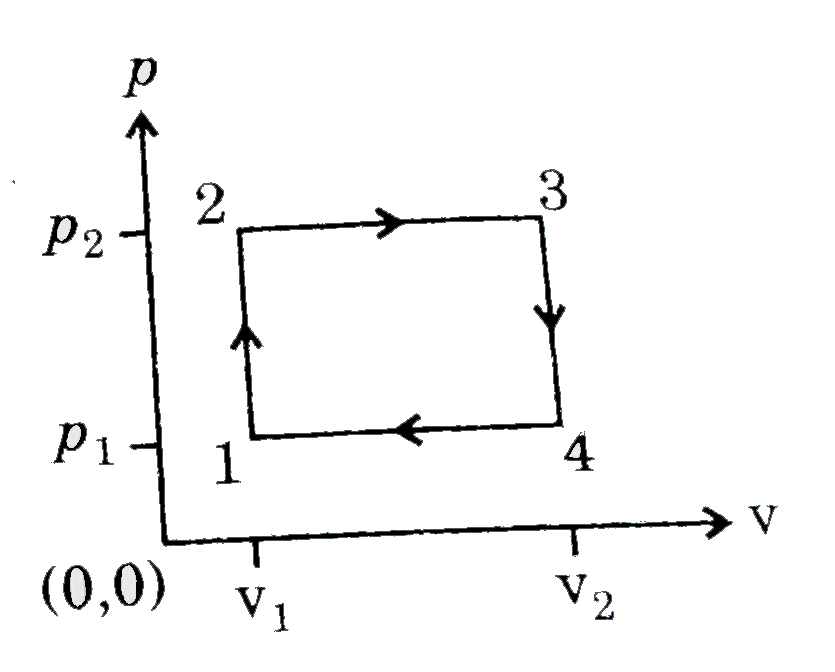
A gas has been subjected to an isochoric and isobaric cycle. Plot of the graph of this cycle in the pressure-density, V-T and P-T co-ordinates are given below. Choose the correct plots.
 A
A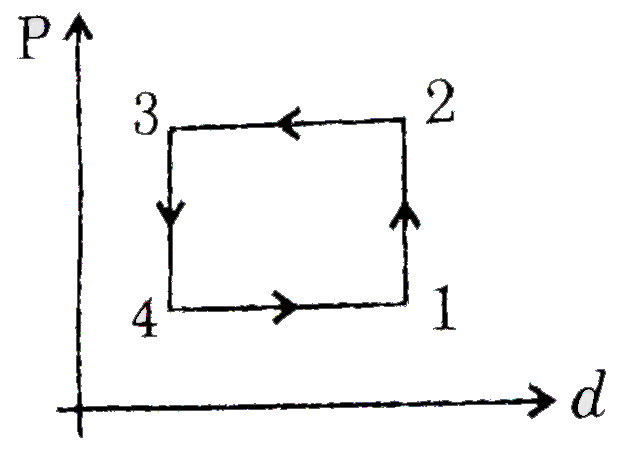 B
B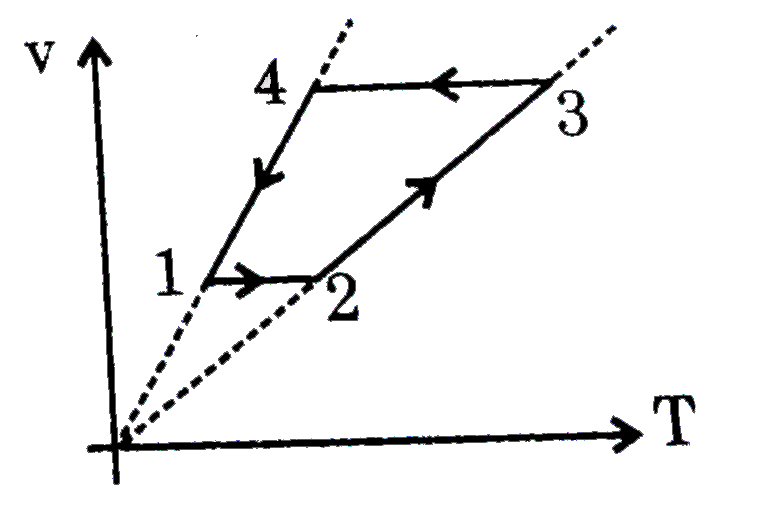 C
C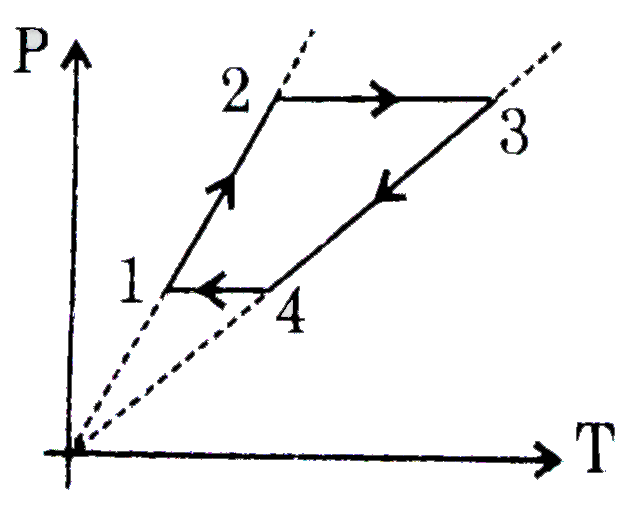 DNone of these
The slope of P-V graph for isochoric process is
AZeroBInfiniteCOneDTwo
A gas has been subjected to an isothermal-isochromic cycle 1-2-3-4-1 see Fig. Represent the same cycle on P - V and P - T diagrams.
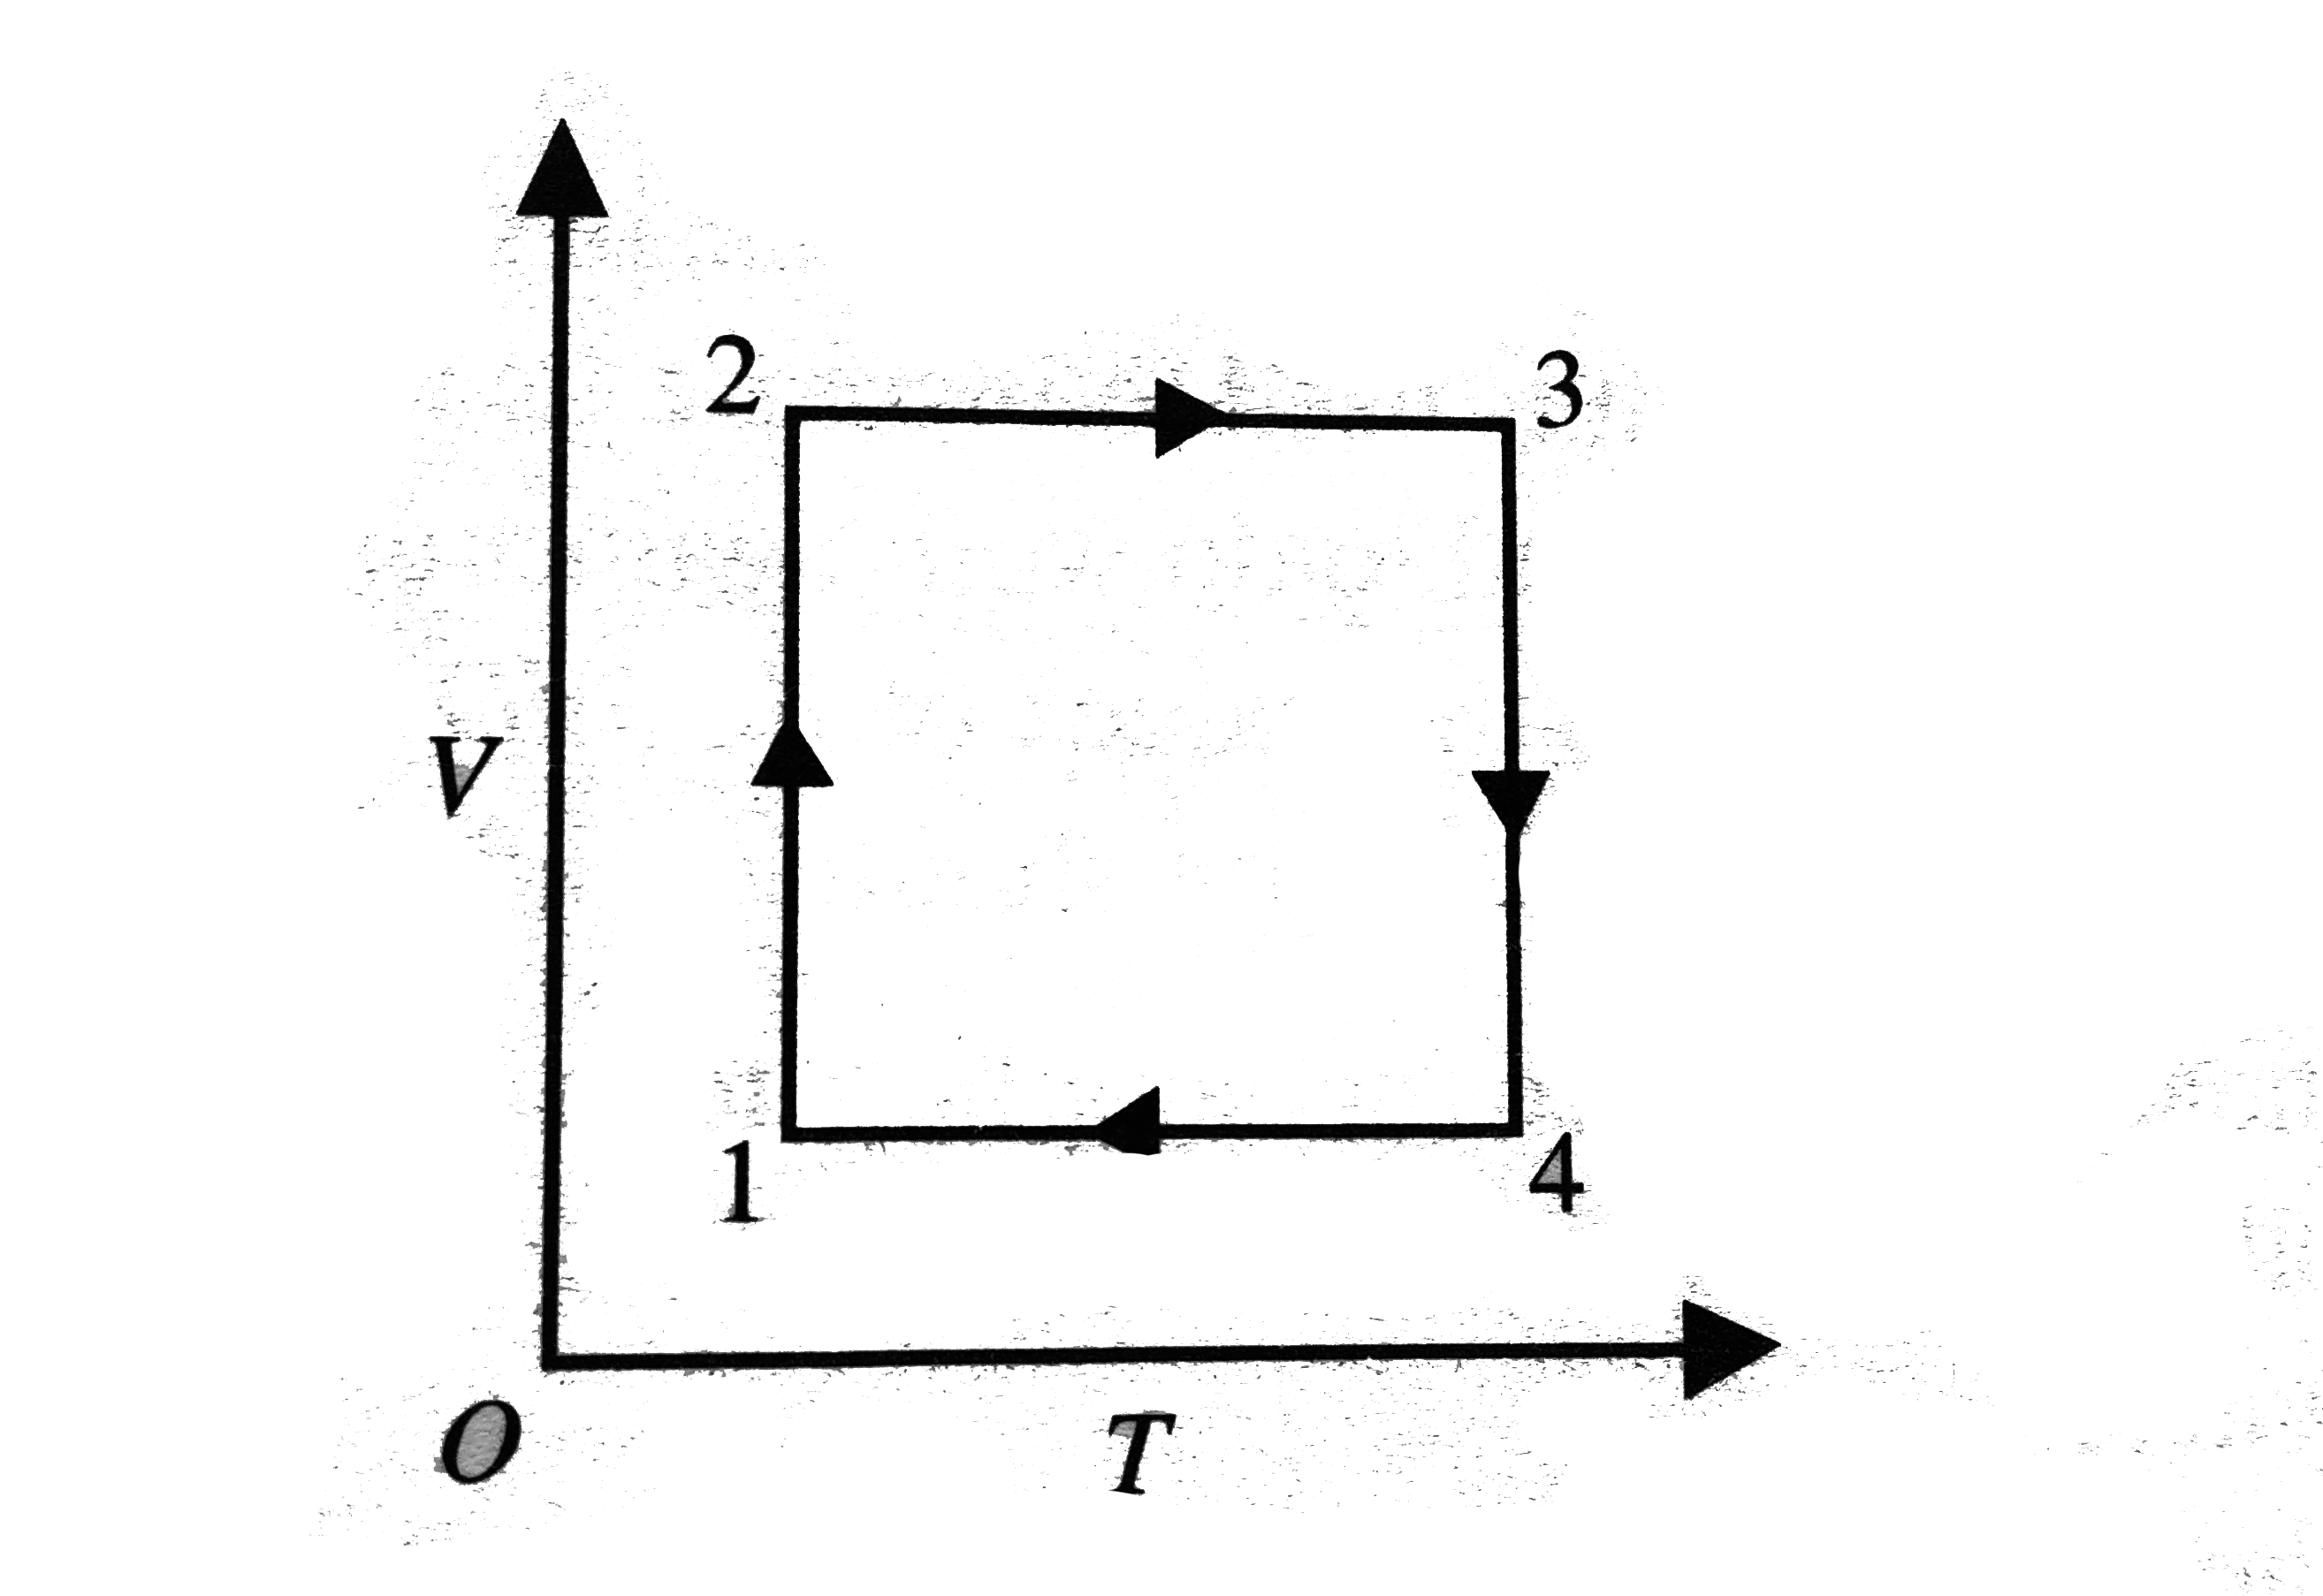
View SolutionA gas has been subjected to isochoric-isobaric processes 1-2-3-4-1 see Fig. Plot this process on T - V and P - T diagrams.
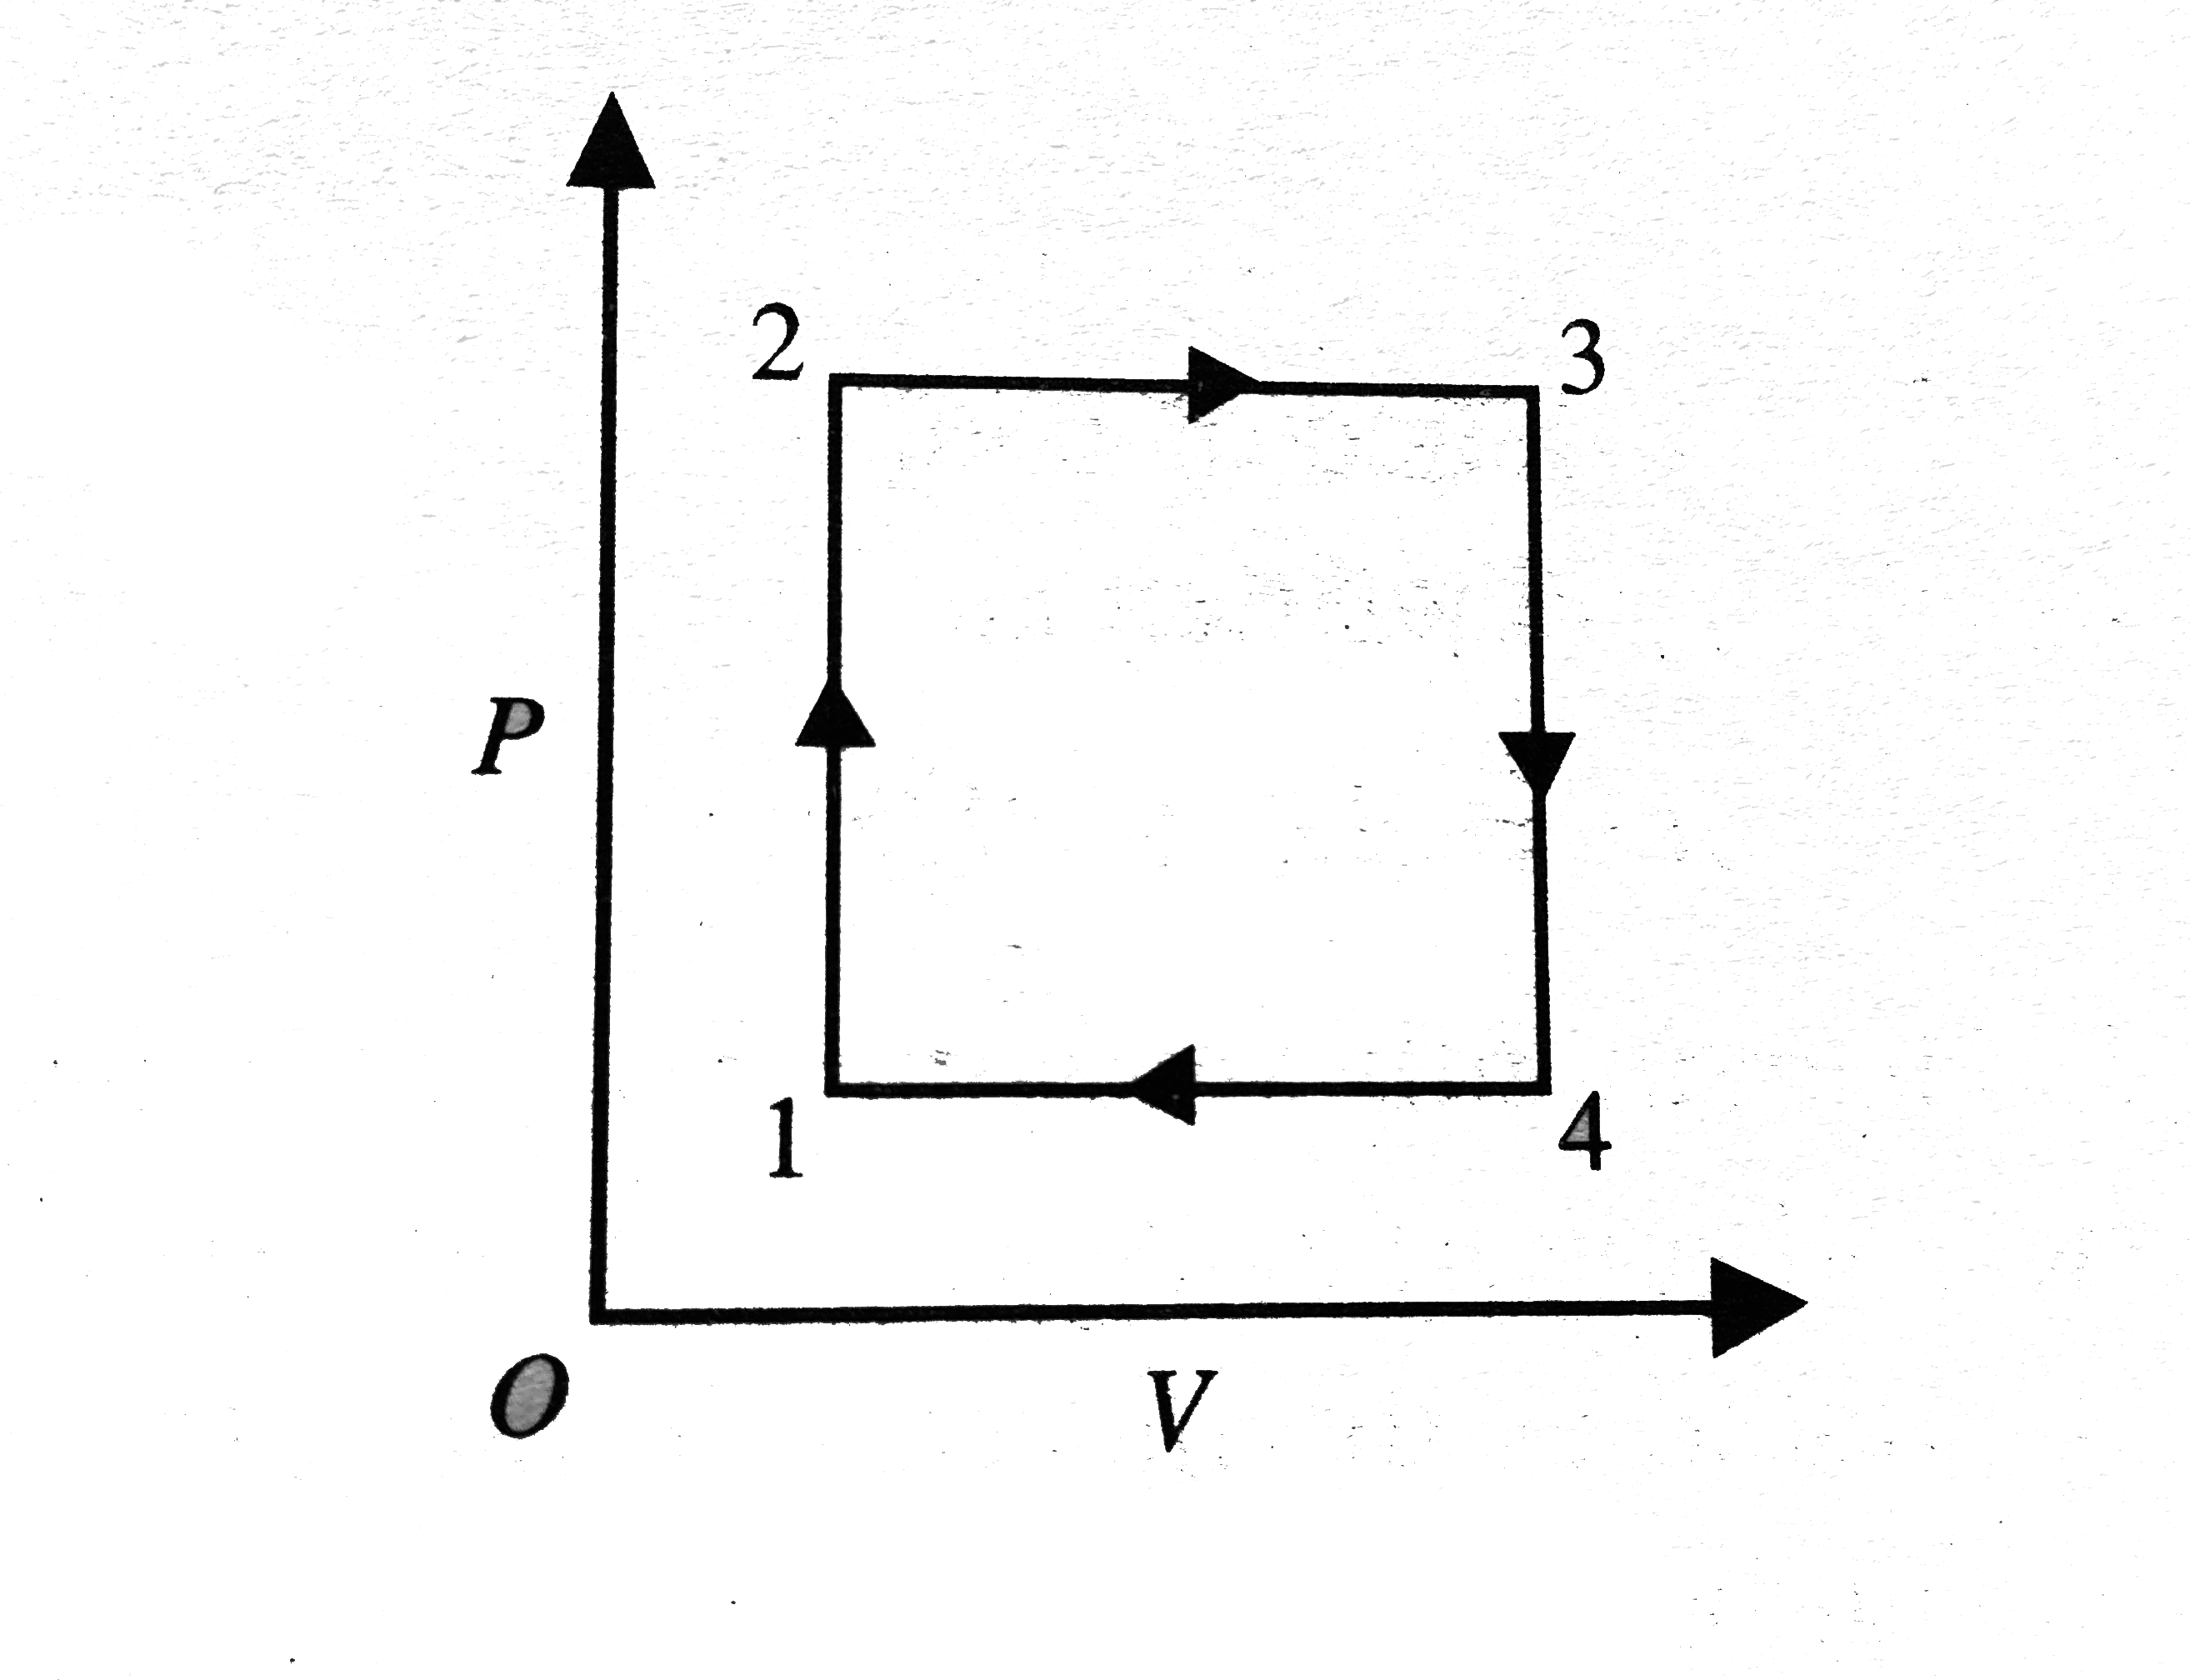
View SolutionA gas has been subjected to isochoric-isobaric processes 1-2-3-4-1 see Fig. Plot this process on T - V and P - T diagrams.

View SolutionA gas has been subjected to a cycle of isochoric, isothermal process 1-2-3-4-1 as shown in the figure. The graph for this cycle on P-T diagram is
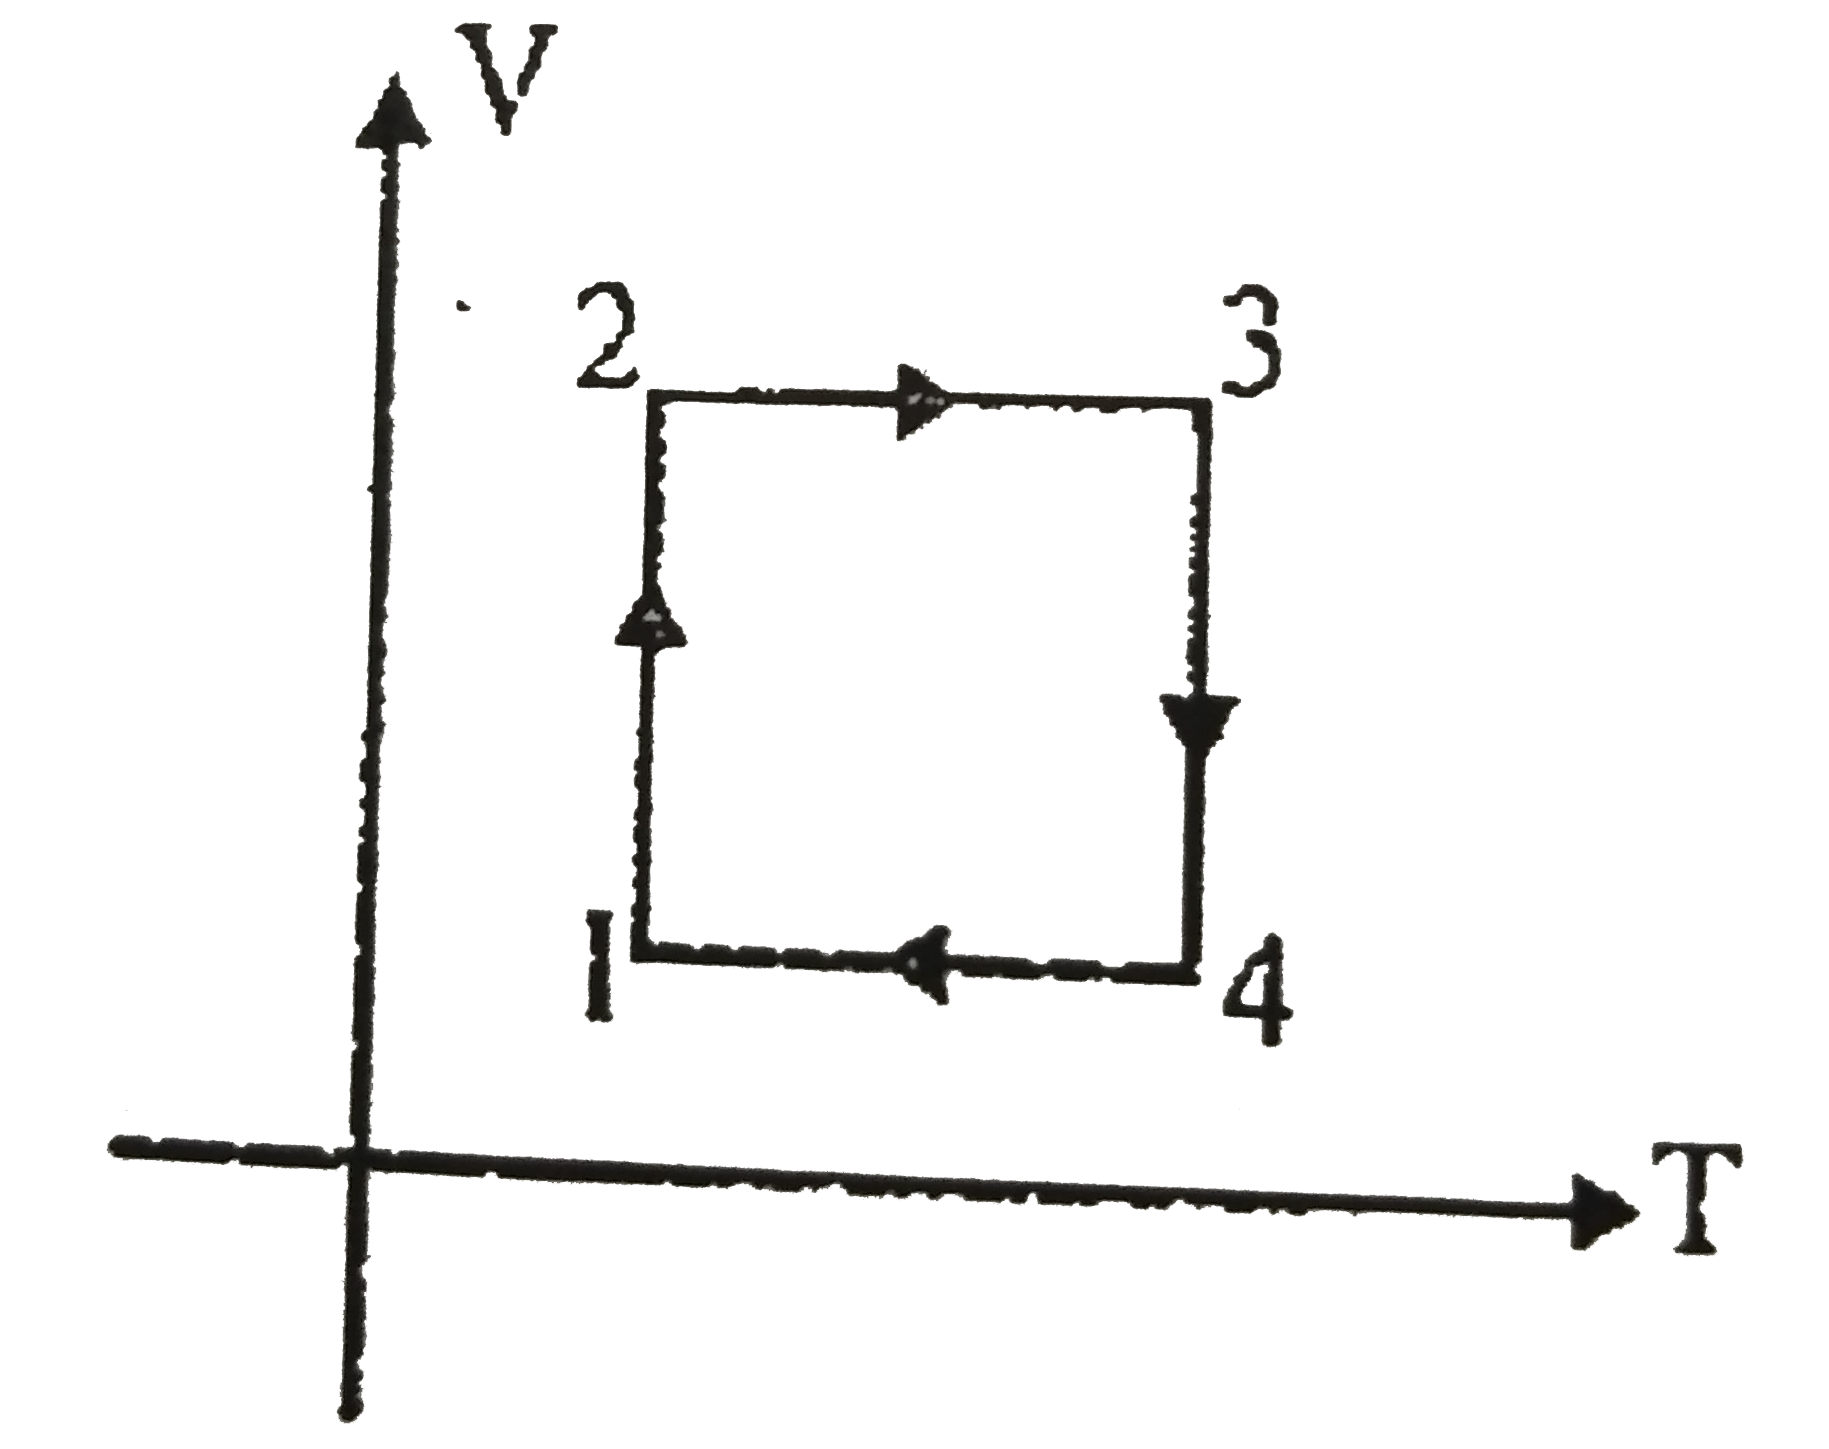
View Solution10 moles of an ideal gas is subjected to an isochoric process (volume constant) and a graph of log P us log T is plotted where P is in 'atm' and is in 'Kelvin'. If volume of the container is 82.1 ml then calculate sum of a,b and c.
Where : a = slope of the graph
b = x intercept of the graph
c = y intercept of the graph
View SolutionThe slope of P-V graph for isochoric process is
View Solution

