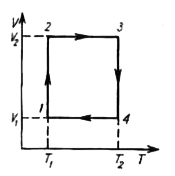
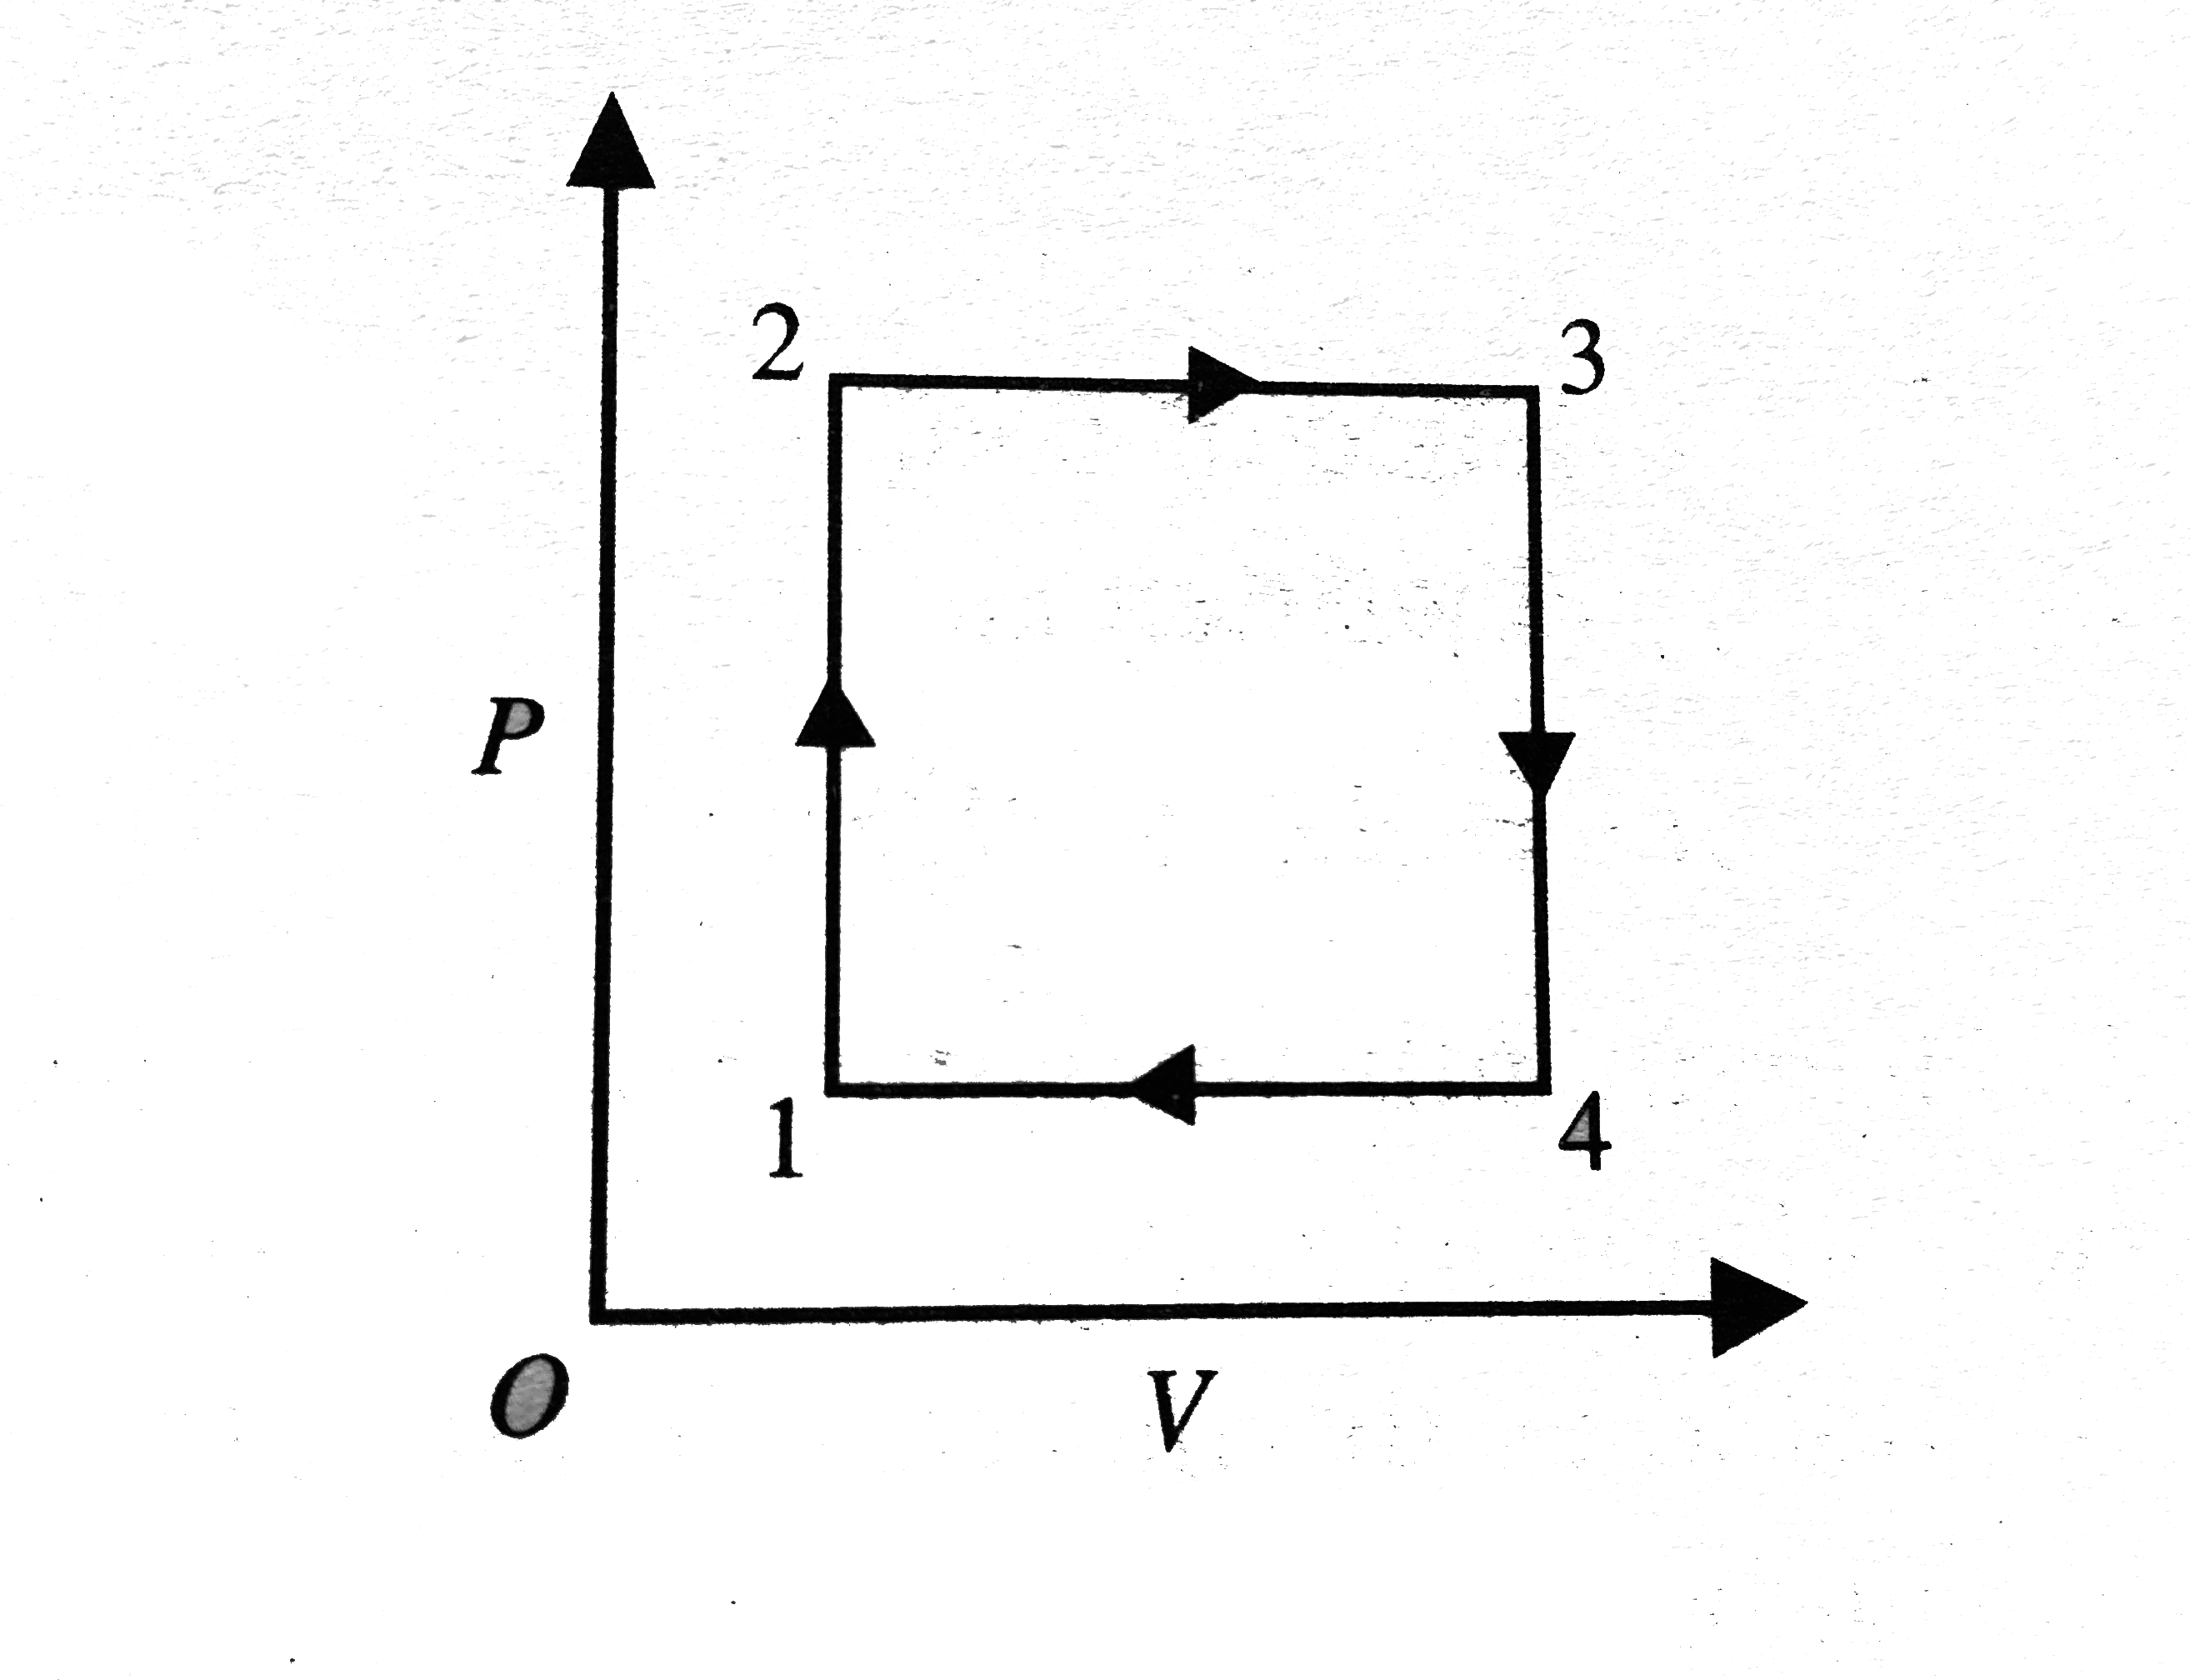
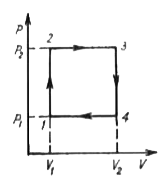
A gas has been subjected to an isothermal-isochromic cycle 1-2-3-4-1 see Fig. Represent the same cycle on P - V and P - T diagrams.
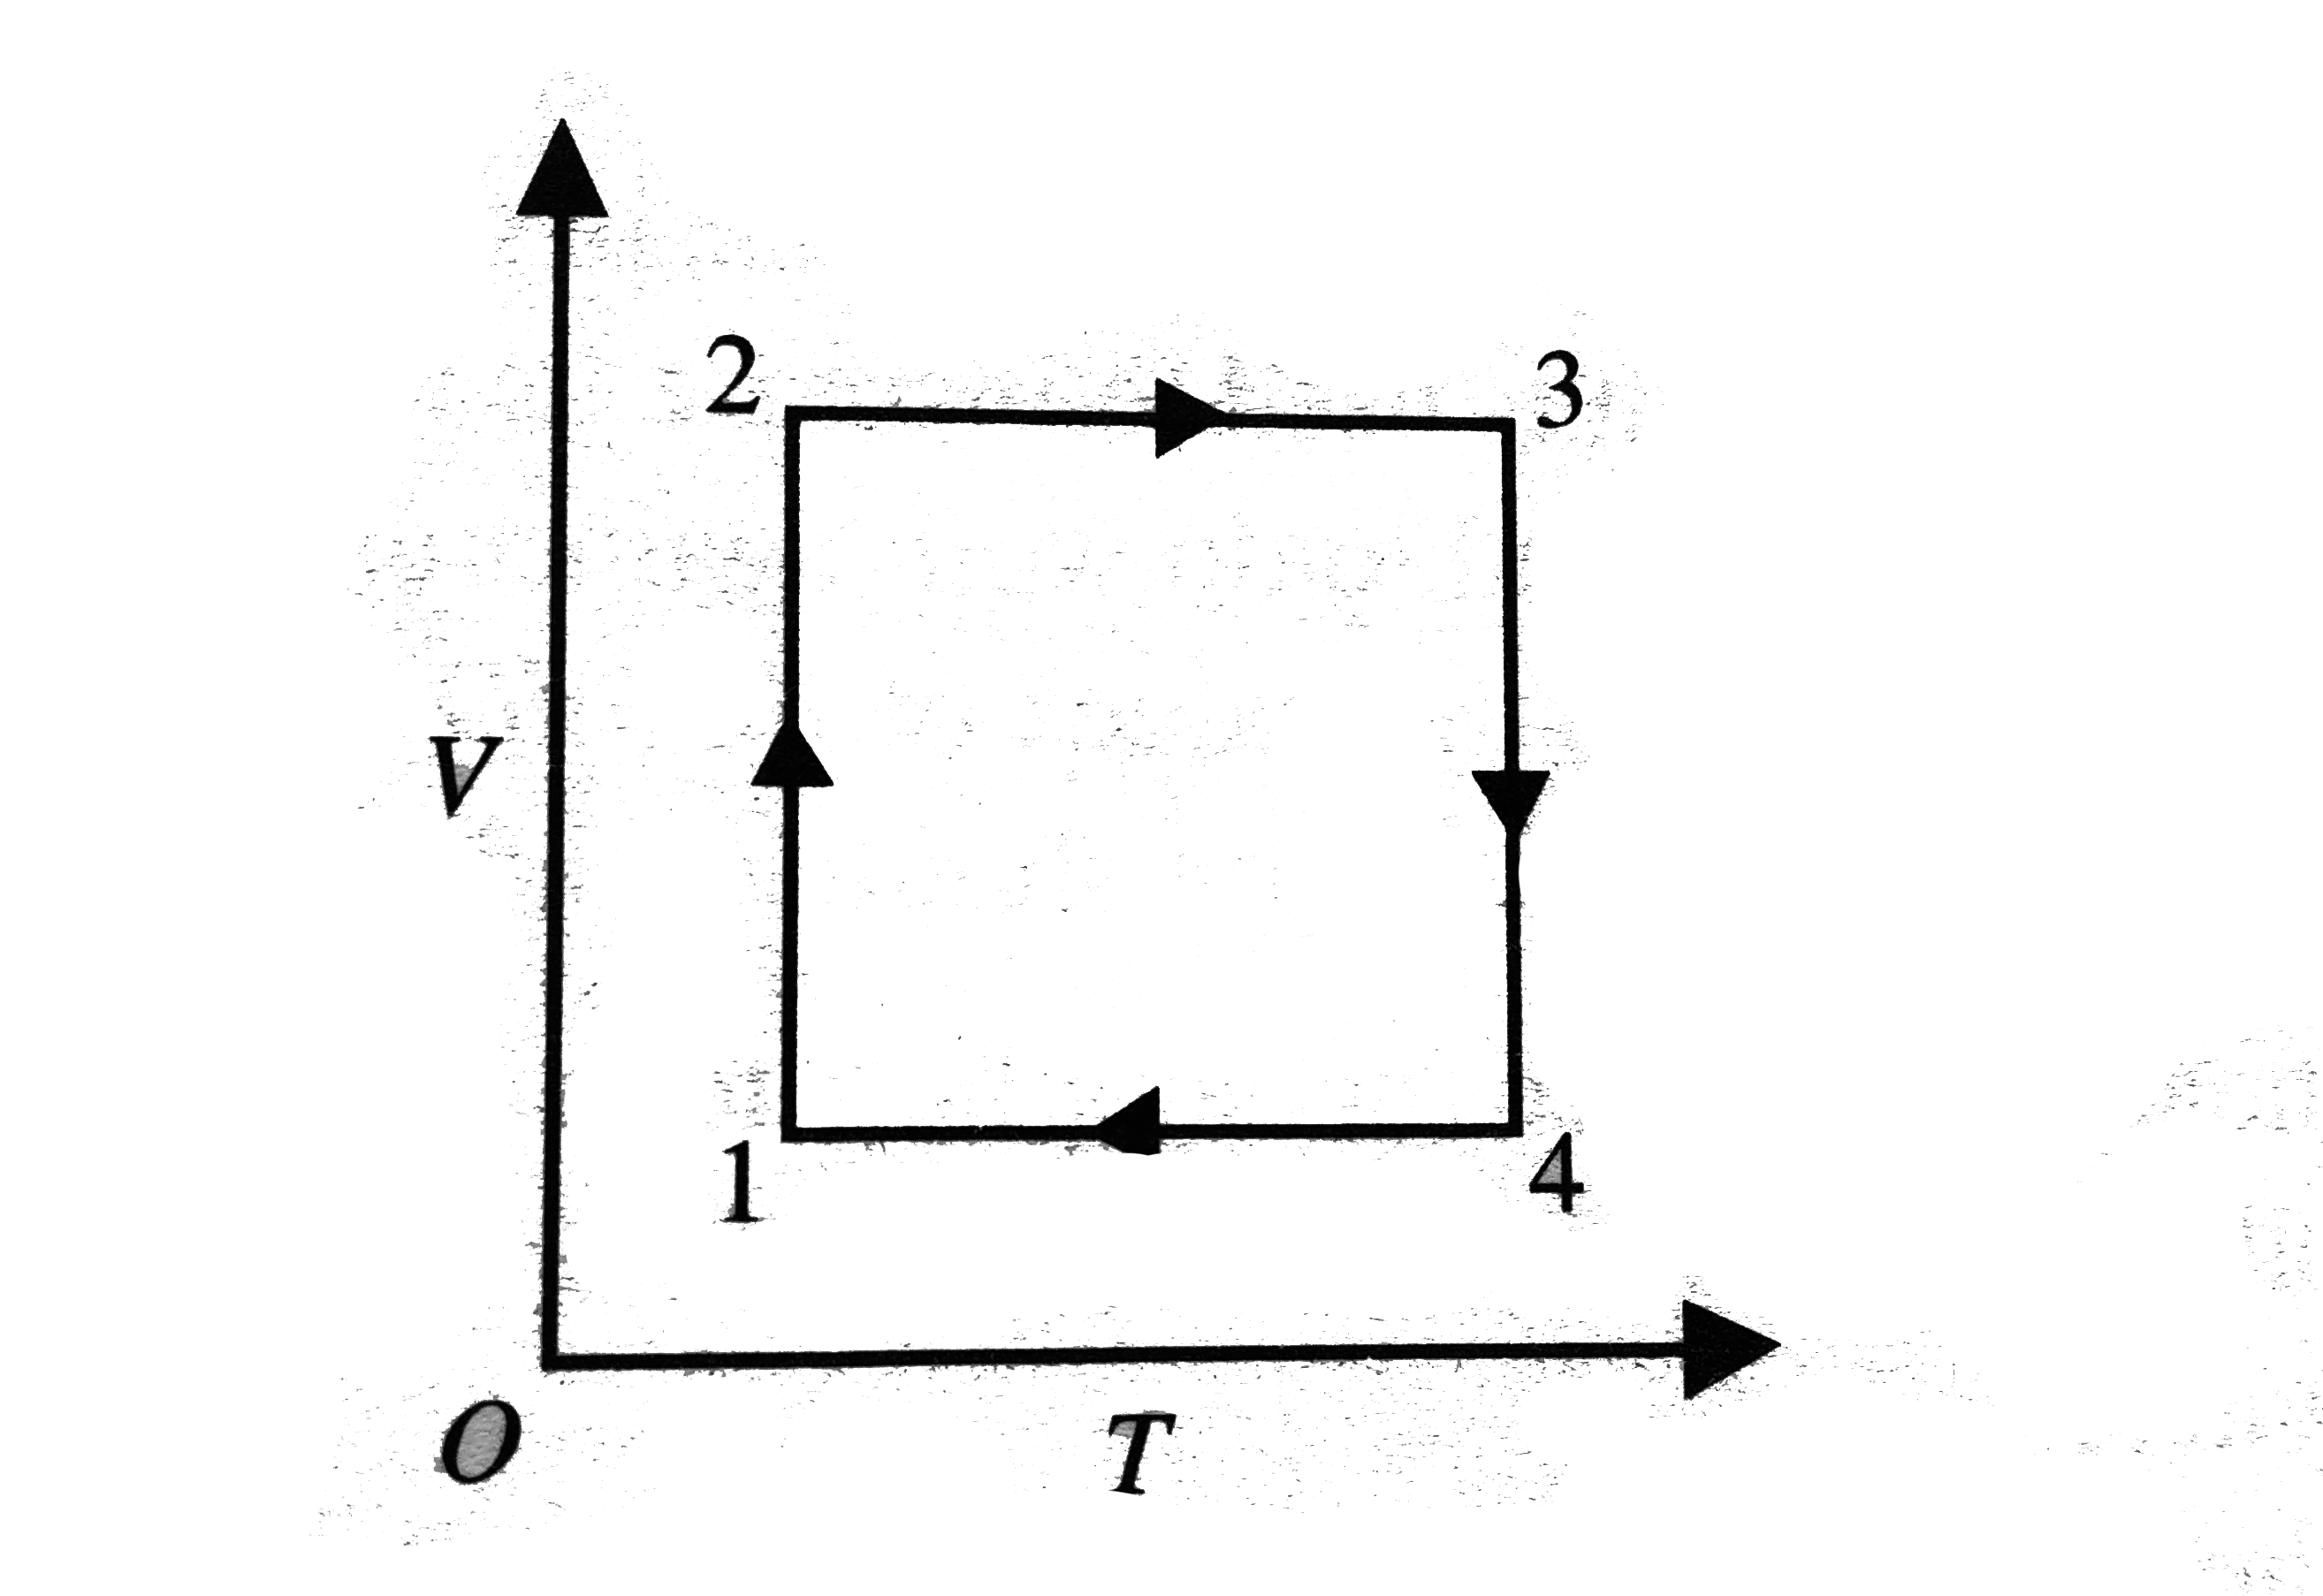
The plot p against V is shown in Fig.
Explanation: Since from 1−2 temperature remains constant, the plot p against V is a curve (hyperbola) because pV = constant. From 2−3 volume remains constant, so the plot of p against V is parallel to the p-axis.
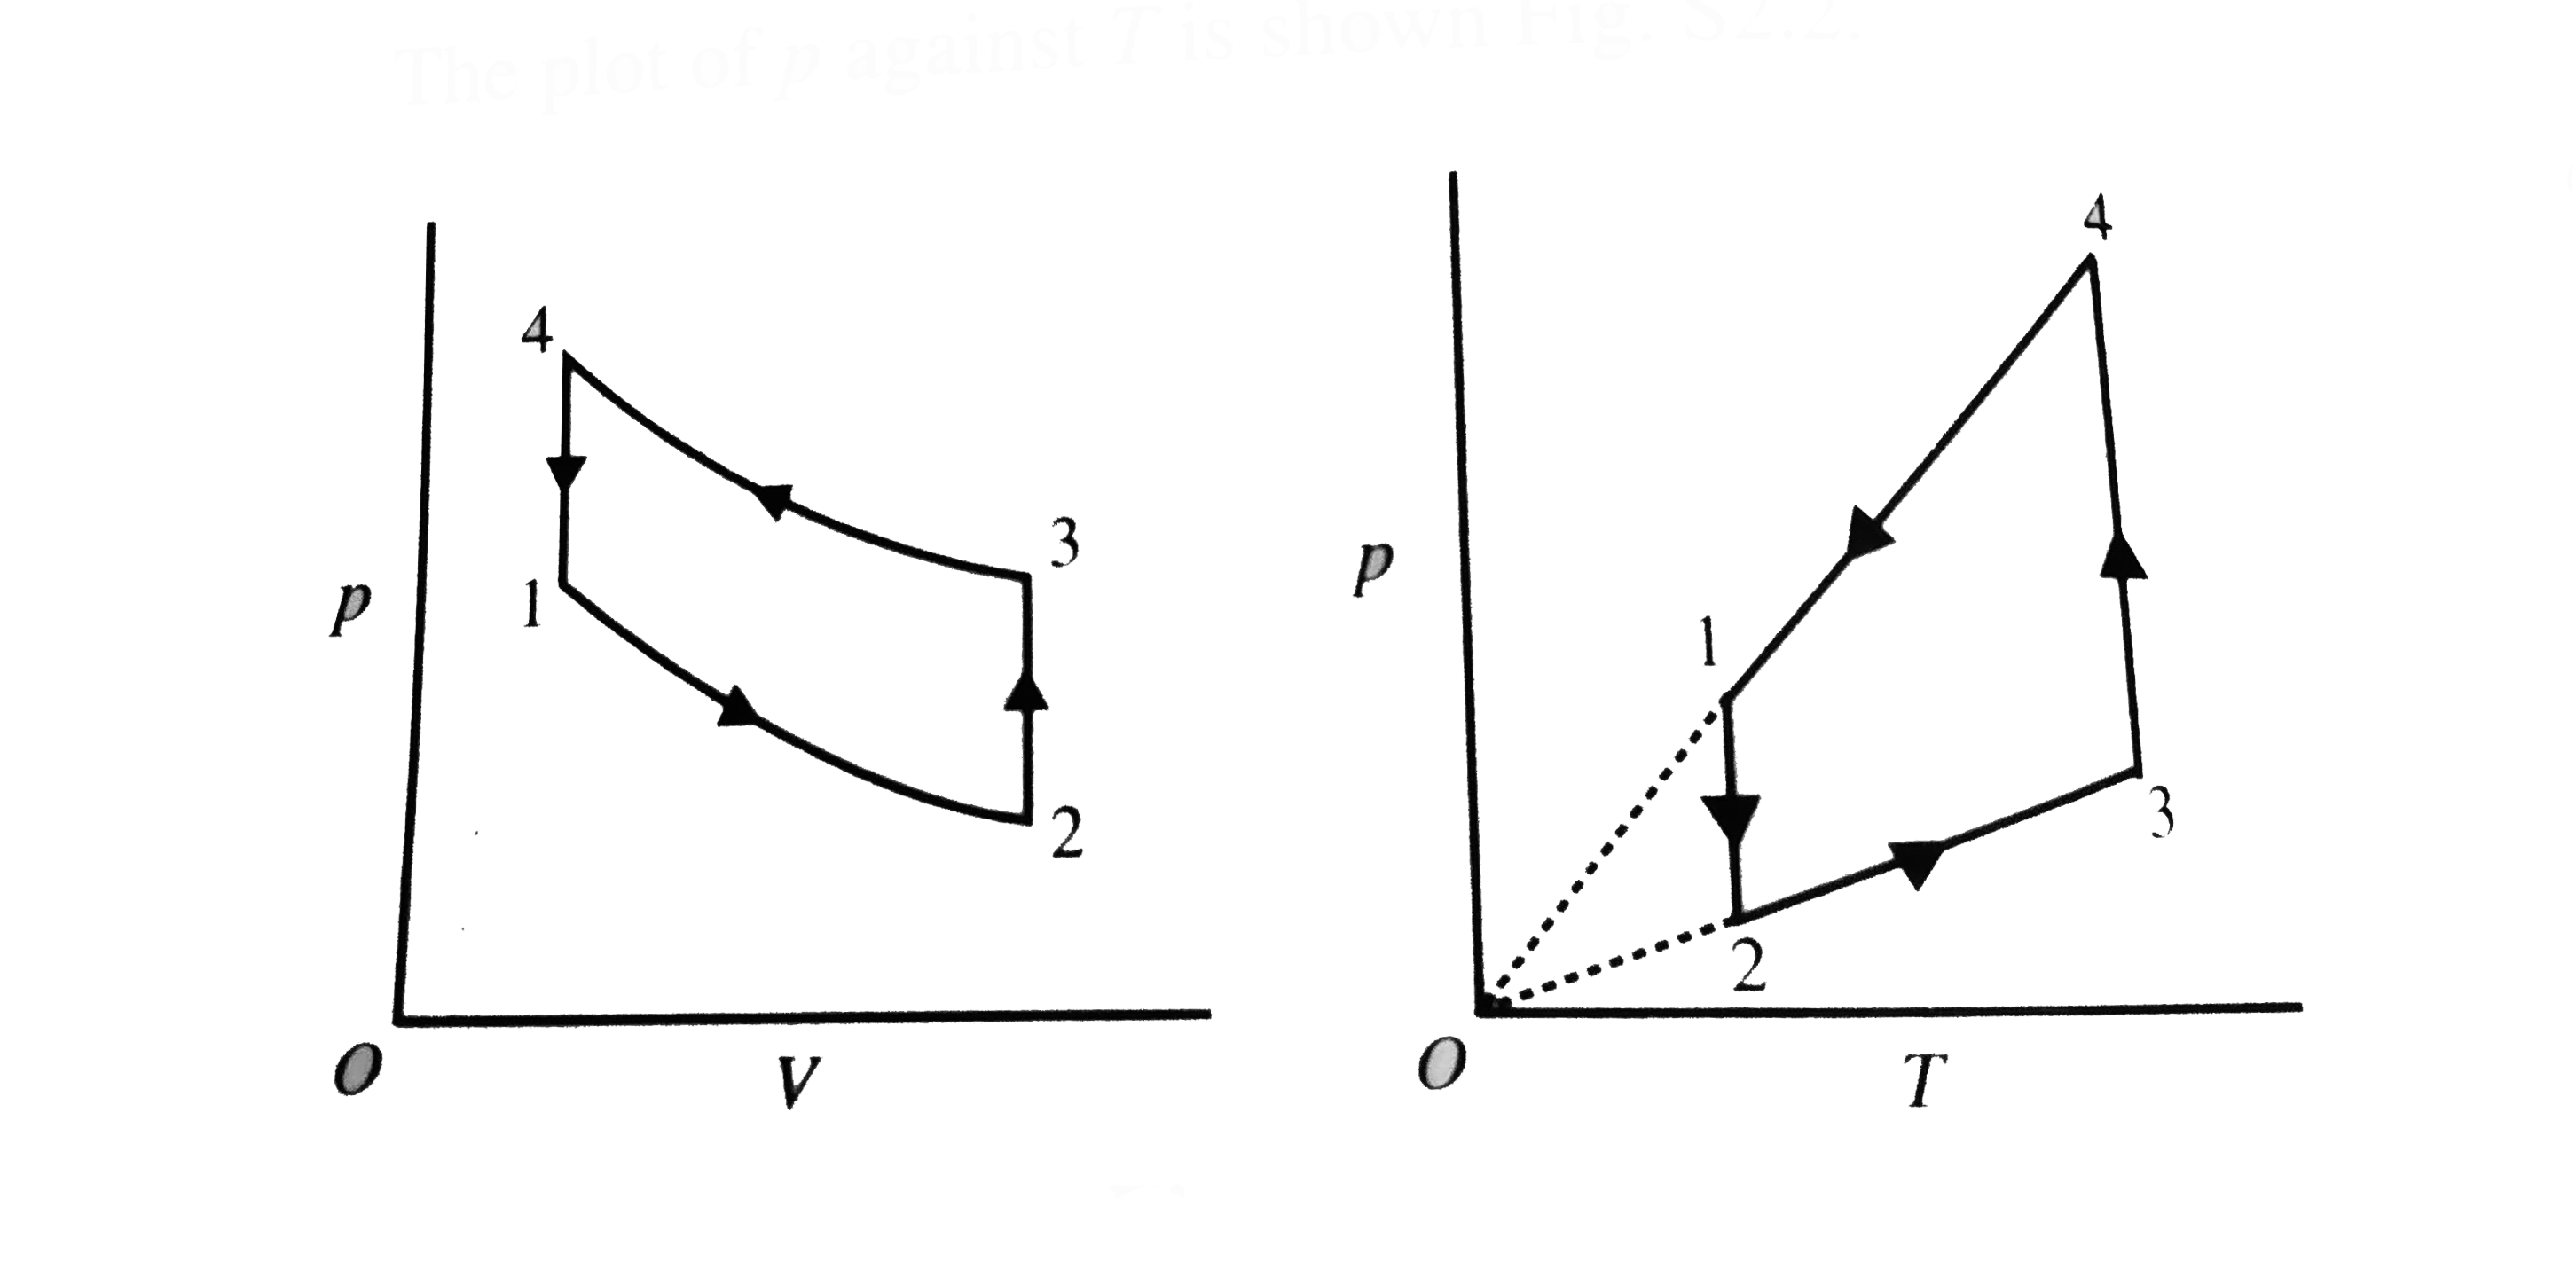
The plot of p against T is shown Fig.
It can be explained in the same way.
Topper's Solved these Questions
- BOOK - CENGAGE PHYSICSCHAPTER - KINETIC THEORY OF GASES AND FIRST LAW OF THERMODYNAMICSEXERCISE - Exercise 2.228videos
KINETIC THEORY OF GASES AND FIRST LAW OF THERMODYNAMICS
- BOOK - CENGAGE PHYSICSCHAPTER - KINETIC THEORY OF GASES AND FIRST LAW OF THERMODYNAMICSEXERCISE - Subjective22videos
KINETIC THEORY OF GASES AND FIRST LAW OF THERMODYNAMICS
- BOOK - CENGAGE PHYSICSCHAPTER - KINETIC THEORY OF GASES AND FIRST LAW OF THERMODYNAMICSEXERCISE - Solved Examples14videos
KINETIC THEORY OF GASES AND FIRST LAW OF THERMODYNAMICS
- BOOK - CENGAGE PHYSICSCHAPTER - KINETIC THEORY OF GASESEXERCISE - Compression2videos
KINETIC THEORY OF GASES
- BOOK - CENGAGE PHYSICSCHAPTER - LINEAR AND ANGULAR SIMPLE HARMONIC MOTIONEXERCISE - Multiple Correct Answer Type9videos
LINEAR AND ANGULAR SIMPLE HARMONIC MOTION
Similar Questions
Knowledge Check
- Question 1 - Select One or More
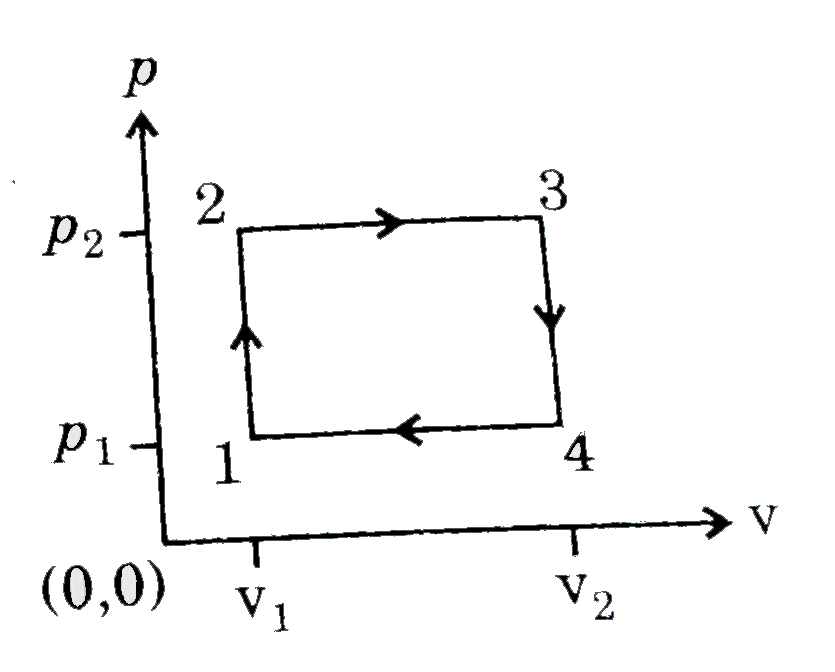
A gas has been subjected to an isochoric and isobaric cycle. Plot of the graph of this cycle in the pressure-density, V-T and P-T co-ordinates are given below. Choose the correct plots.
 A
A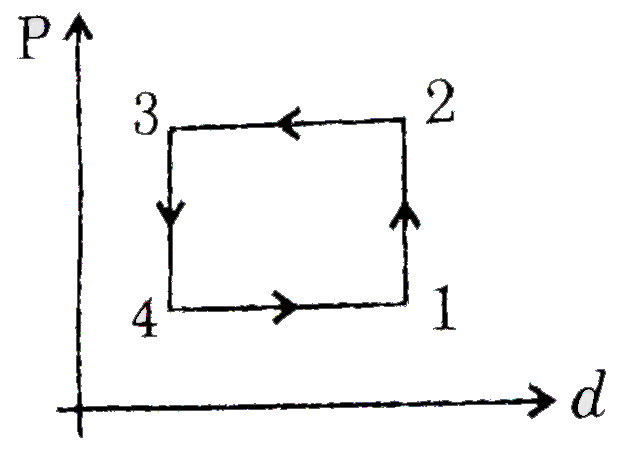 B
B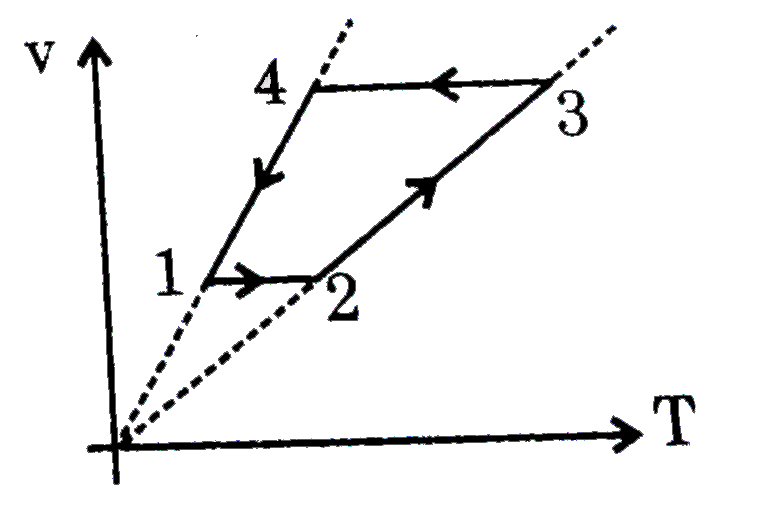 C
C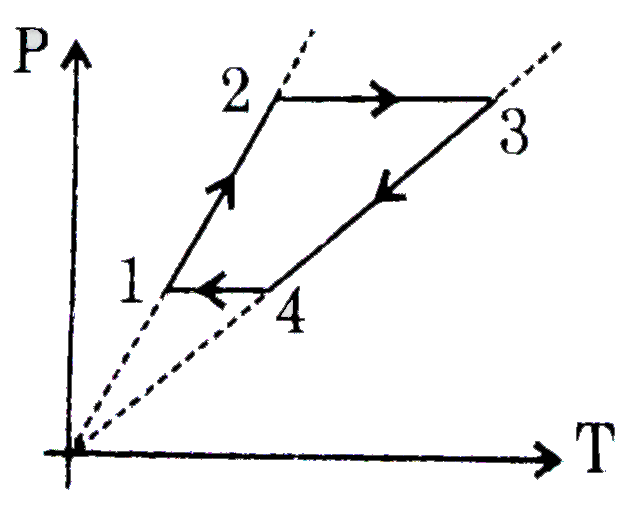 DNone of these
 - Question 2 - Select One
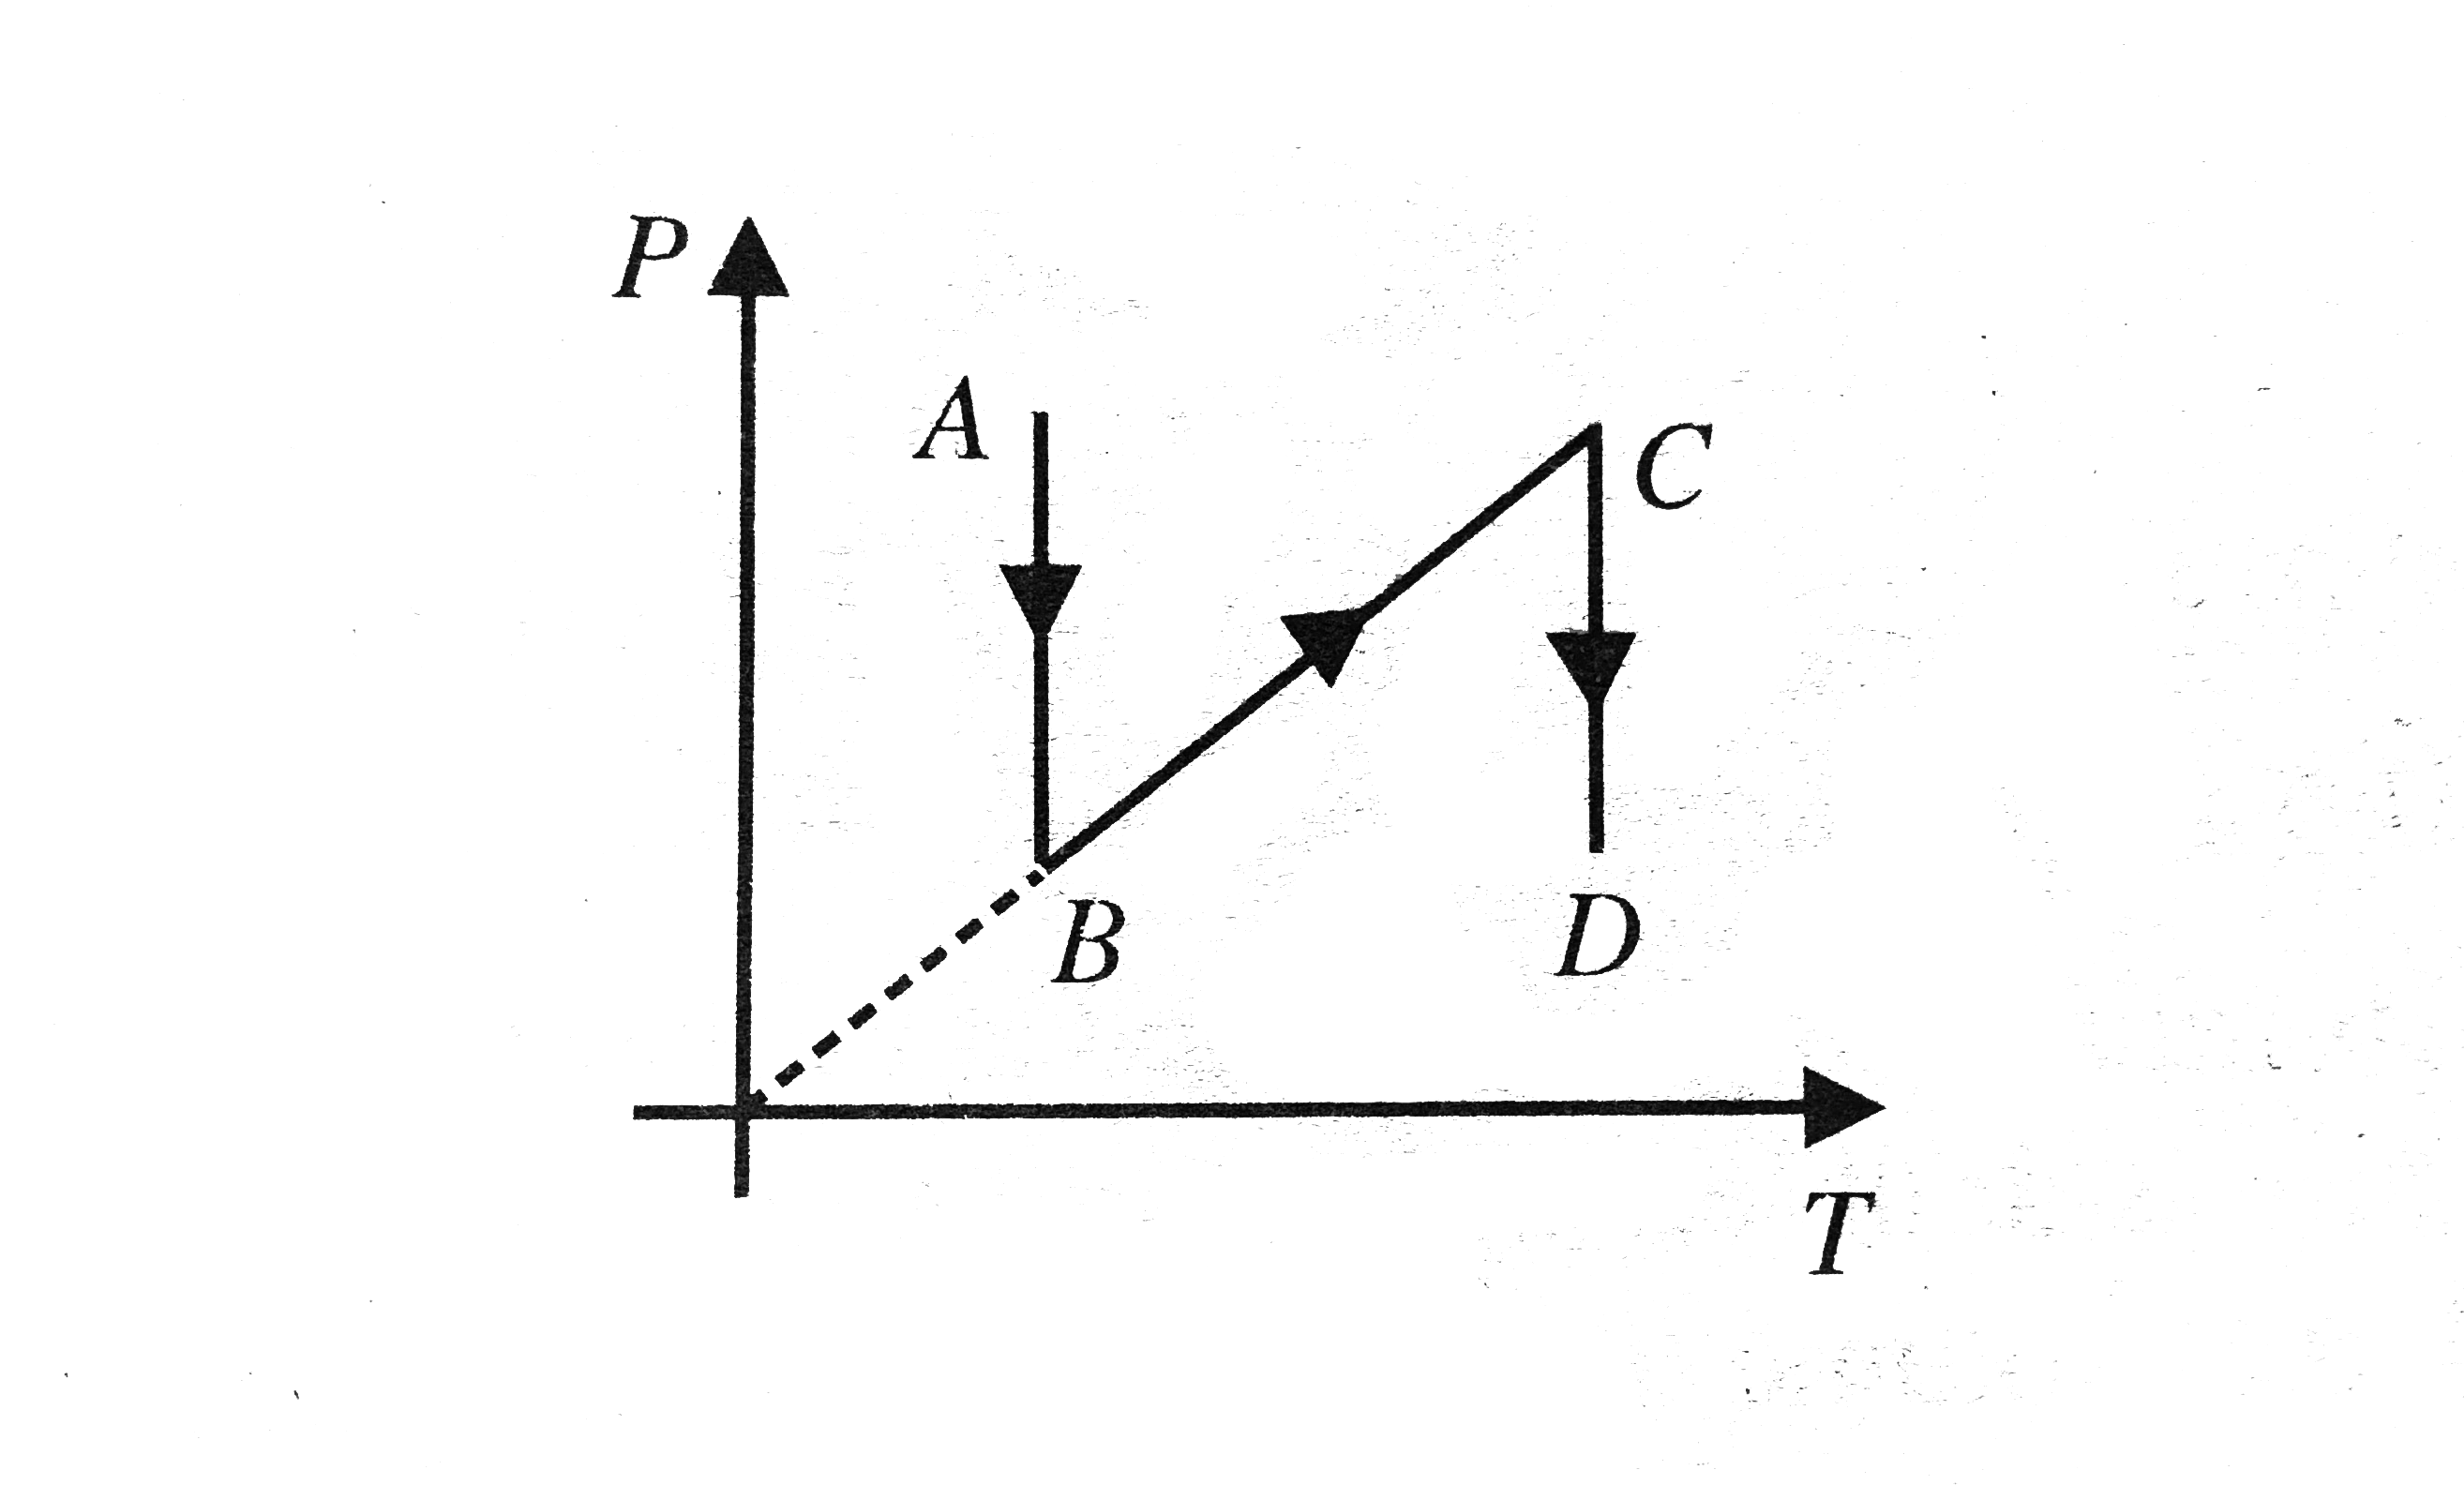
P−T diagram is shown in Fig. Choose the corresponding V−T diagram.
 A
A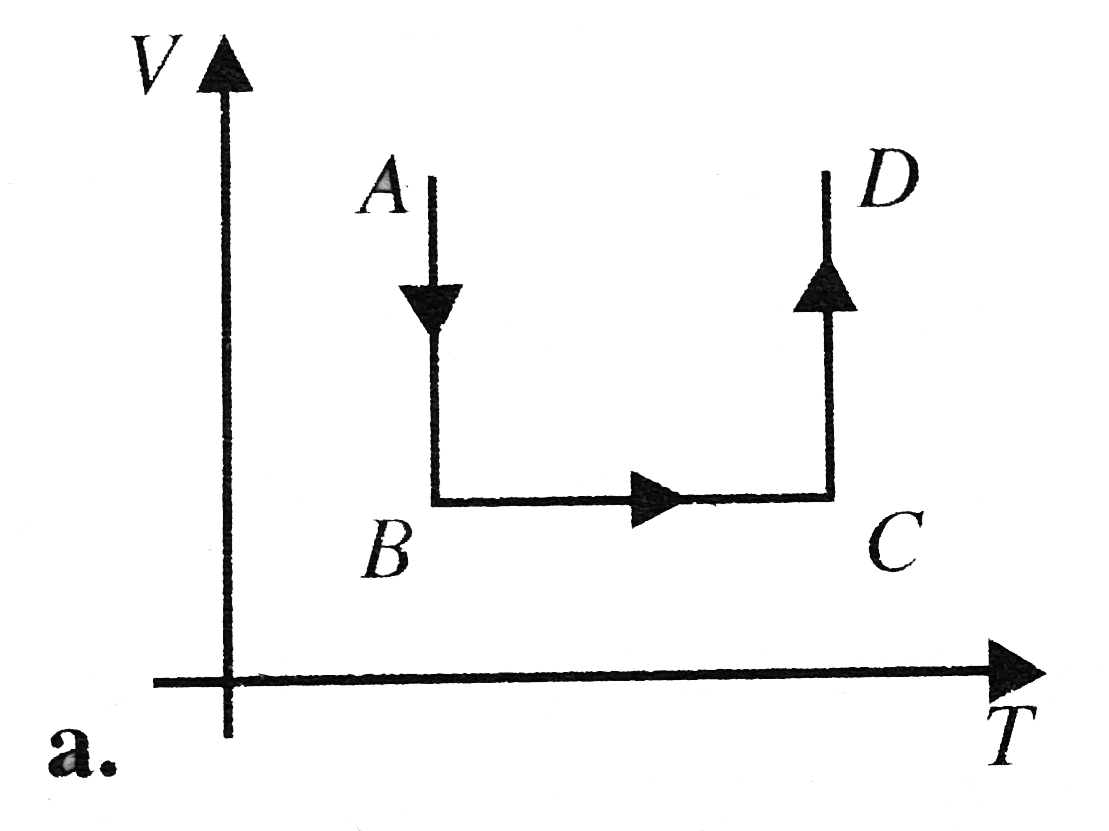 B
B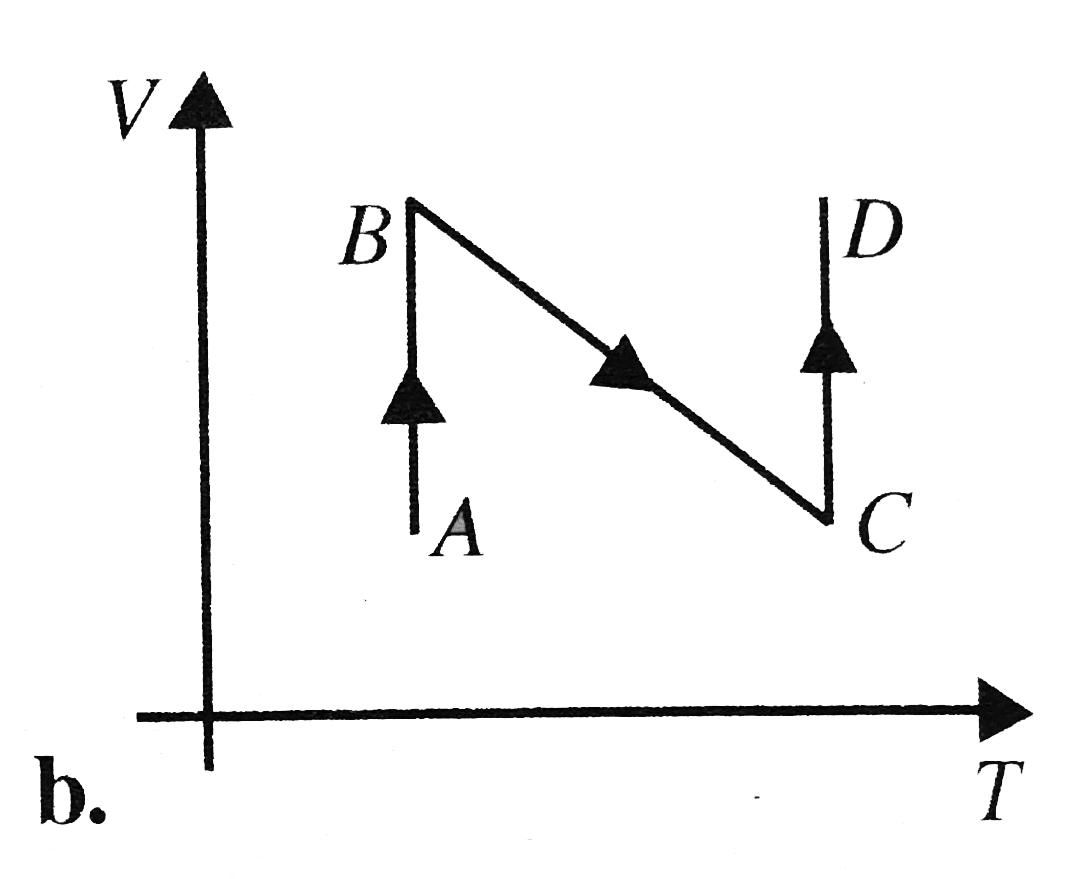 C
C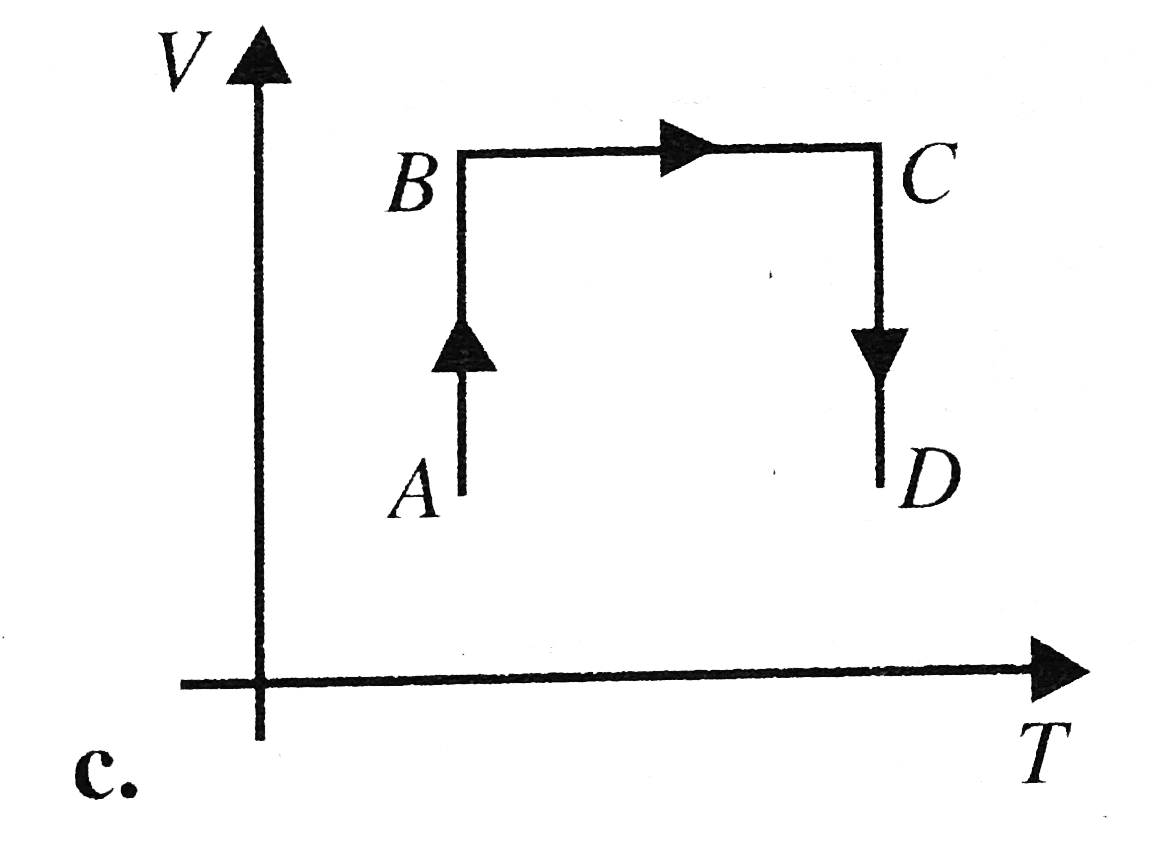 D
D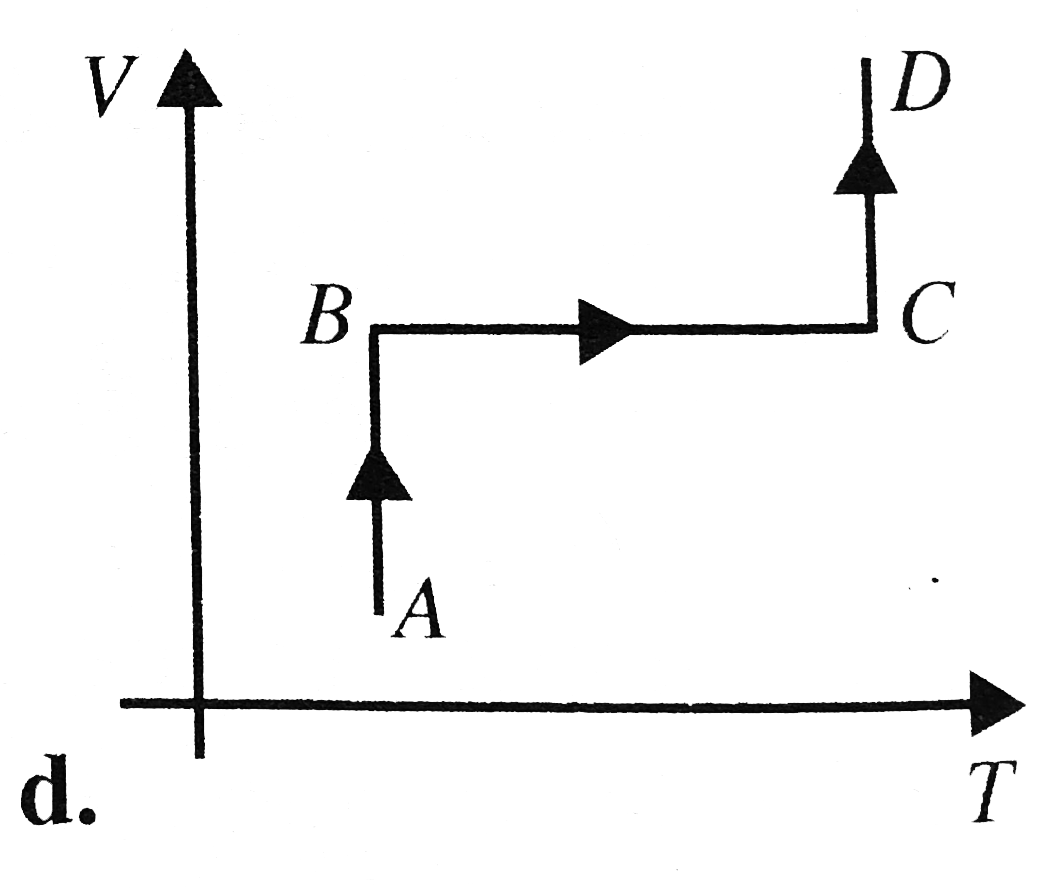
- Question 3 - Select One
A cyclic process is shown on a P-V diagram. The working fluid is an idal and corresponding thermodynamic co-ordinates are given. Here, P and V scales are so chosen that these cycles on P-V diagram appear to be circular.
Analyse these cycles on P-V diagram and answer the following questions about these proesses.
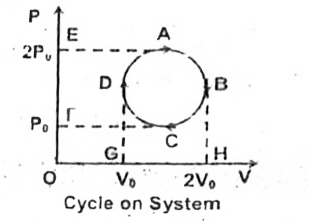
Analyse these cycles on P-V diagram and answer the following questions about hte processes.
What is the done during compression in the given process?A(12+π)P0V08B−(12+π)P0V08C(12−π)P0V08D−(12−π)P0V08
A gas has been subjected to an isochoric-isobaric cycle 1-2-3-4-1 (Fig.). Plot the graph of this cycle in the p−ρ,V−T and p-T coordinates.
 View Solution
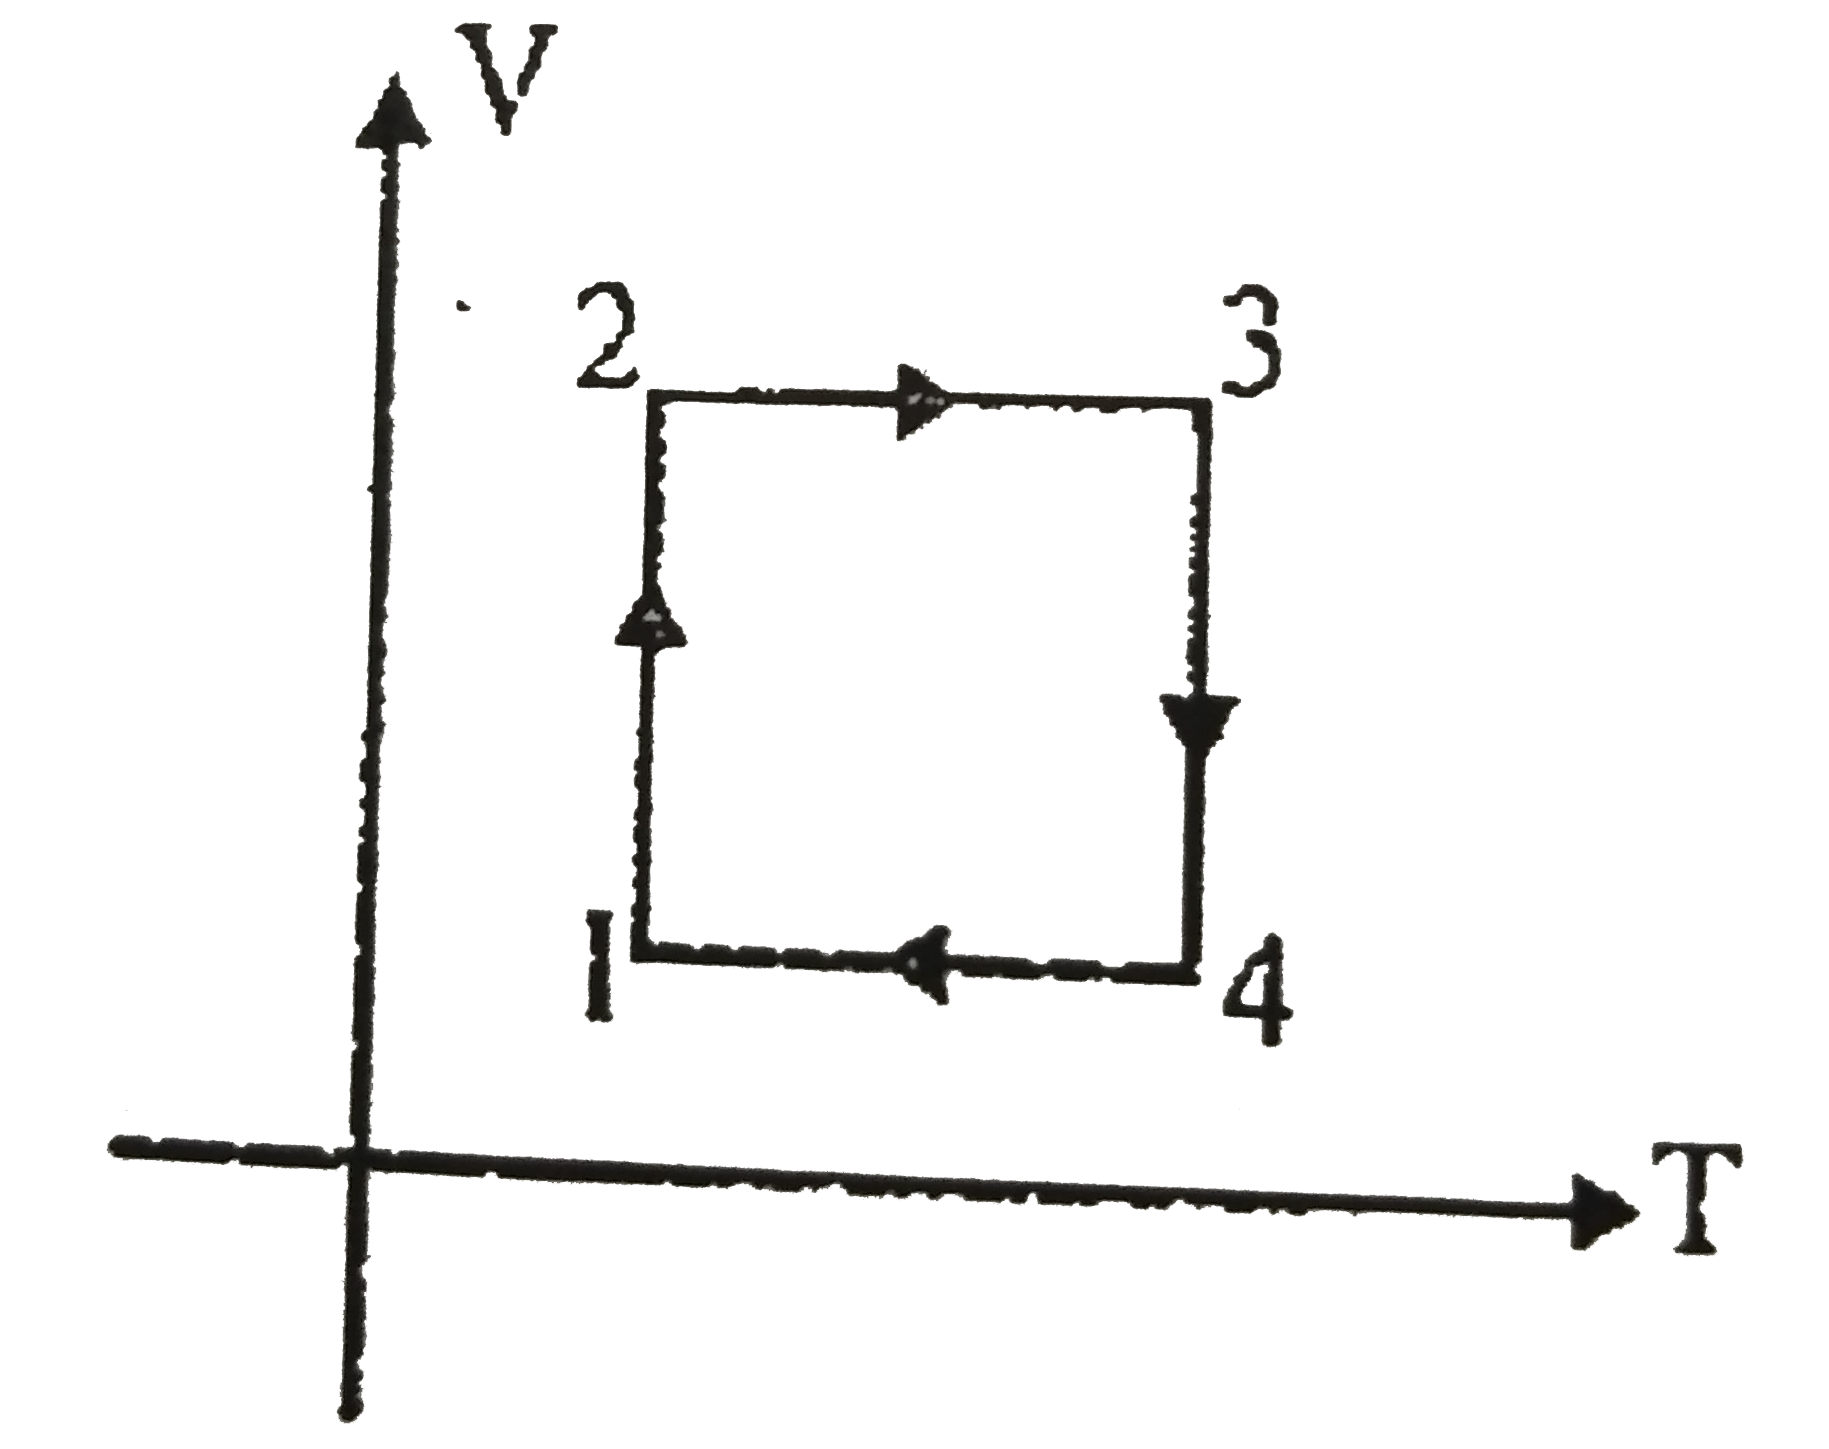
A gas has been subjected to a cycle of isochoric, isothermal process 1-2-3-4-1 as shown in the figure. The graph for this cycle on P-T diagram is
 View Solution
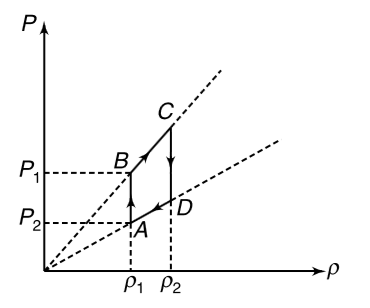
n' moles of an ideal gas having molar mass M is made to undergo a cyclic process ABCDA. The cycle has been represented on a pressure (P) density (ρ)) diagram.
(a) Draw the corresponding P – V diagram
(b) Calculate the work done by the gas in the cycle
 View Solution
A cyclic process is shown on a P-V diagram. The working fluid is an idal and corresponding thermodynamic co-ordinates are given. Here, P and V scales are so chosen that these cycles on P-V diagram appear to be circular.
Analyse these cycles on P-V diagram and answer the following questions about these proesses.
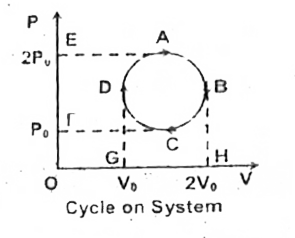
Analyse these cycles on P-V diagram and answer the following questions about hte processes.
What is the net work done in the given processView SolutionA cyclic process is shown on a P-V diagram. The working fluid is an idal and corresponding thermodynamic co-ordinates are given. Here, P and V scales are so chosen that these cycles on P-V diagram appear to be circular.
Analyse these cycles on P-V diagram and answer the following questions about these proesses.
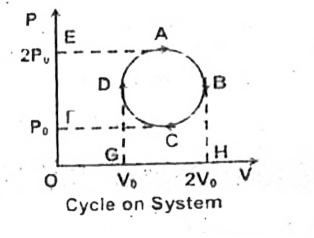
Analyse these cycles on P-V diagram and answer the following questions about hte processes.
What is the work done during expansion in the given process?View Solution


