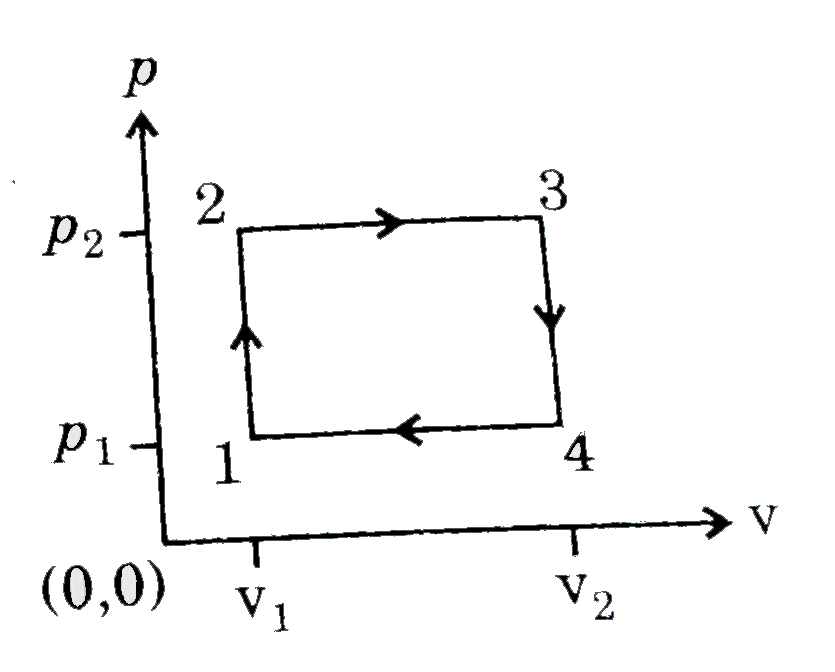
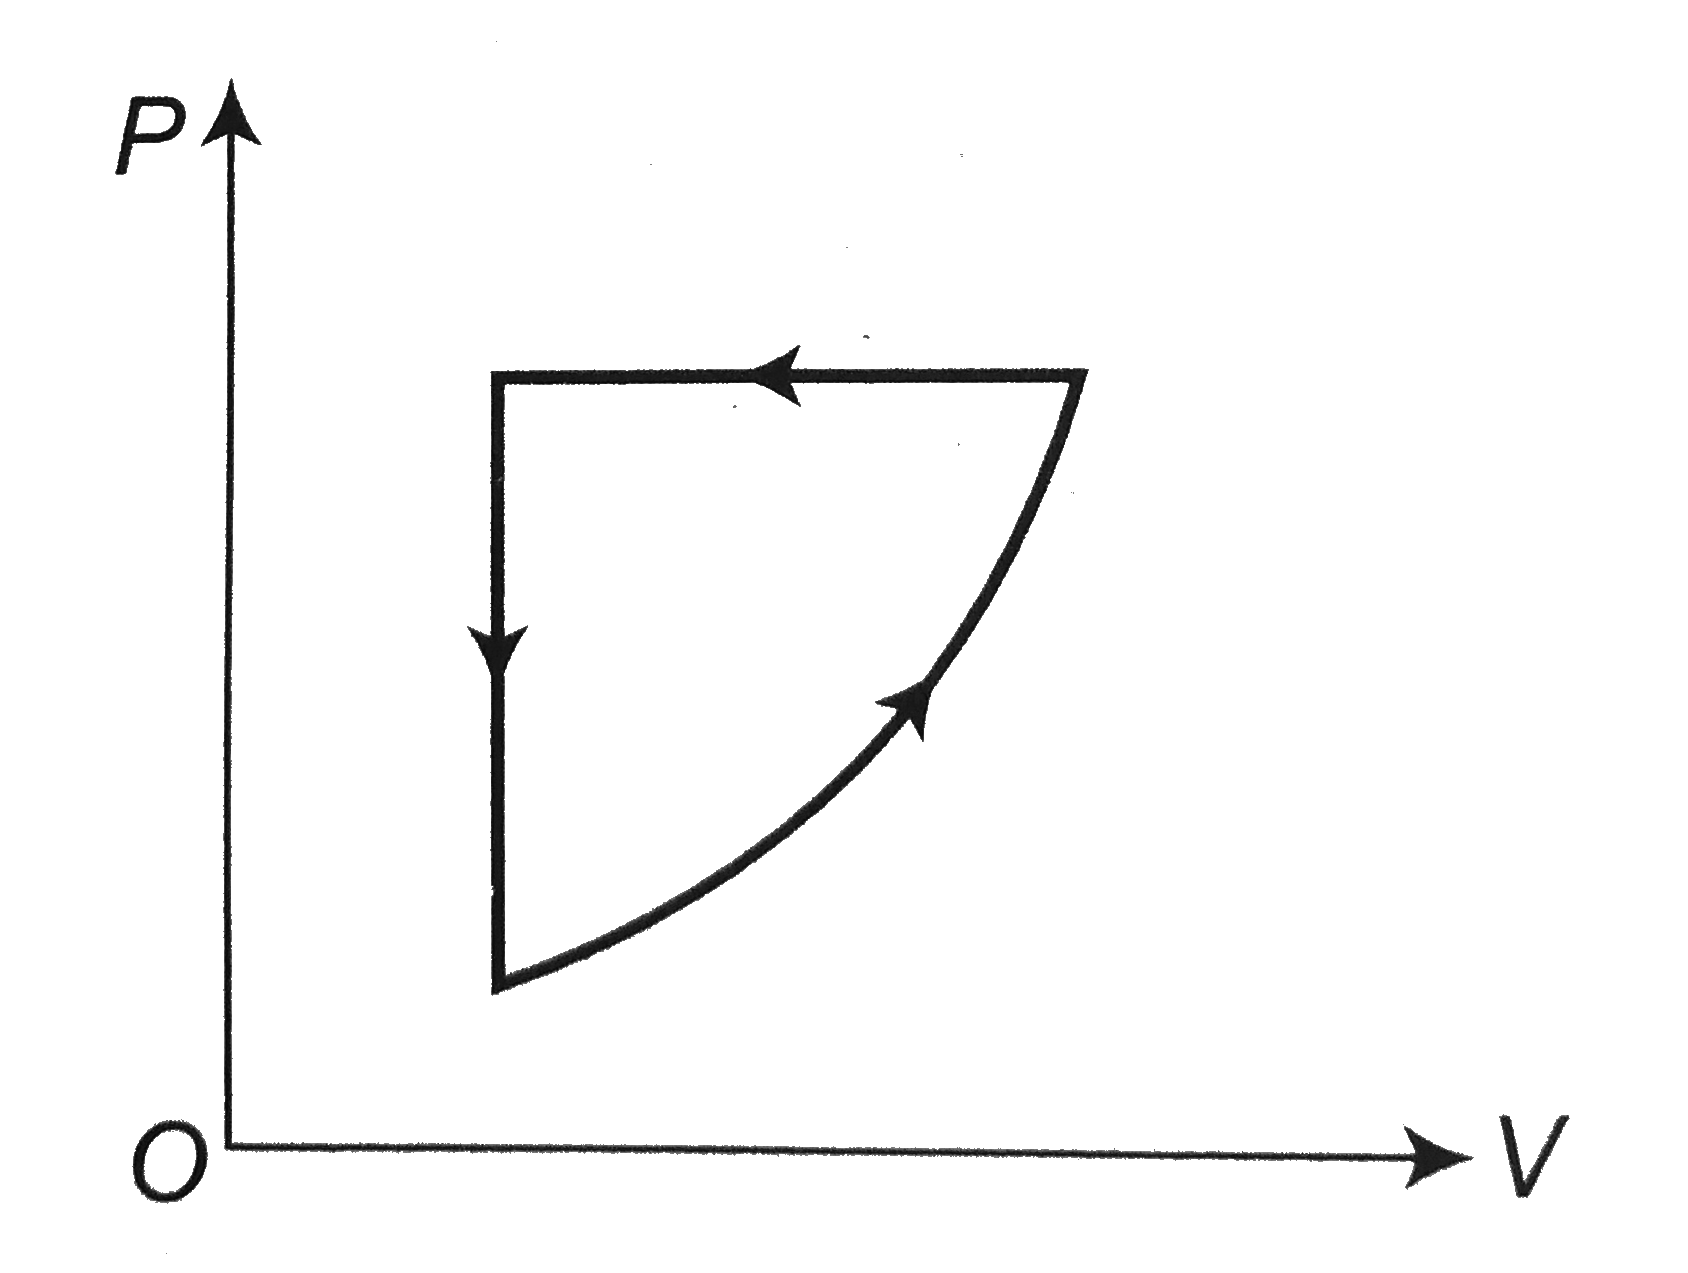
A gas has been subjected to a cycle of isochoric, isothermal process 1-2-3-4-1 as shown in the figure. The graph for this cycle on P-T diagram is
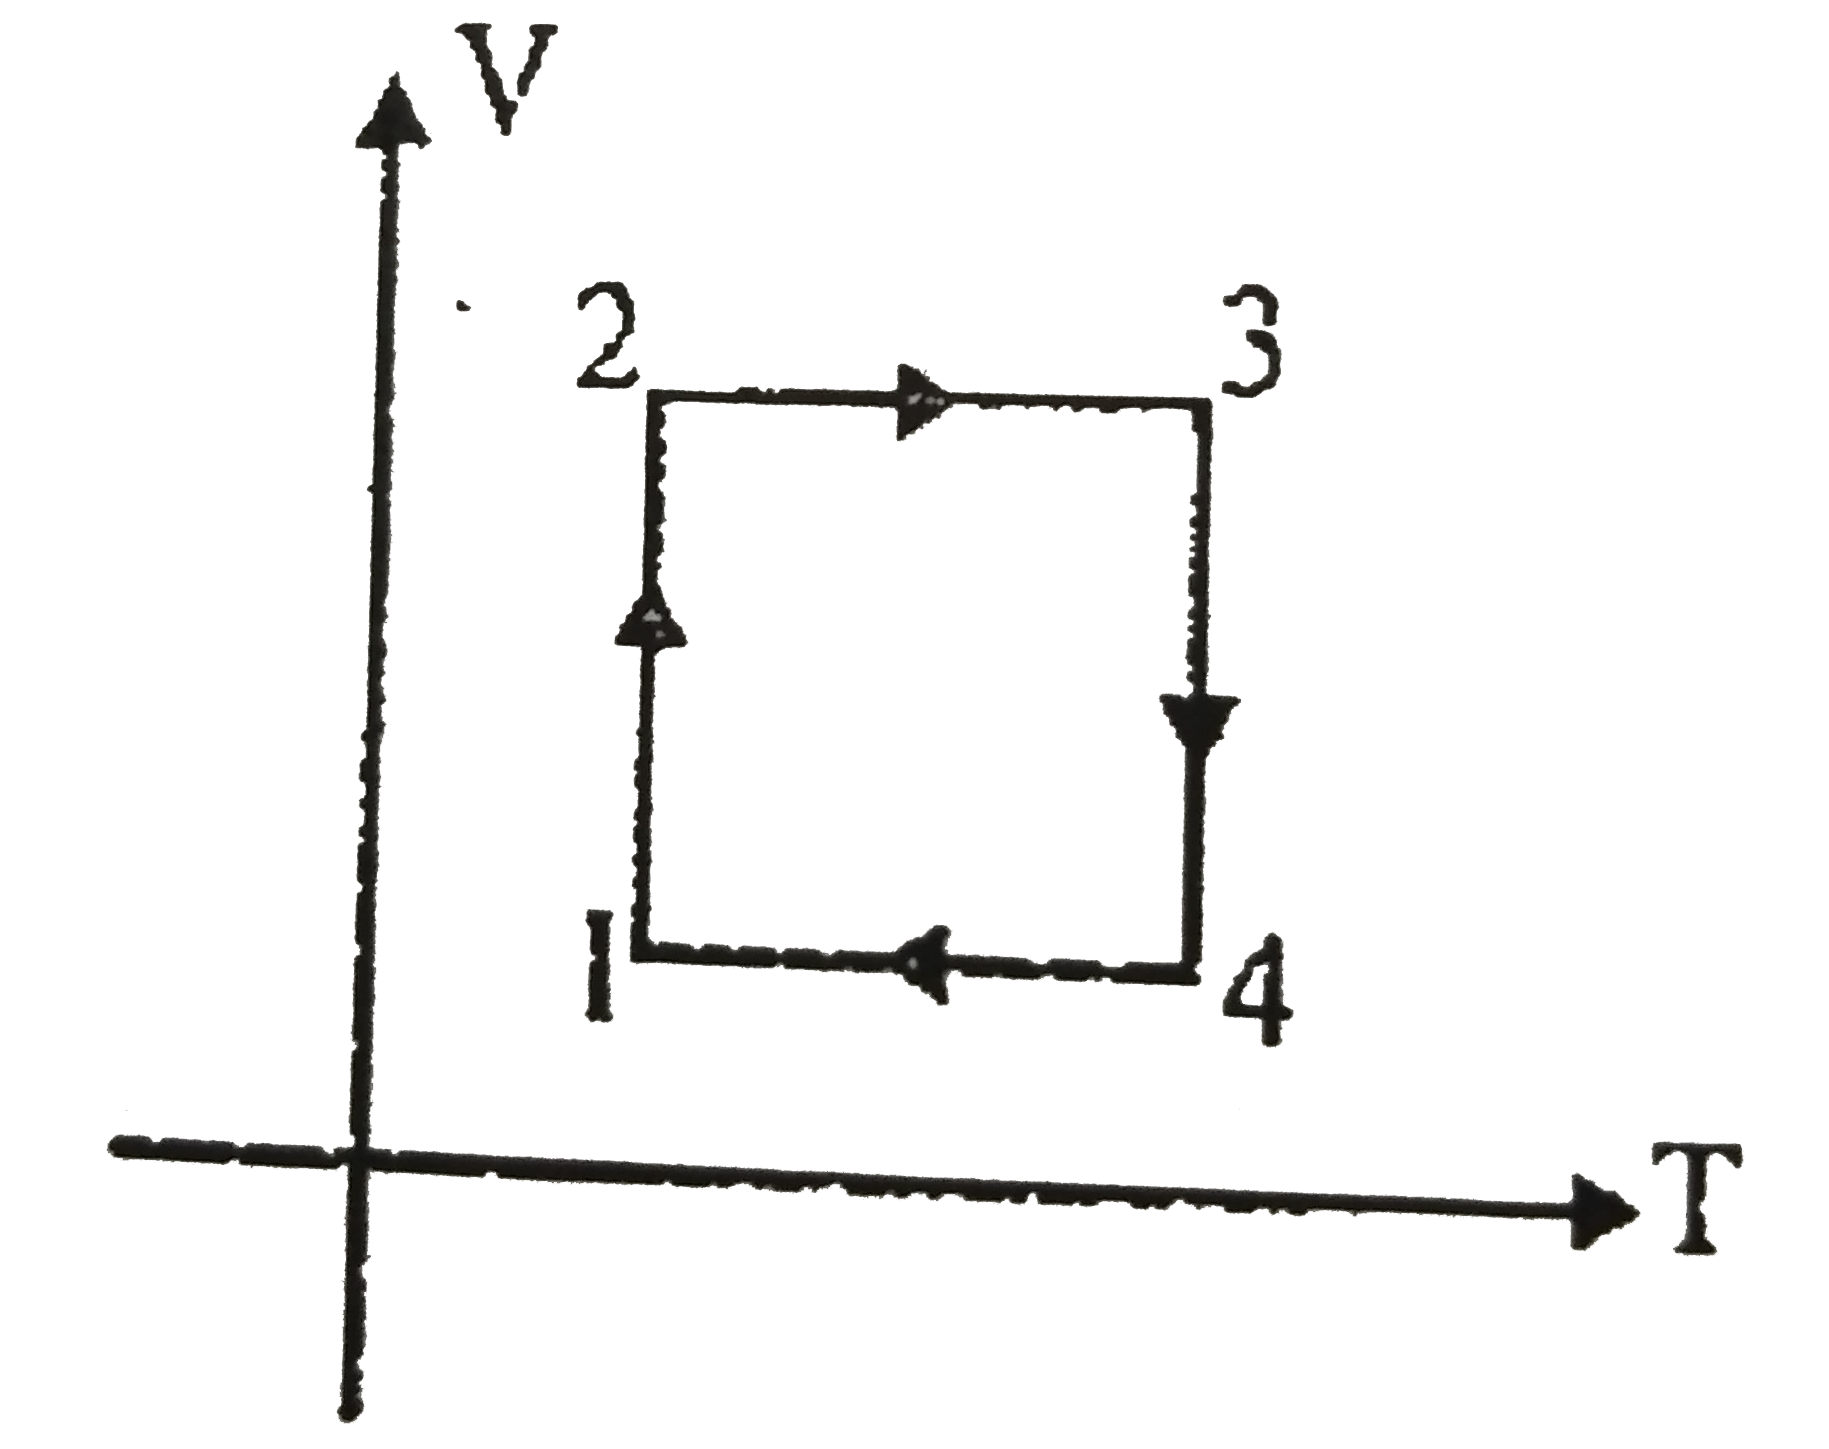
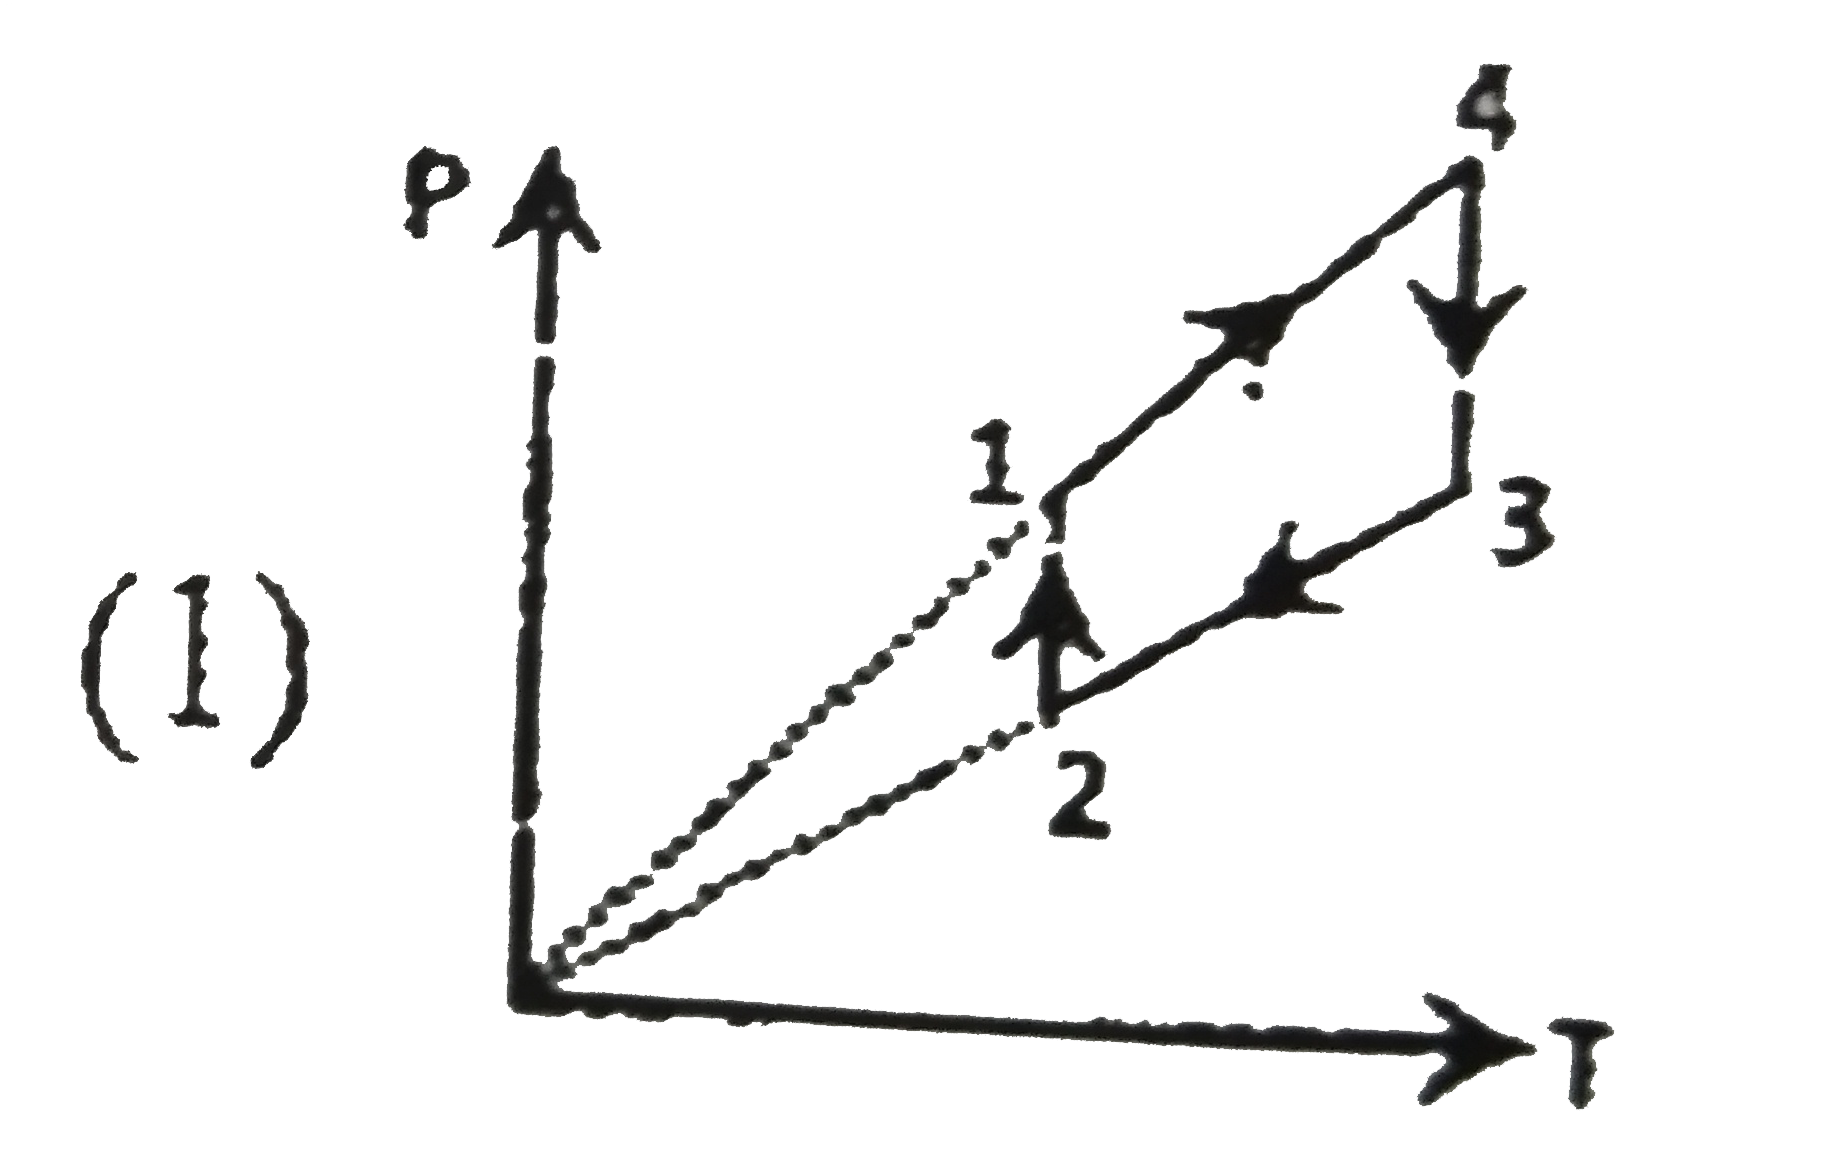
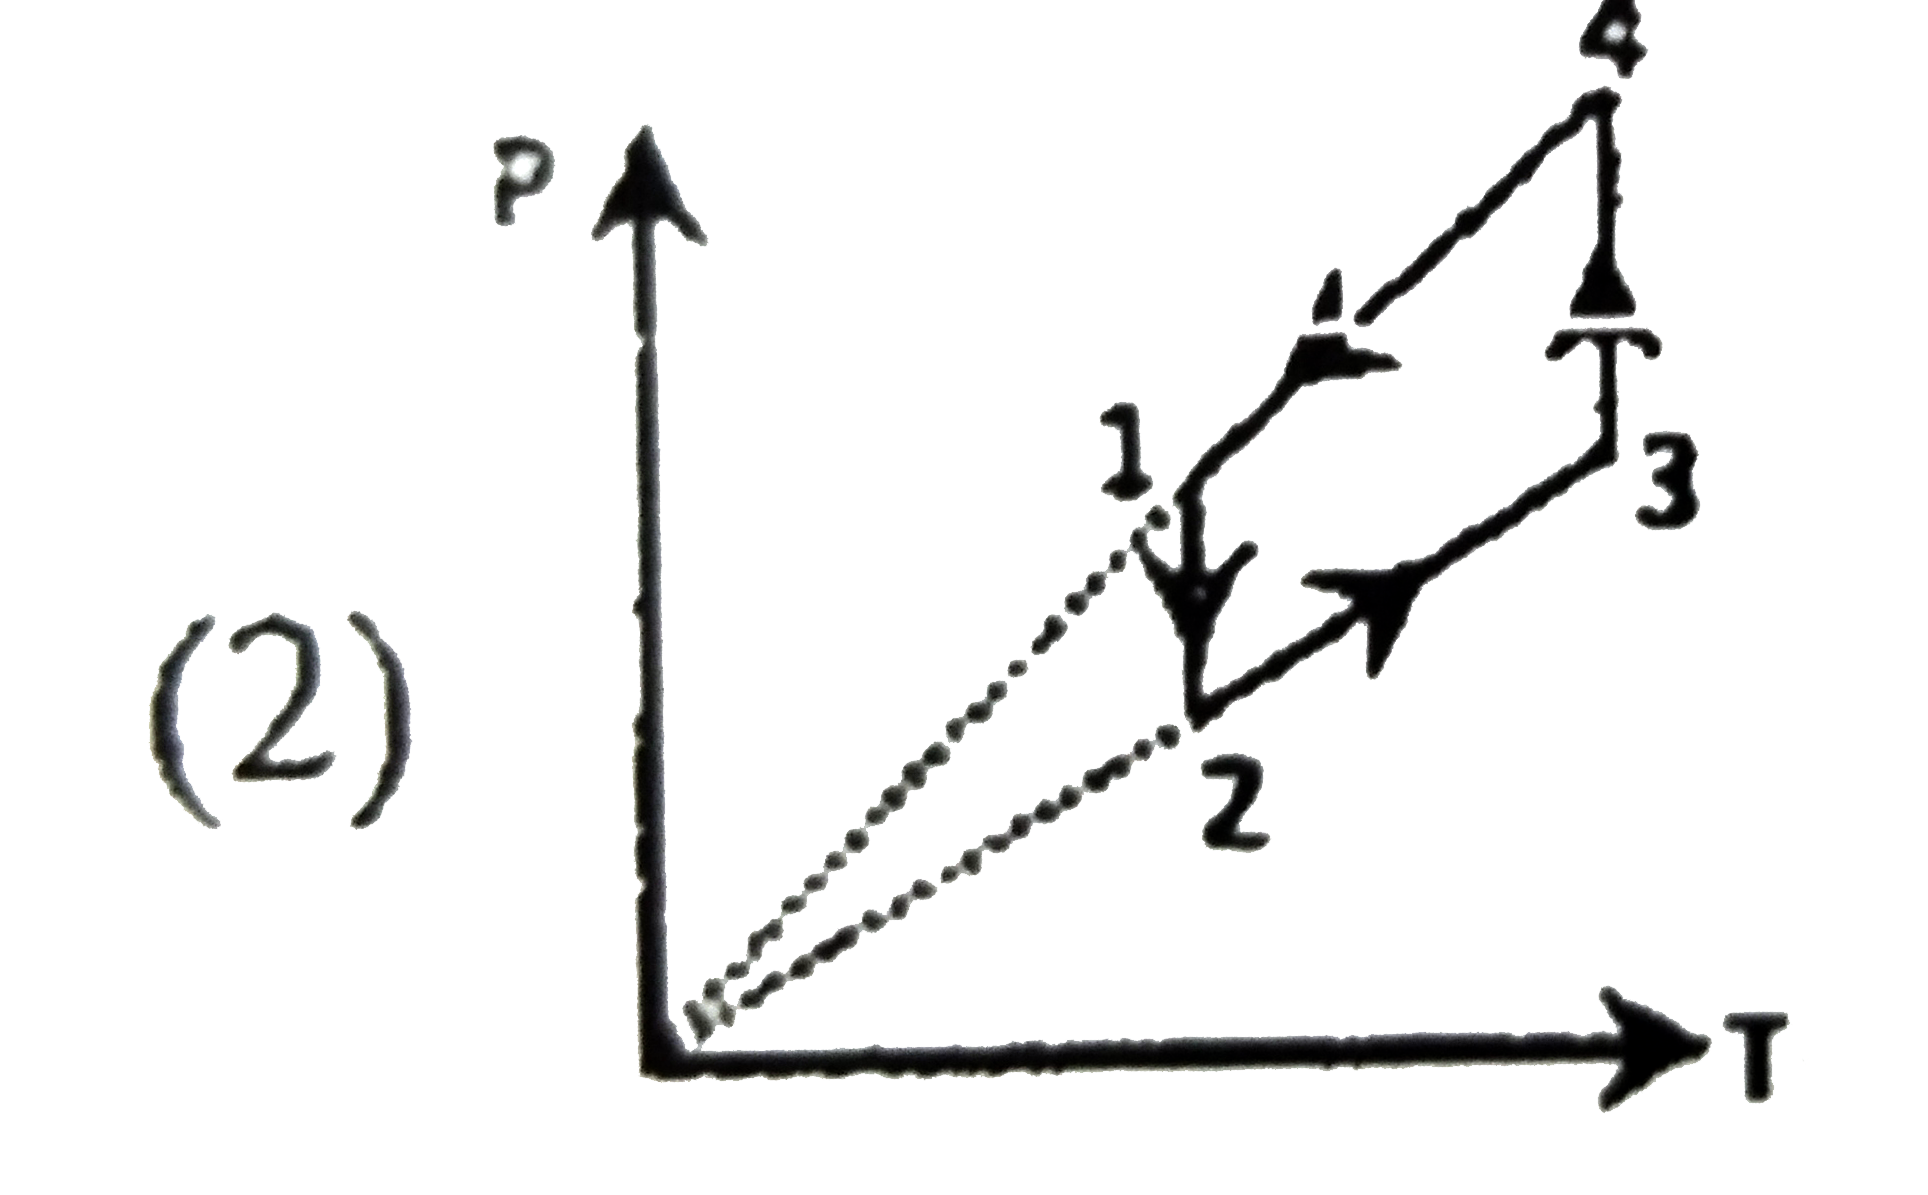
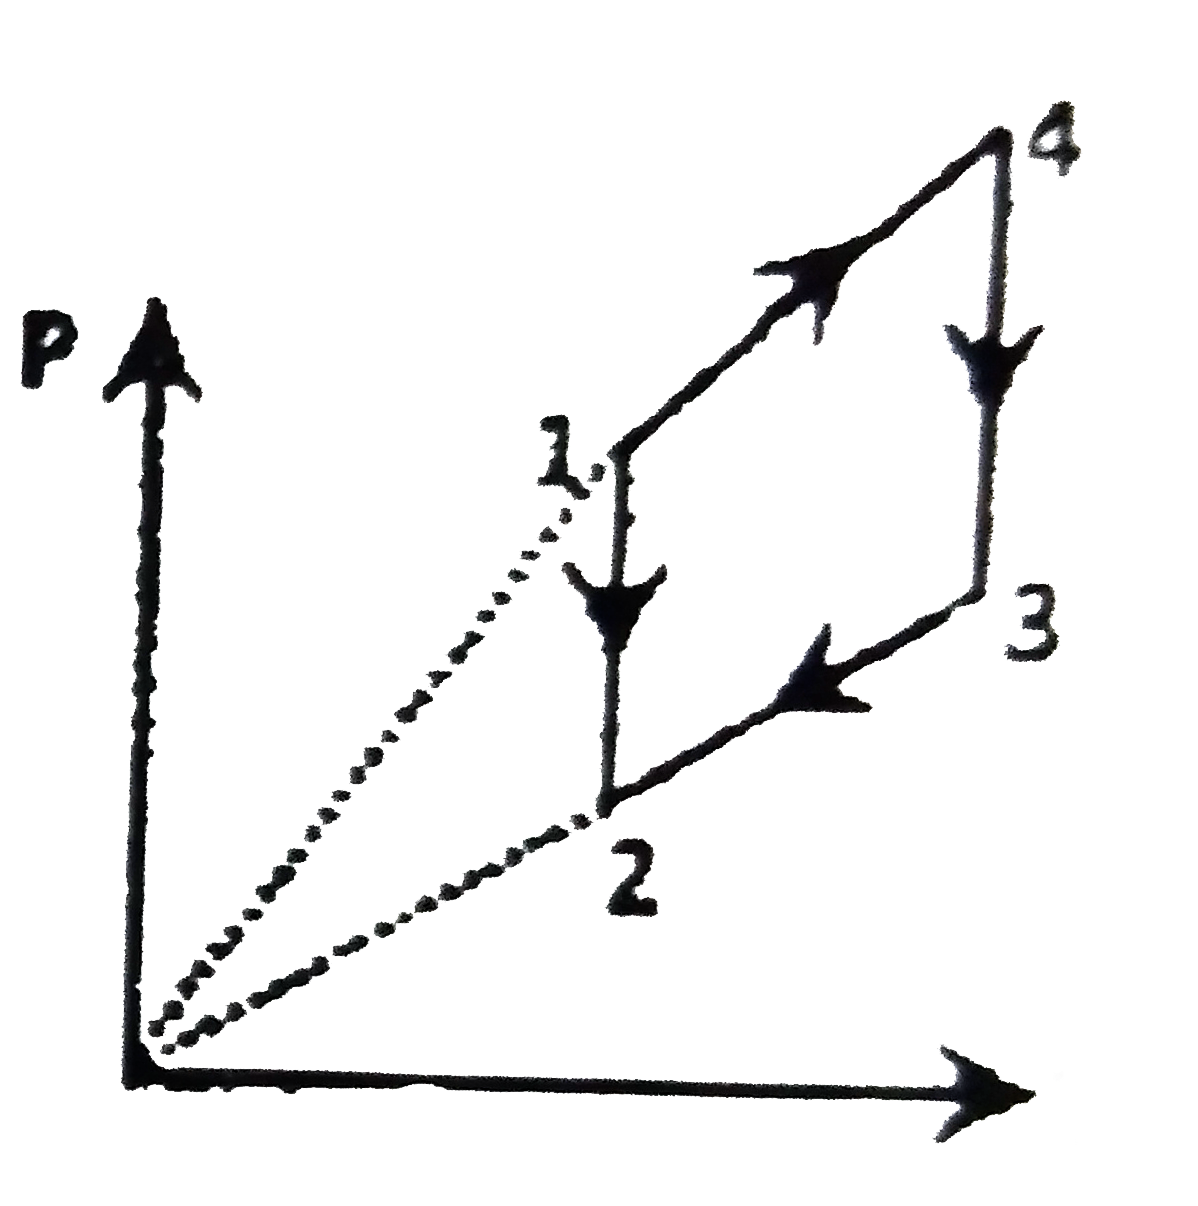
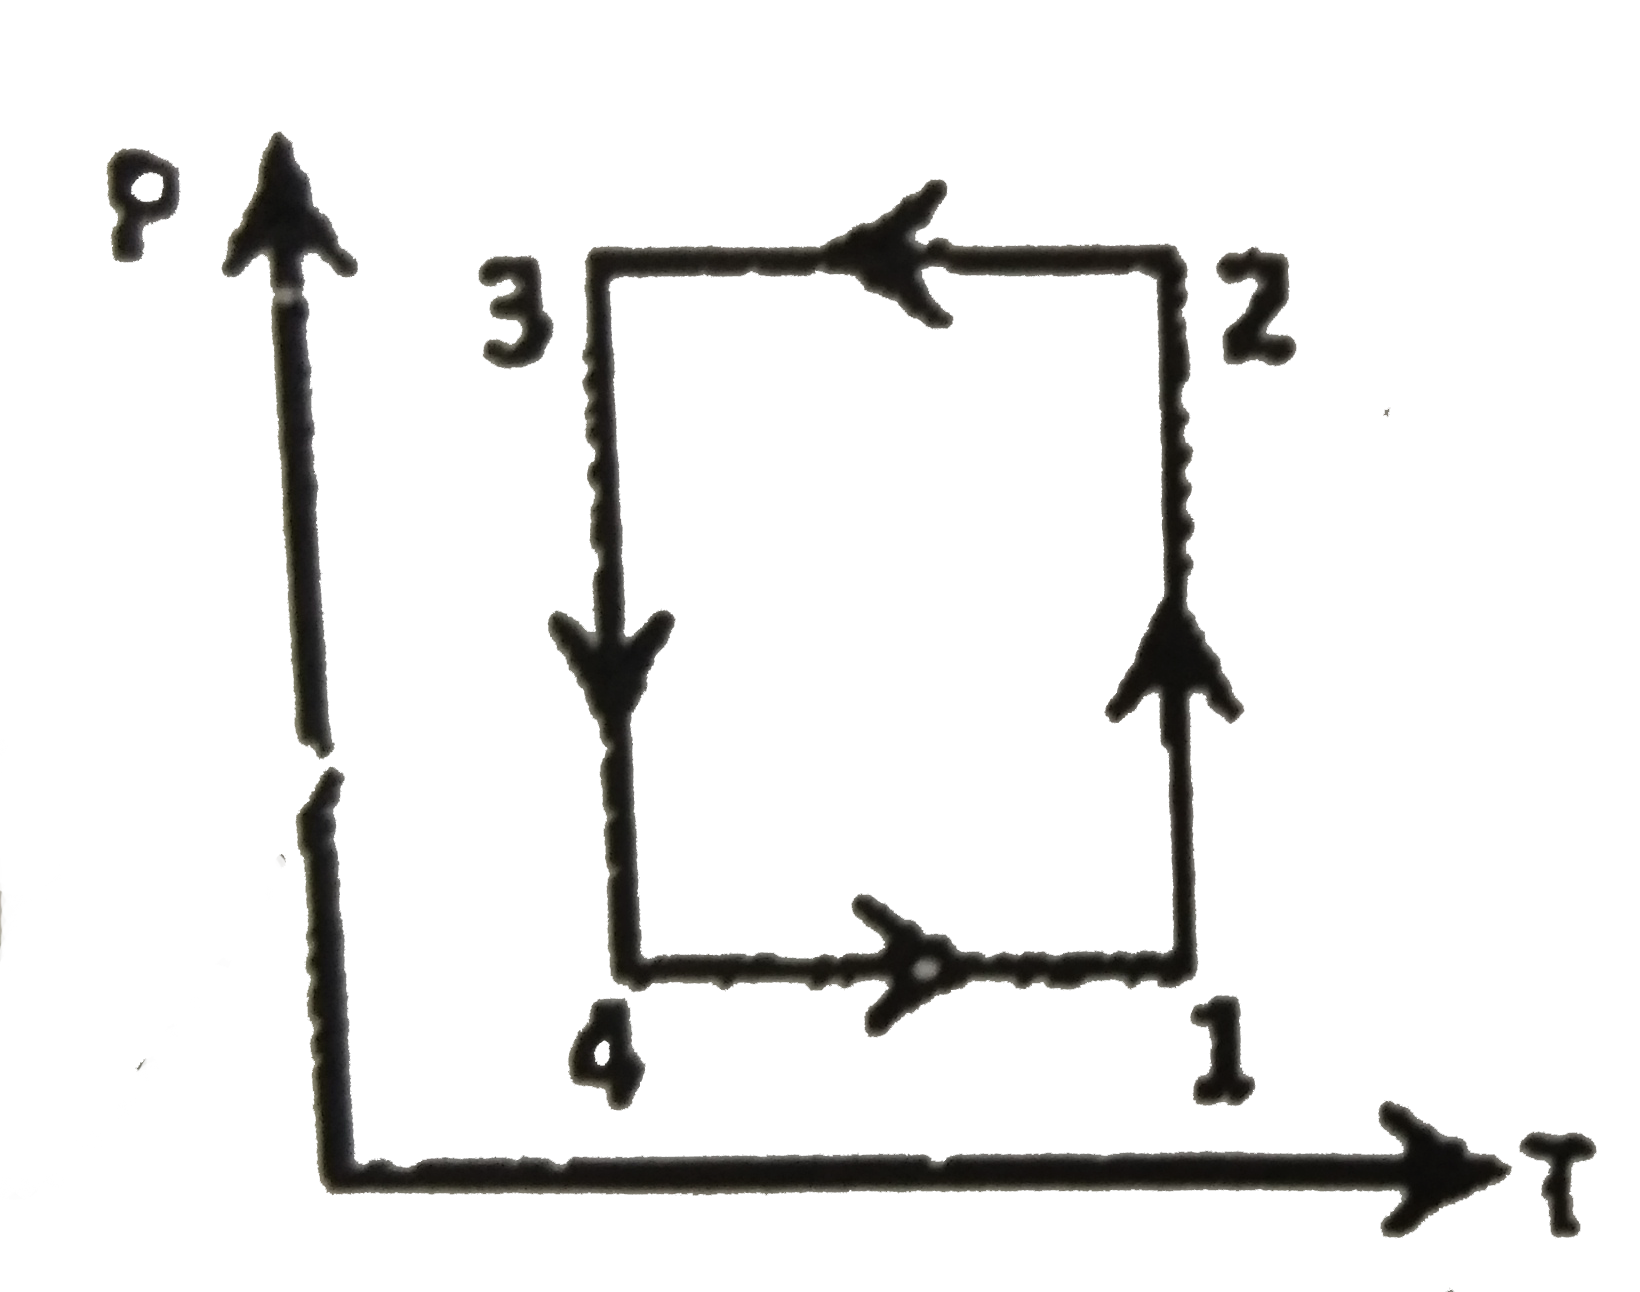
Step by step video & image solution for A gas has been subjected to a cycle of isochoric, isothermal process 1-2-3-4-1 as shown in the figure. The graph for this cycle on P-T diagram is by Chemistry experts to help you in doubts & scoring excellent marks in Class 12 exams.
Updated on:21/07/2023Topper's Solved these Questions
- TEST PAPERSBOOK - BANSALCHAPTER - TEST PAPERSEXERCISE - CHEMISTRY PART (A)
14 Videos
- TEST PAPERSBOOK - BANSALCHAPTER - TEST PAPERSEXERCISE - CHEMISTRY PART (B)
1 Videos
- TEST PAPERSBOOK - BANSALCHAPTER - TEST PAPERSEXERCISE - Chemistry PART D
4 Videos
- SOLUTIONSBOOK - BANSALCHAPTER - SOLUTIONSEXERCISE - Exercise4
32 Videos
- THERMOCHEMISTRYBOOK - BANSALCHAPTER - THERMOCHEMISTRYEXERCISE - Exercise 4
15 Videos
Similar Questions
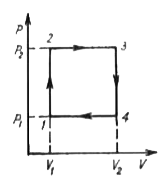
A gas has been subjected to an isochoric-isobaric cycle 1-2-3-4-1 (Fig.). Plot the graph of this cycle in the p−ρ,V−T and p-T coordinates.
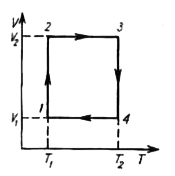
View SolutionA gas has been subjected to isothermal-isochoric cycle 1-2-3-4-1 (Fig.). Plot the graph of this cycle in p−V,p−ρ, and p-T coordinates.
View Solution
Knowledge Check
In the cyclic process shown in the figure, the work done by the gas in one cycle is
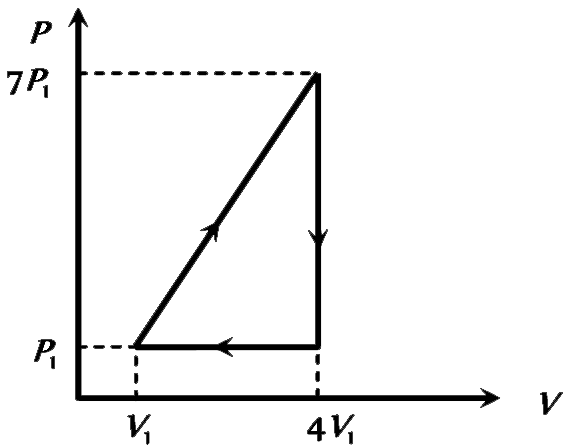 A28P1V1B14P1V1C18P1V1D9P1V1
A gas has been subjected to an isochoric and isobaric cycle. Plot of the graph of this cycle in the pressure-density, V-T and P-T co-ordinates are given below. Choose the correct plots.
 A
A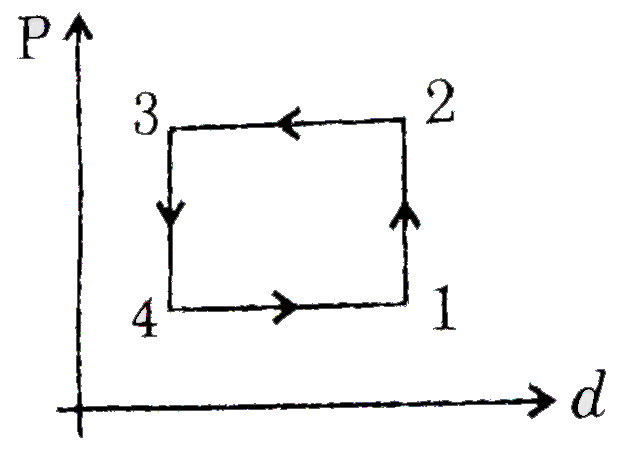 B
B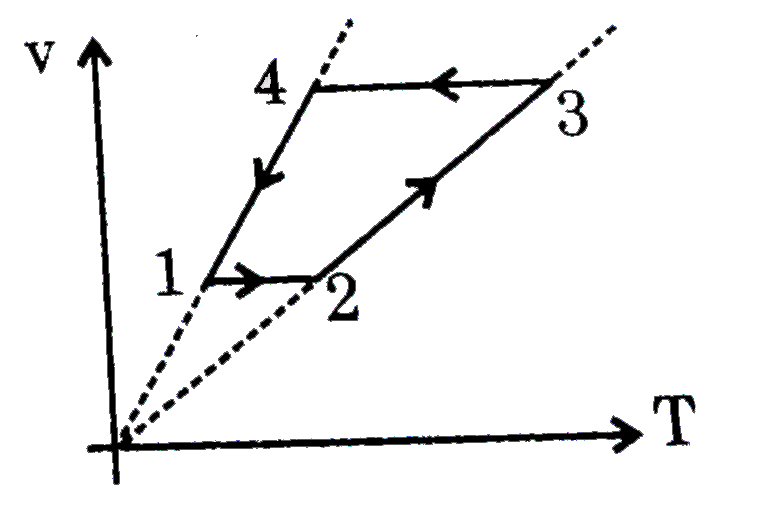 C
C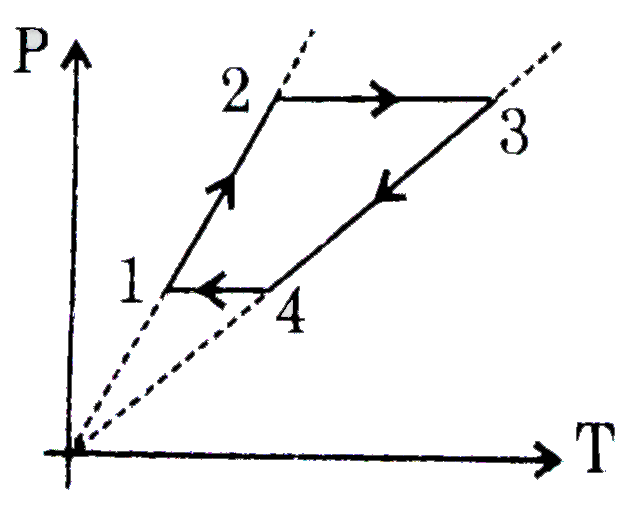 DNone of these
Helium gas goes through a cycle ABCDA (consisting of two isochoric and isobaric lines) as shown in figure Efficiency of this cycle is nearly: (Assume the gas to be close to ideal gas)
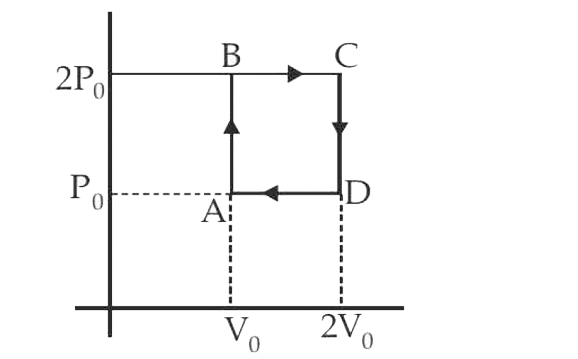 A15.4%B9.1%C10.5%D12.5%
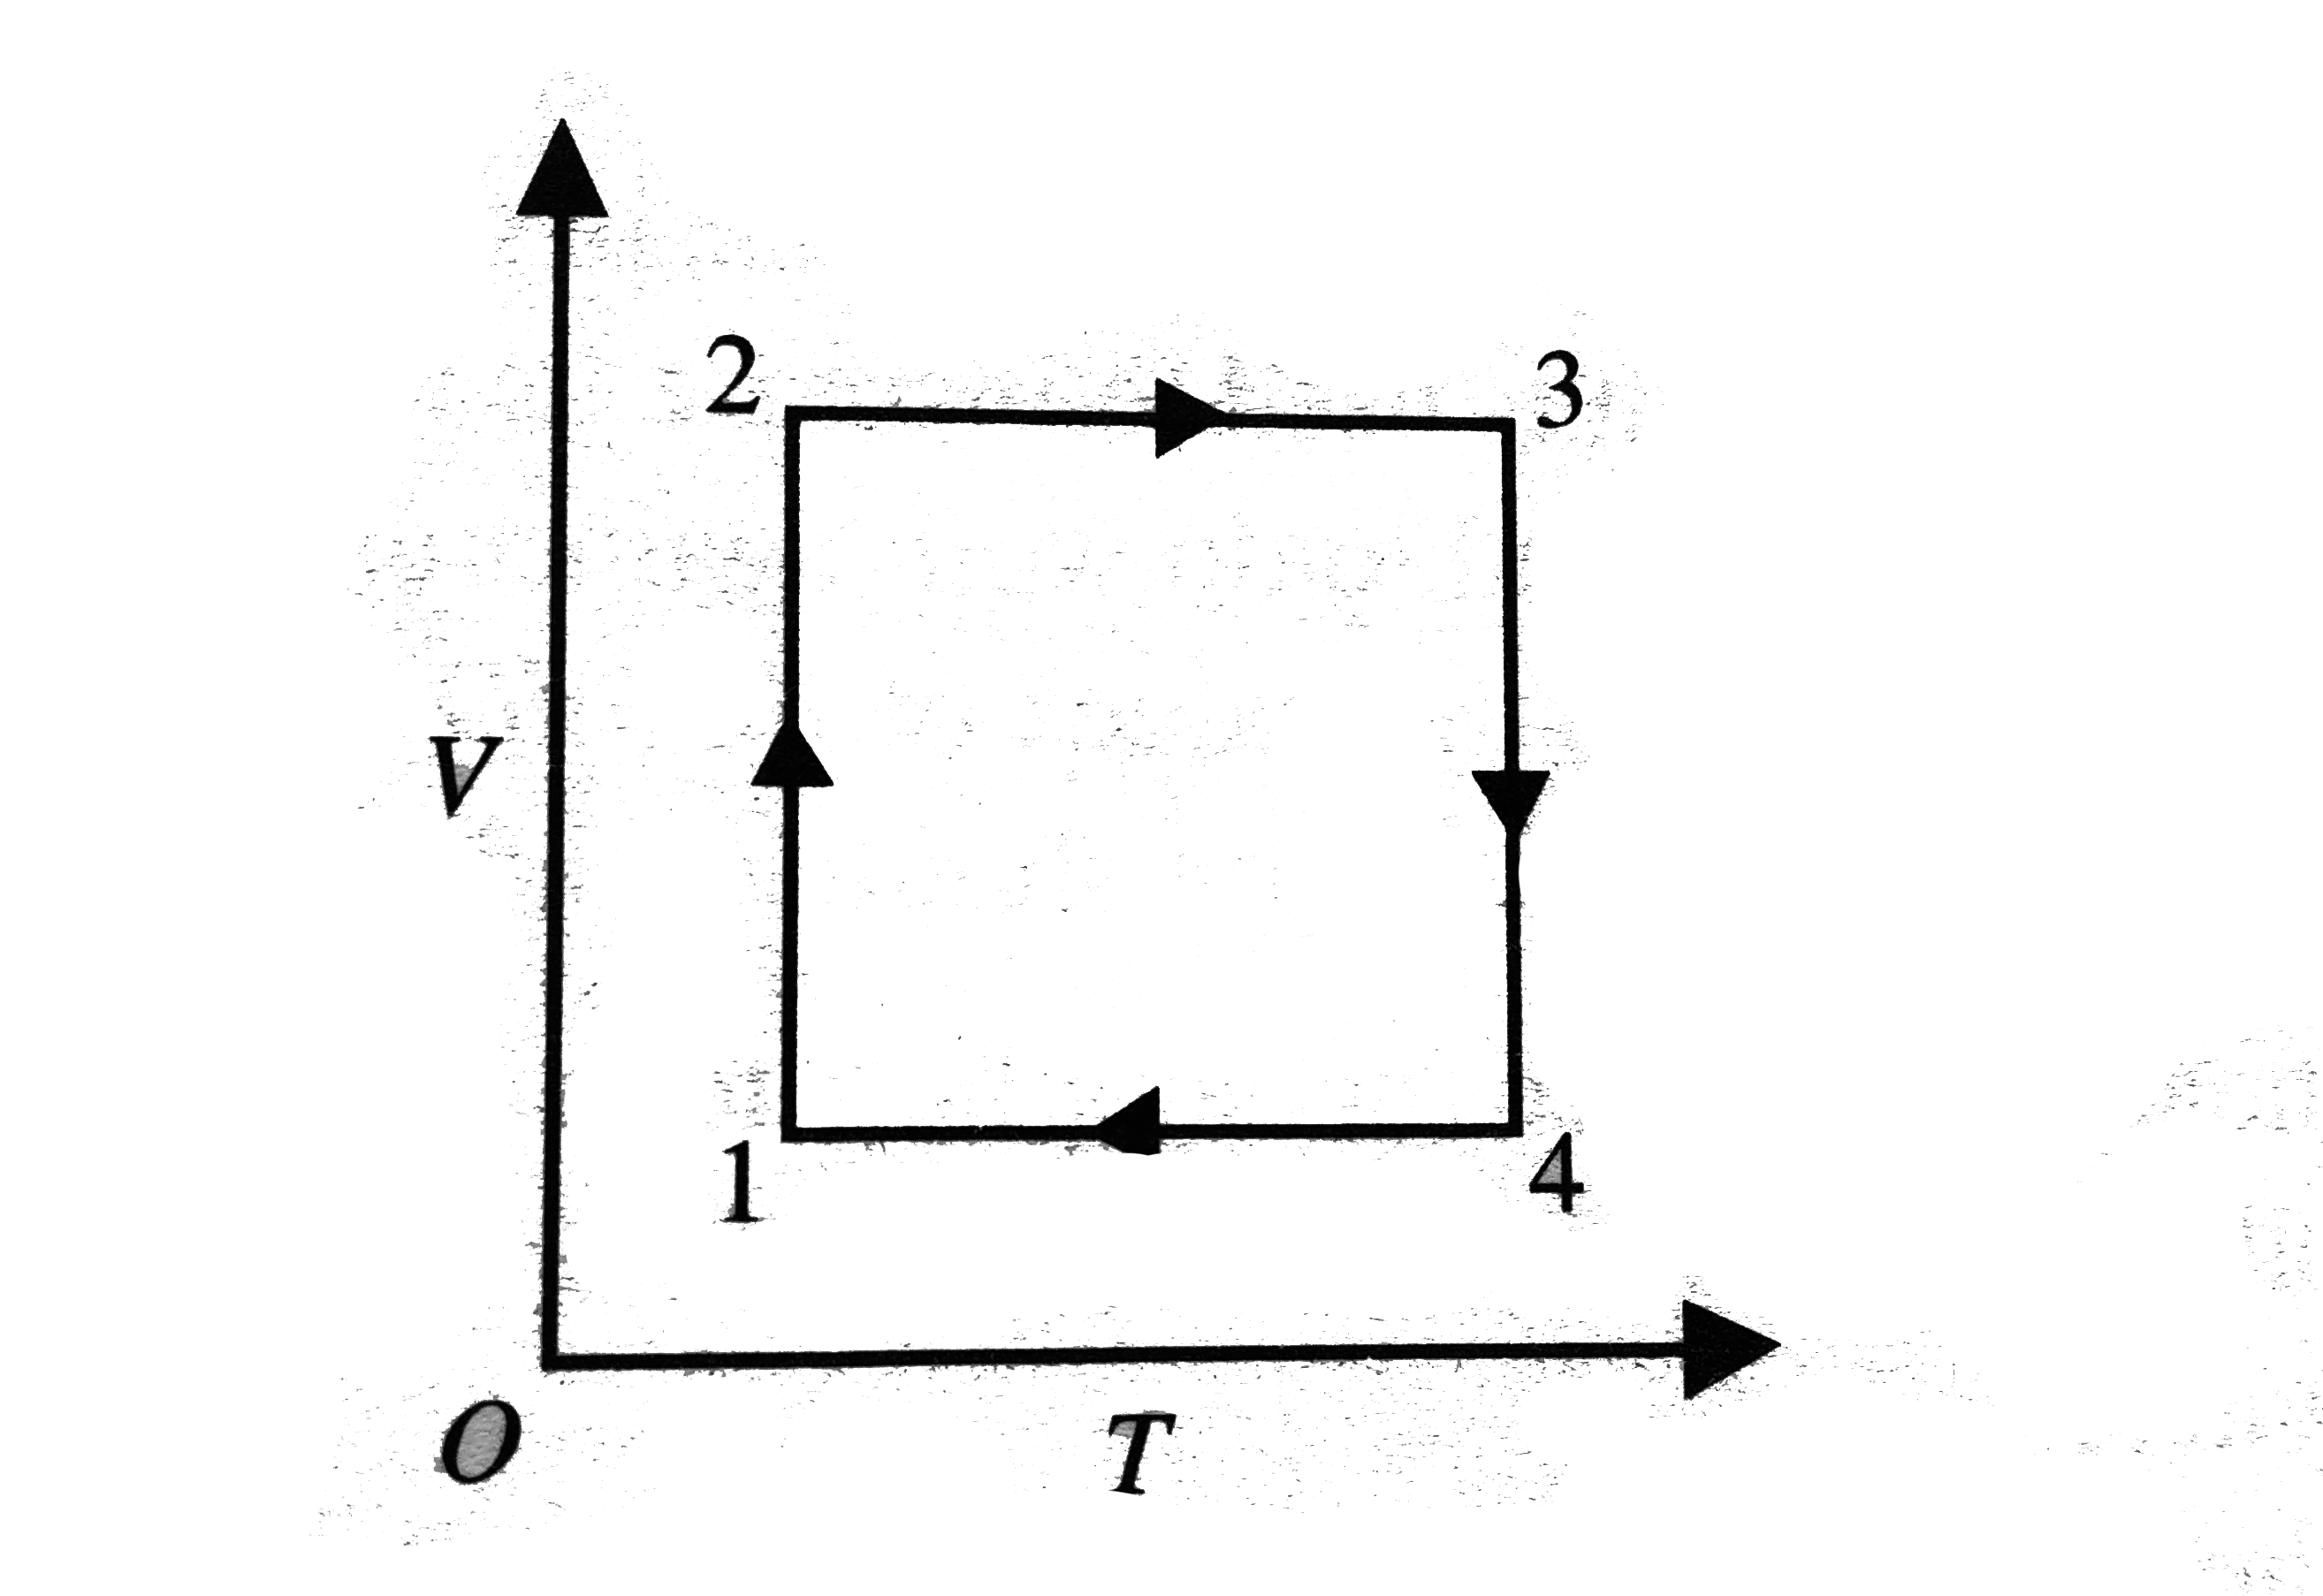
A gas has been subjected to isochoric-isobaric processes 1-2-3-4-1 see Fig. Plot this process on T - V and P - T diagrams.
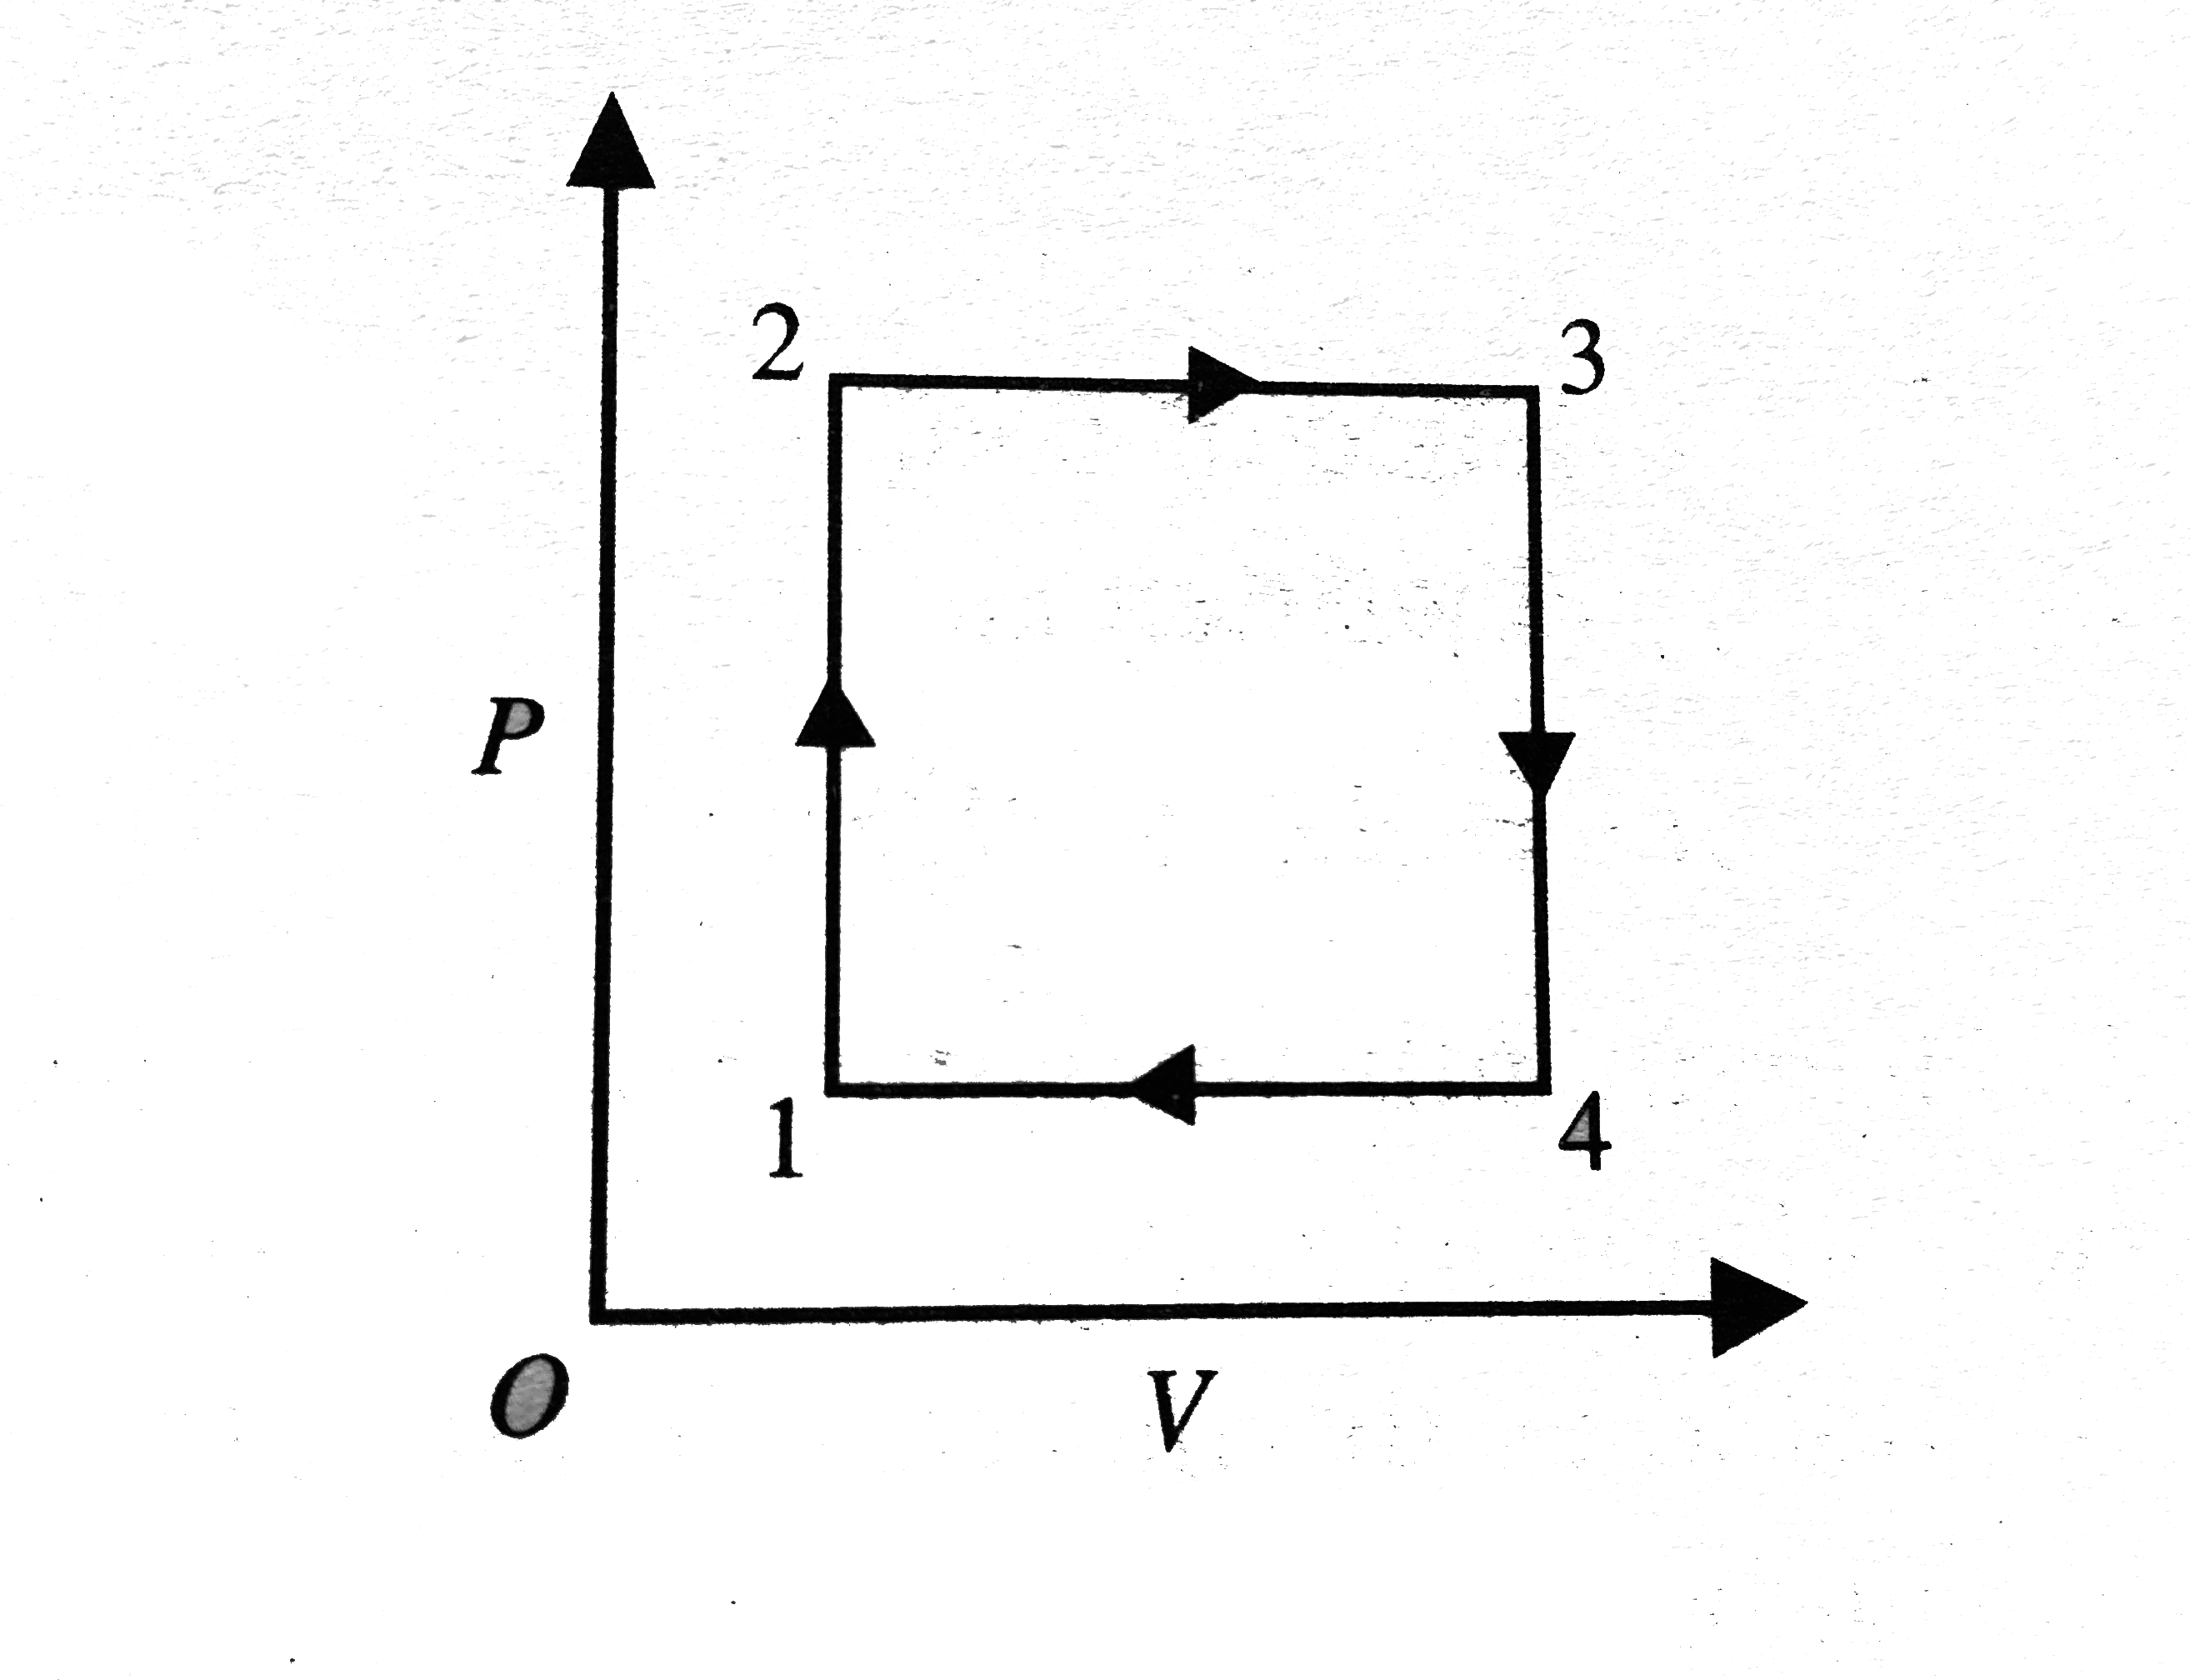
View SolutionA gas has been subjected to an isothermal-isochromic cycle 1-2-3-4-1 see Fig. Represent the same cycle on P - V and P - T diagrams.
View SolutionAn ideal gas is carried through a thermodynamic cycle consisting of two isobaric and two isothermal processes as shown in figure. Show that the net work done in the entire cycle is given by the equation. Wnet=p1(V2−V1)Inp2p1
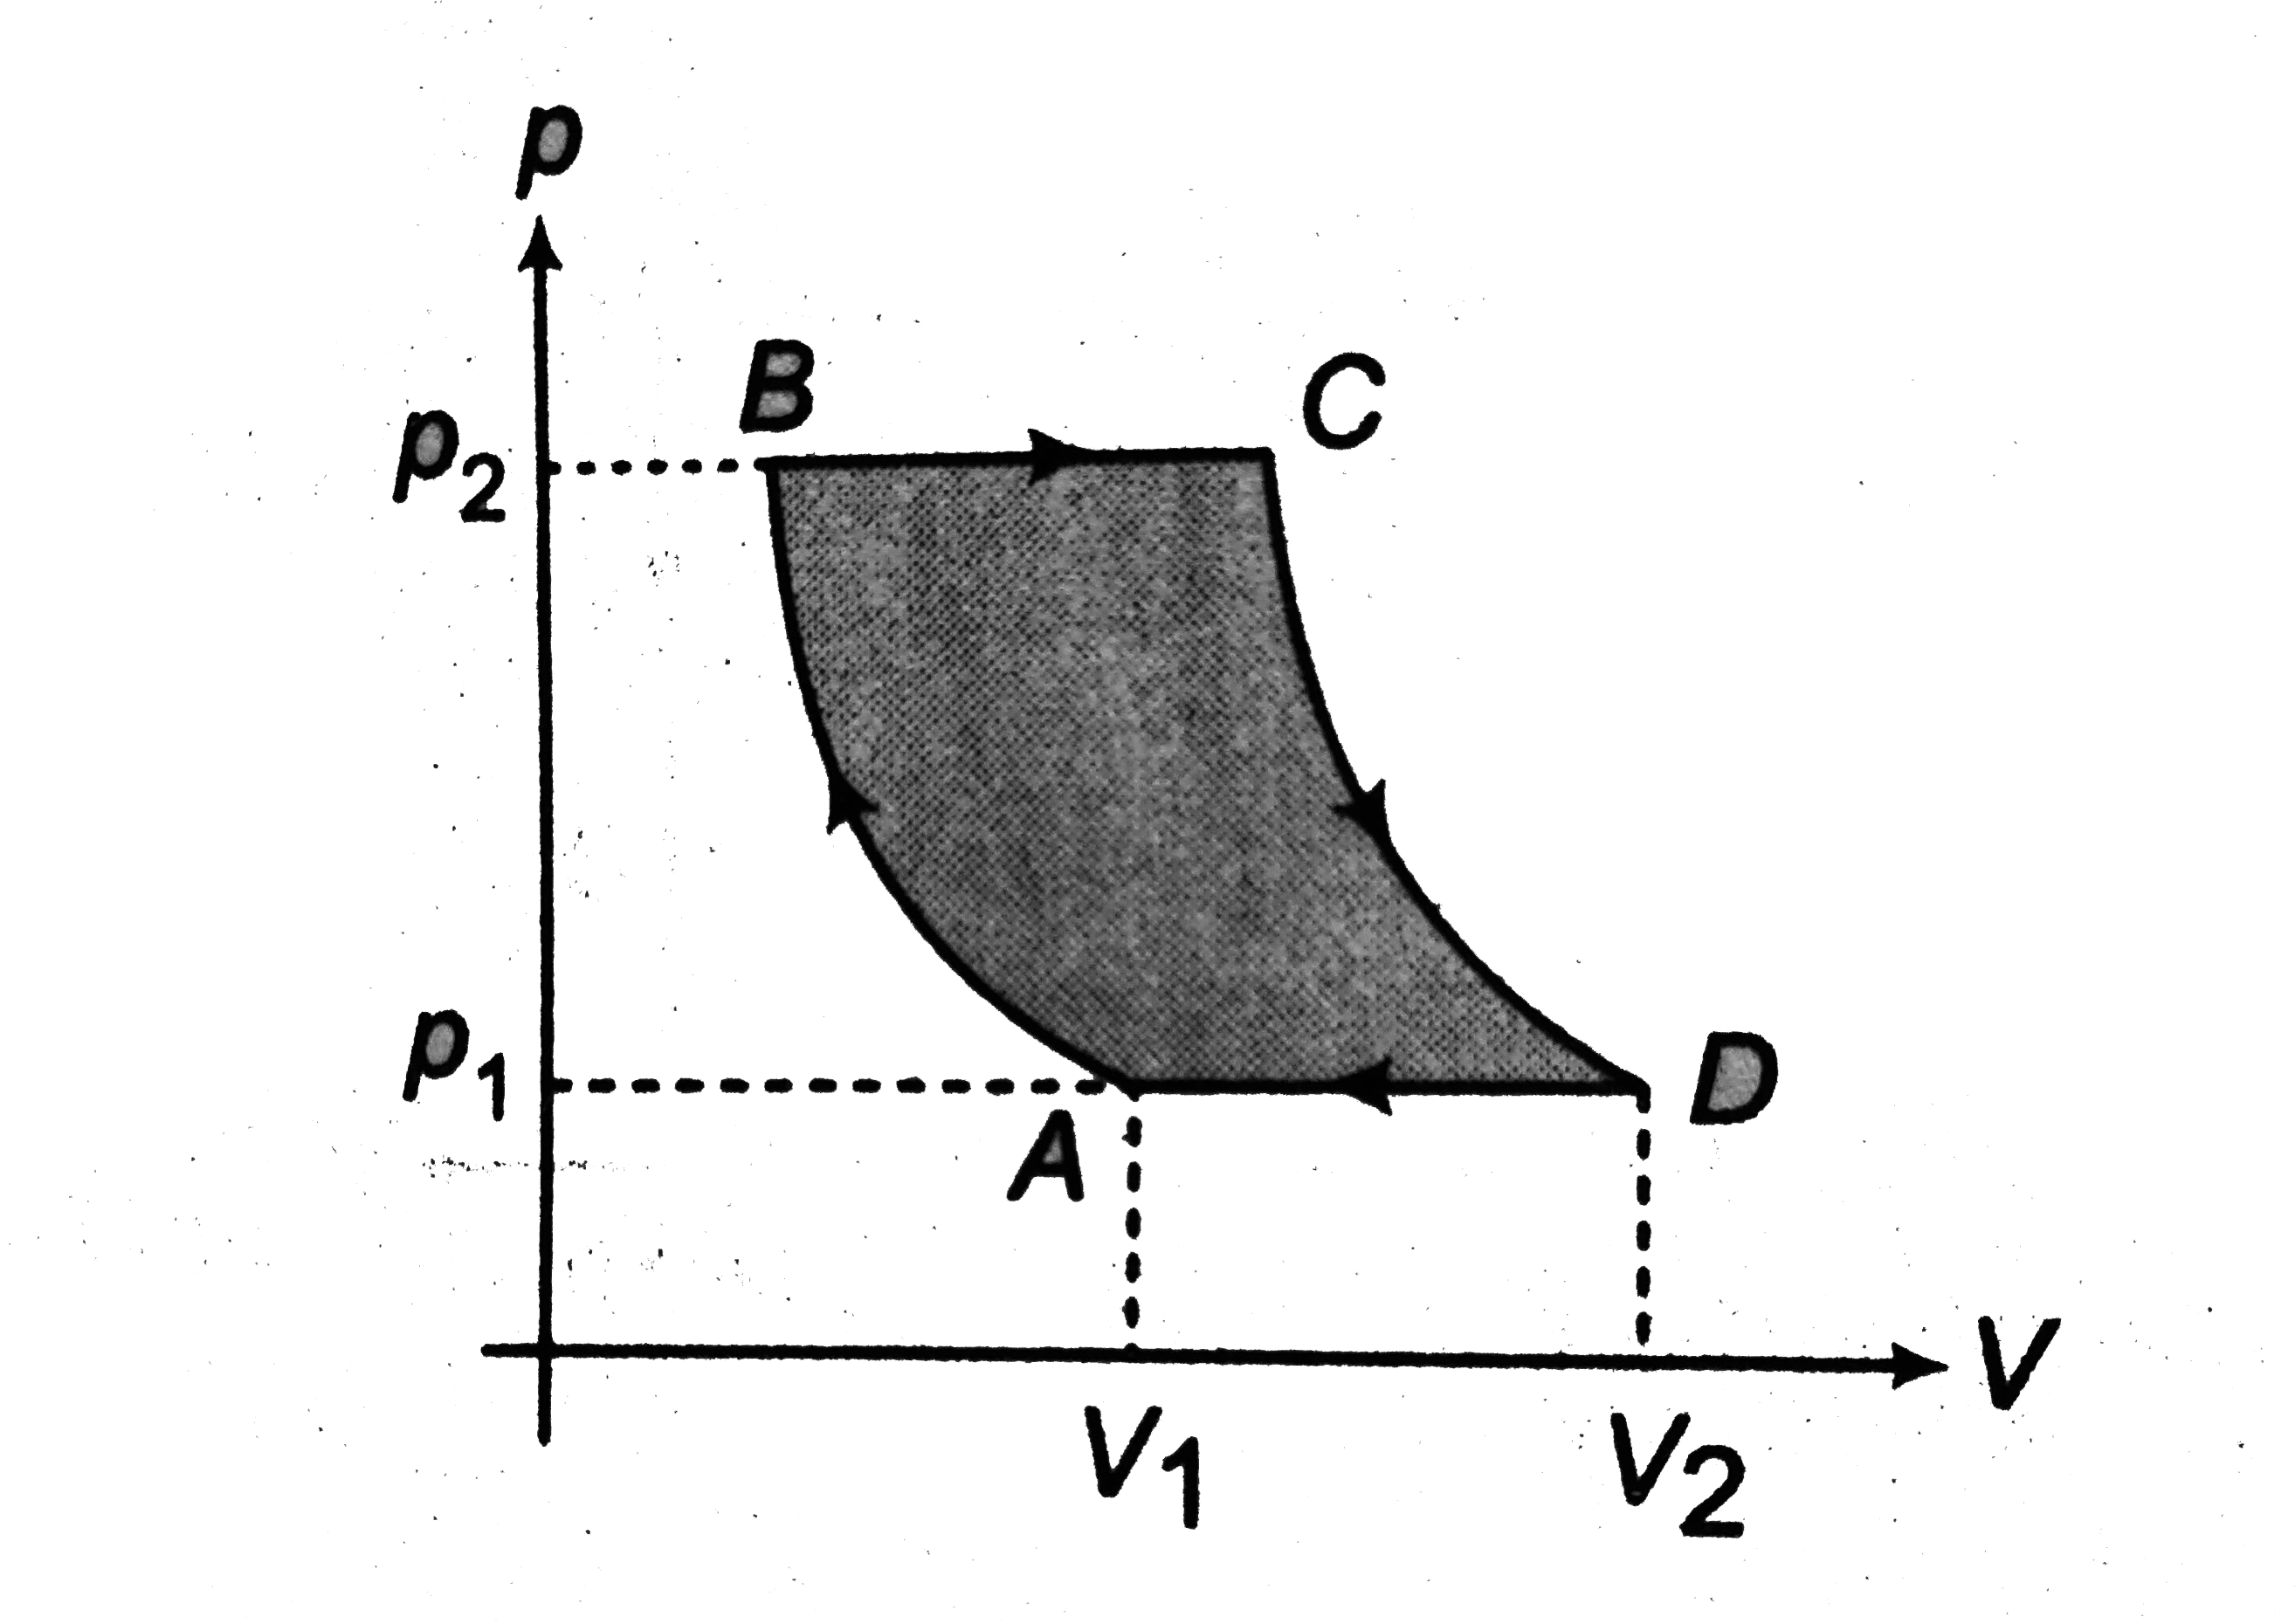
View SolutionFor one complete cycle of a thermodynamic process gas as shown in the P-V diagram, which of following correct?
View SolutionHelium gas goes through a cycle ABCDA (consisting of two isochoric and isobaric lines) as shown in figure Efficiency of this cycle is nearly: (Assume the gas to be close to ideal gas)

View Solution
