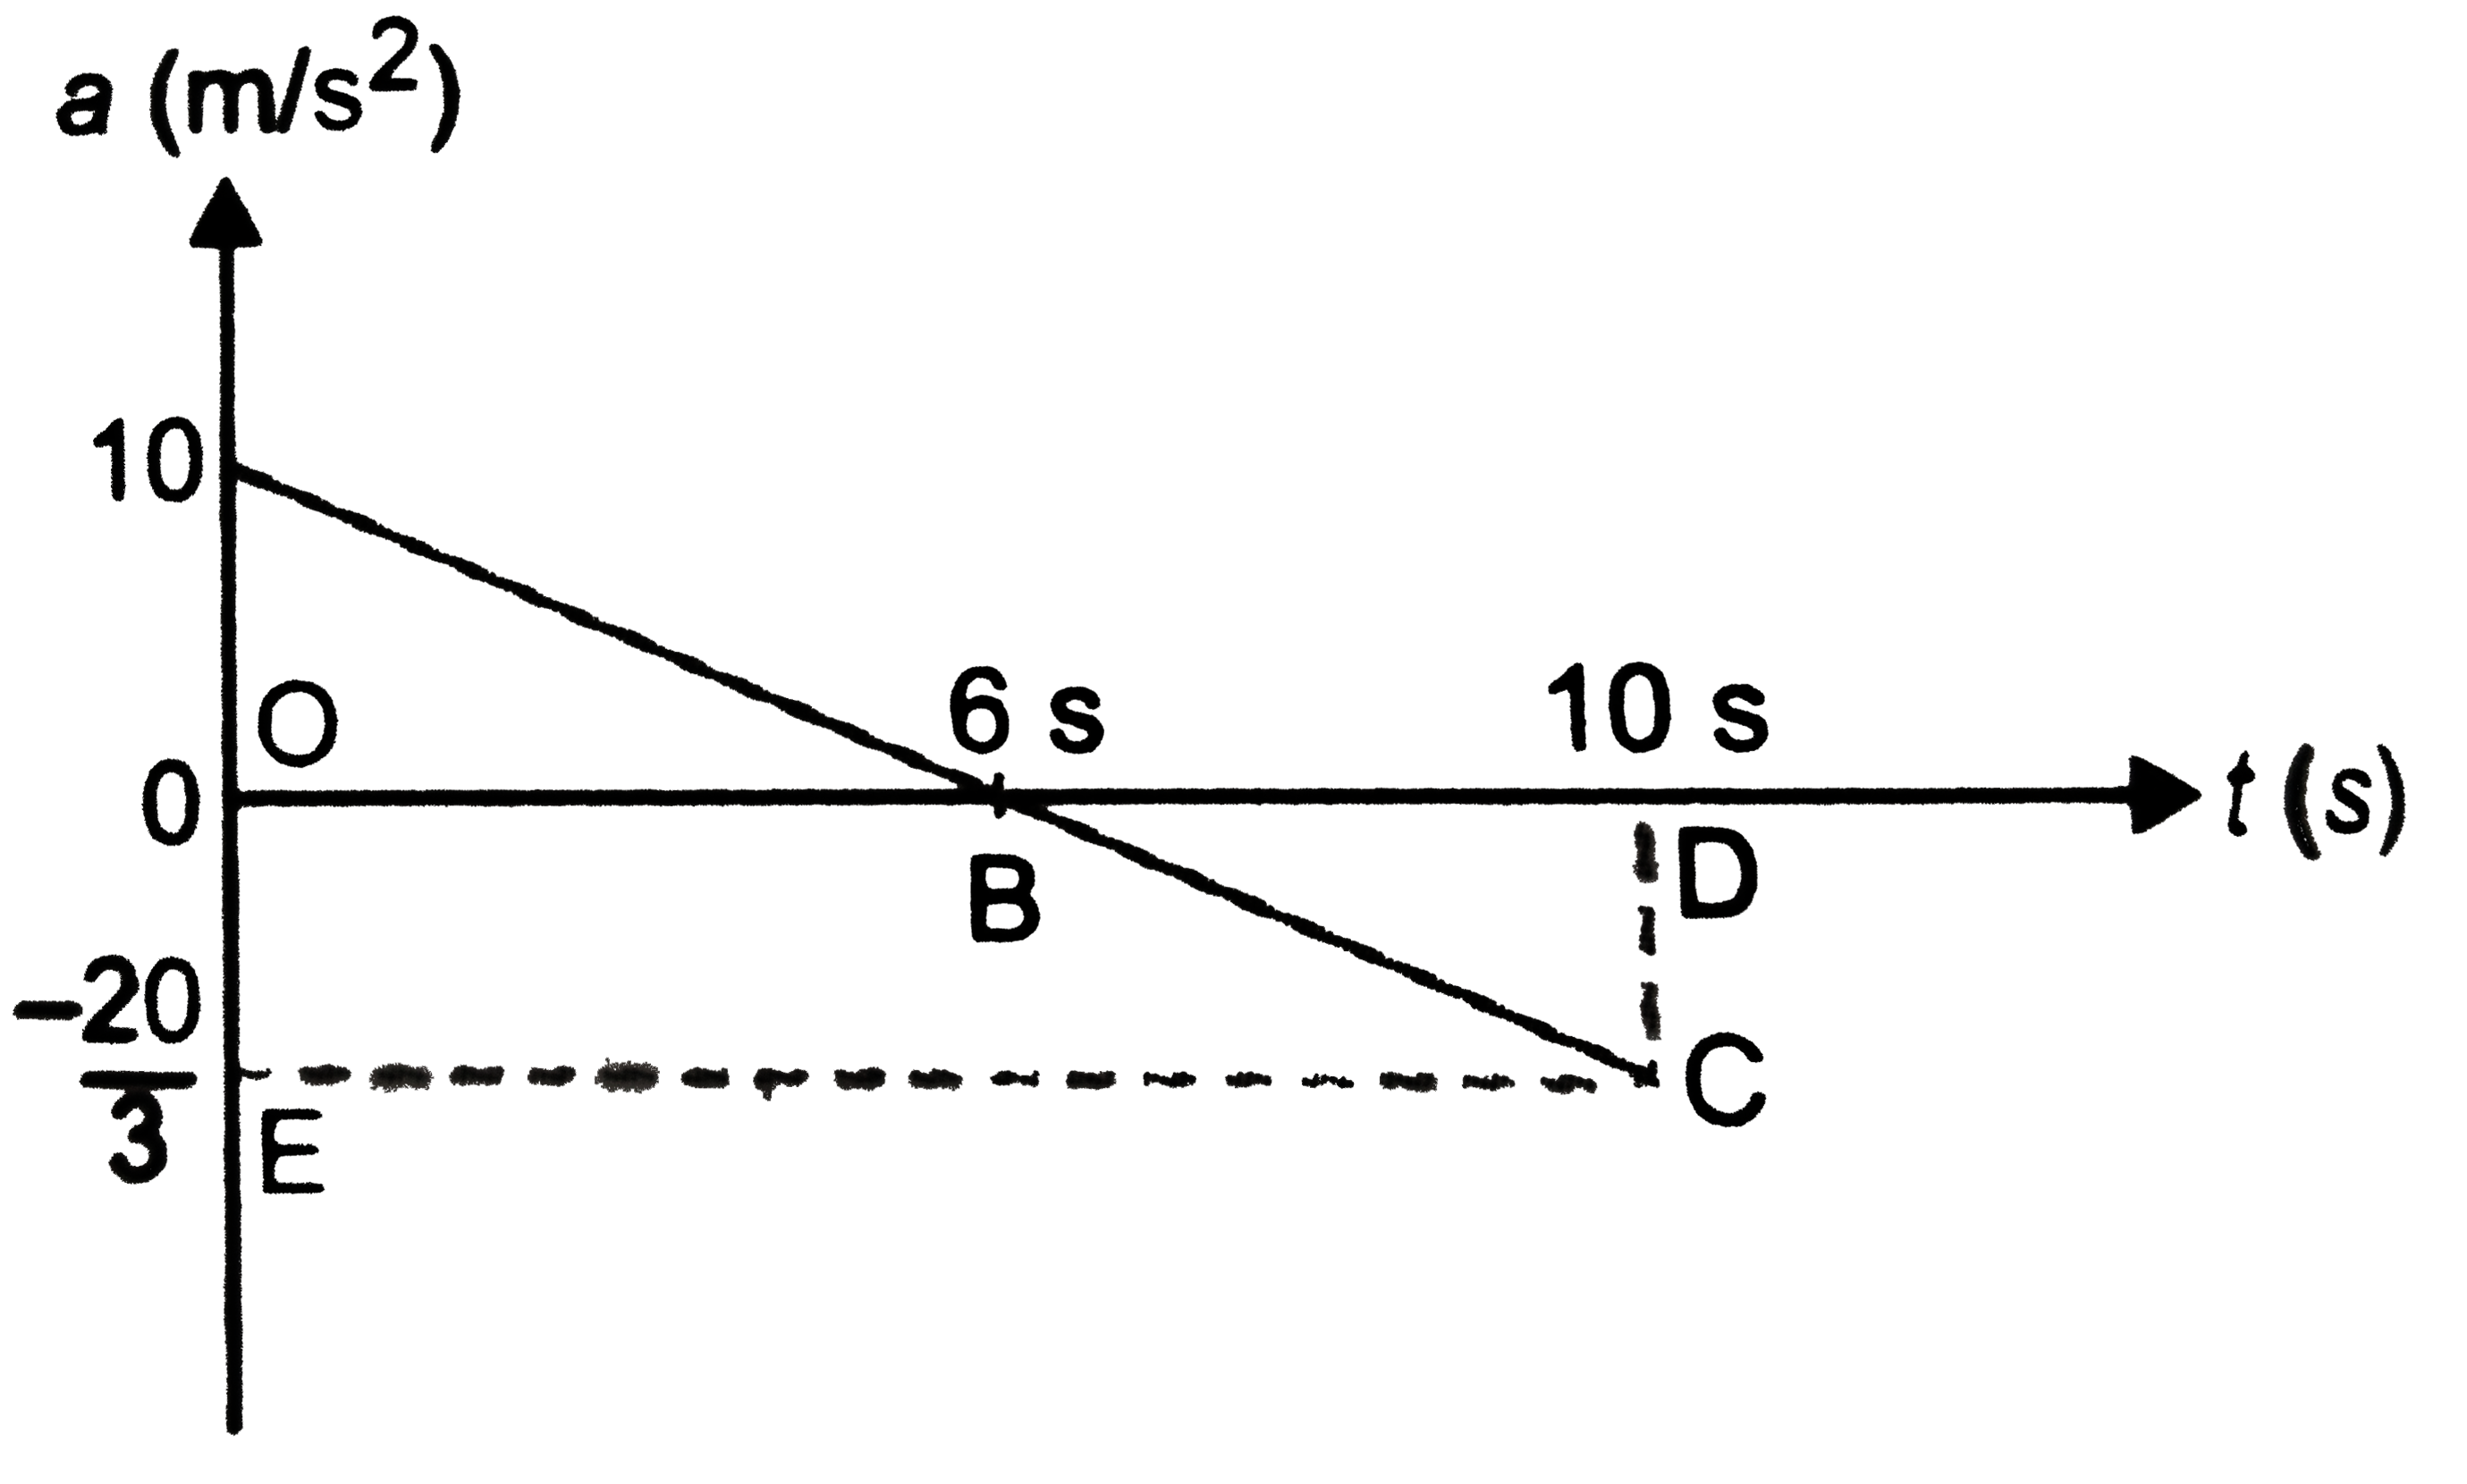
The acceleration time graph of a particle is shown in the Fig. 2 (CF). 11. At time t=10s is the particle is 8ms−1. Its velocity t=10s is.
 .
.
(a) (50)/3 ma^(-1)
(b) (70)/3 ma^(-1)
(c ) 743ms−1
(d) (144)/3 ms^(-1)
The correct Answer is:C
As, acceleration = (change in velocity)/(time taken)<bR>∴Chan≥∈velocity=ae≤ration×timetaken<br>Hence,chan≥∈velocity∈ 10 s=area OAB<br>+area BCD<br> = 1/2 xx 6 xx 10 +1/2 xx (10 -6 ) xx (- (20)/3)<br>= 30 - (40)/3 = (50)/3 ms^(-1)<br>∴F∈alvelocityat 10 s=initail veloicty+change in velocity = 8 + (50)/3 = (74)/3 ma^(-1).
Topper's Solved these Questions
- BOOK - PRADEEPCHAPTER - KINEMATICSEXERCISE - 4 NCERT multiple Choice10videos
KINEMATICS
- BOOK - PRADEEPCHAPTER - KINEMATICSEXERCISE - 4 NCERT Integer type4videos
KINEMATICS
- BOOK - PRADEEPCHAPTER - KINEMATICSEXERCISE - 2 NCERT multiple15videos
KINEMATICS
- BOOK - PRADEEPCHAPTER - GRAVIATIONEXERCISE - Assertion-Reason Type Questions19videos
GRAVIATION
- BOOK - PRADEEPCHAPTER - LAWS OF MOTIONEXERCISE - Assertion- Reason Type Questions17videos
LAWS OF MOTION
Similar Questions
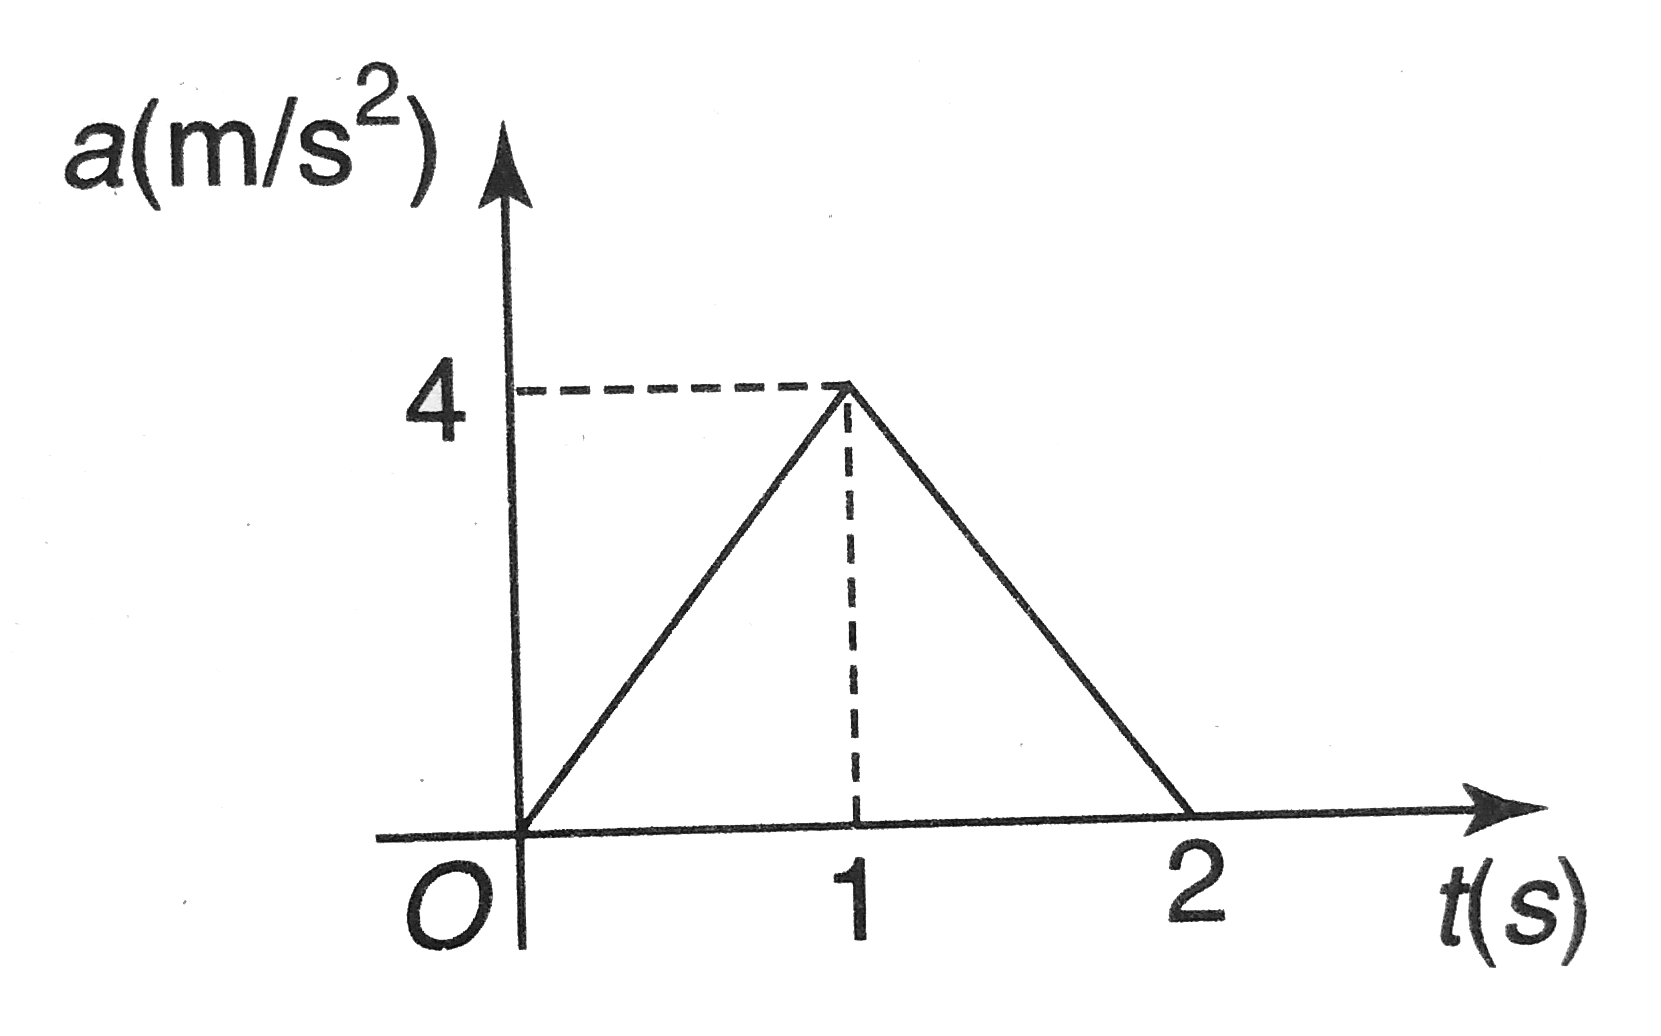
The acceleration time graph of a particle moving along a straight line is as shown in Fig.At what time the particle acquires its initial velocity?
View SolutionThe acceleration time graph of a particle moving along a straight line is as shown. The time at which the particle will have the velocity same as initial velocity (in s) is?
View Solution
Knowledge Check
- Question 1 - Select One
The acceleration time graph of a particle is shown in the figure-1.140. What is the velocity of particle at t=8s, if initial velocity of particle is 3 m/s? (Assume motion is 1 dimension) :
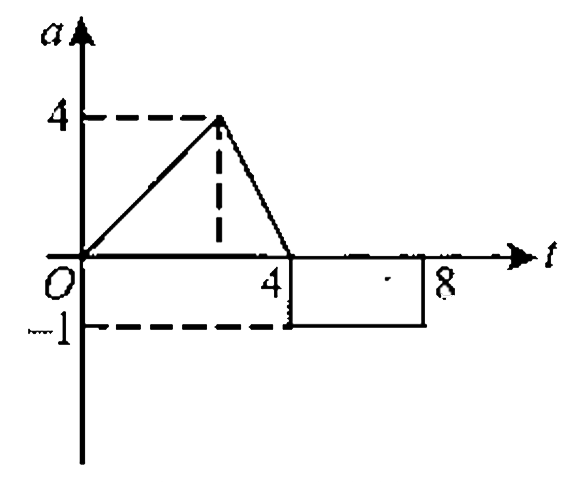 A4 m/sB5 m/sC6 m/sD7 m/s
 - Question 2 - Select One
The acceleration - time graph for a particle moving along x - axis is shown in figure, If the initial velocity of particle is −5m/s, the velocity at t = 8 s is
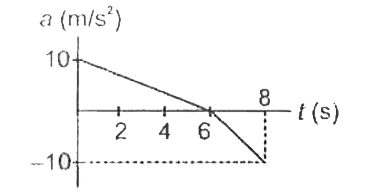 A+15m/sB+20m/sC−15m/sD−20m/s
 - Question 3 - Select One
The speed-time graph of a particle moving along a fixed direction is shown in the Fig. 2 (CF) . 15. The distance traversed by the particle between t=2s 6s is .
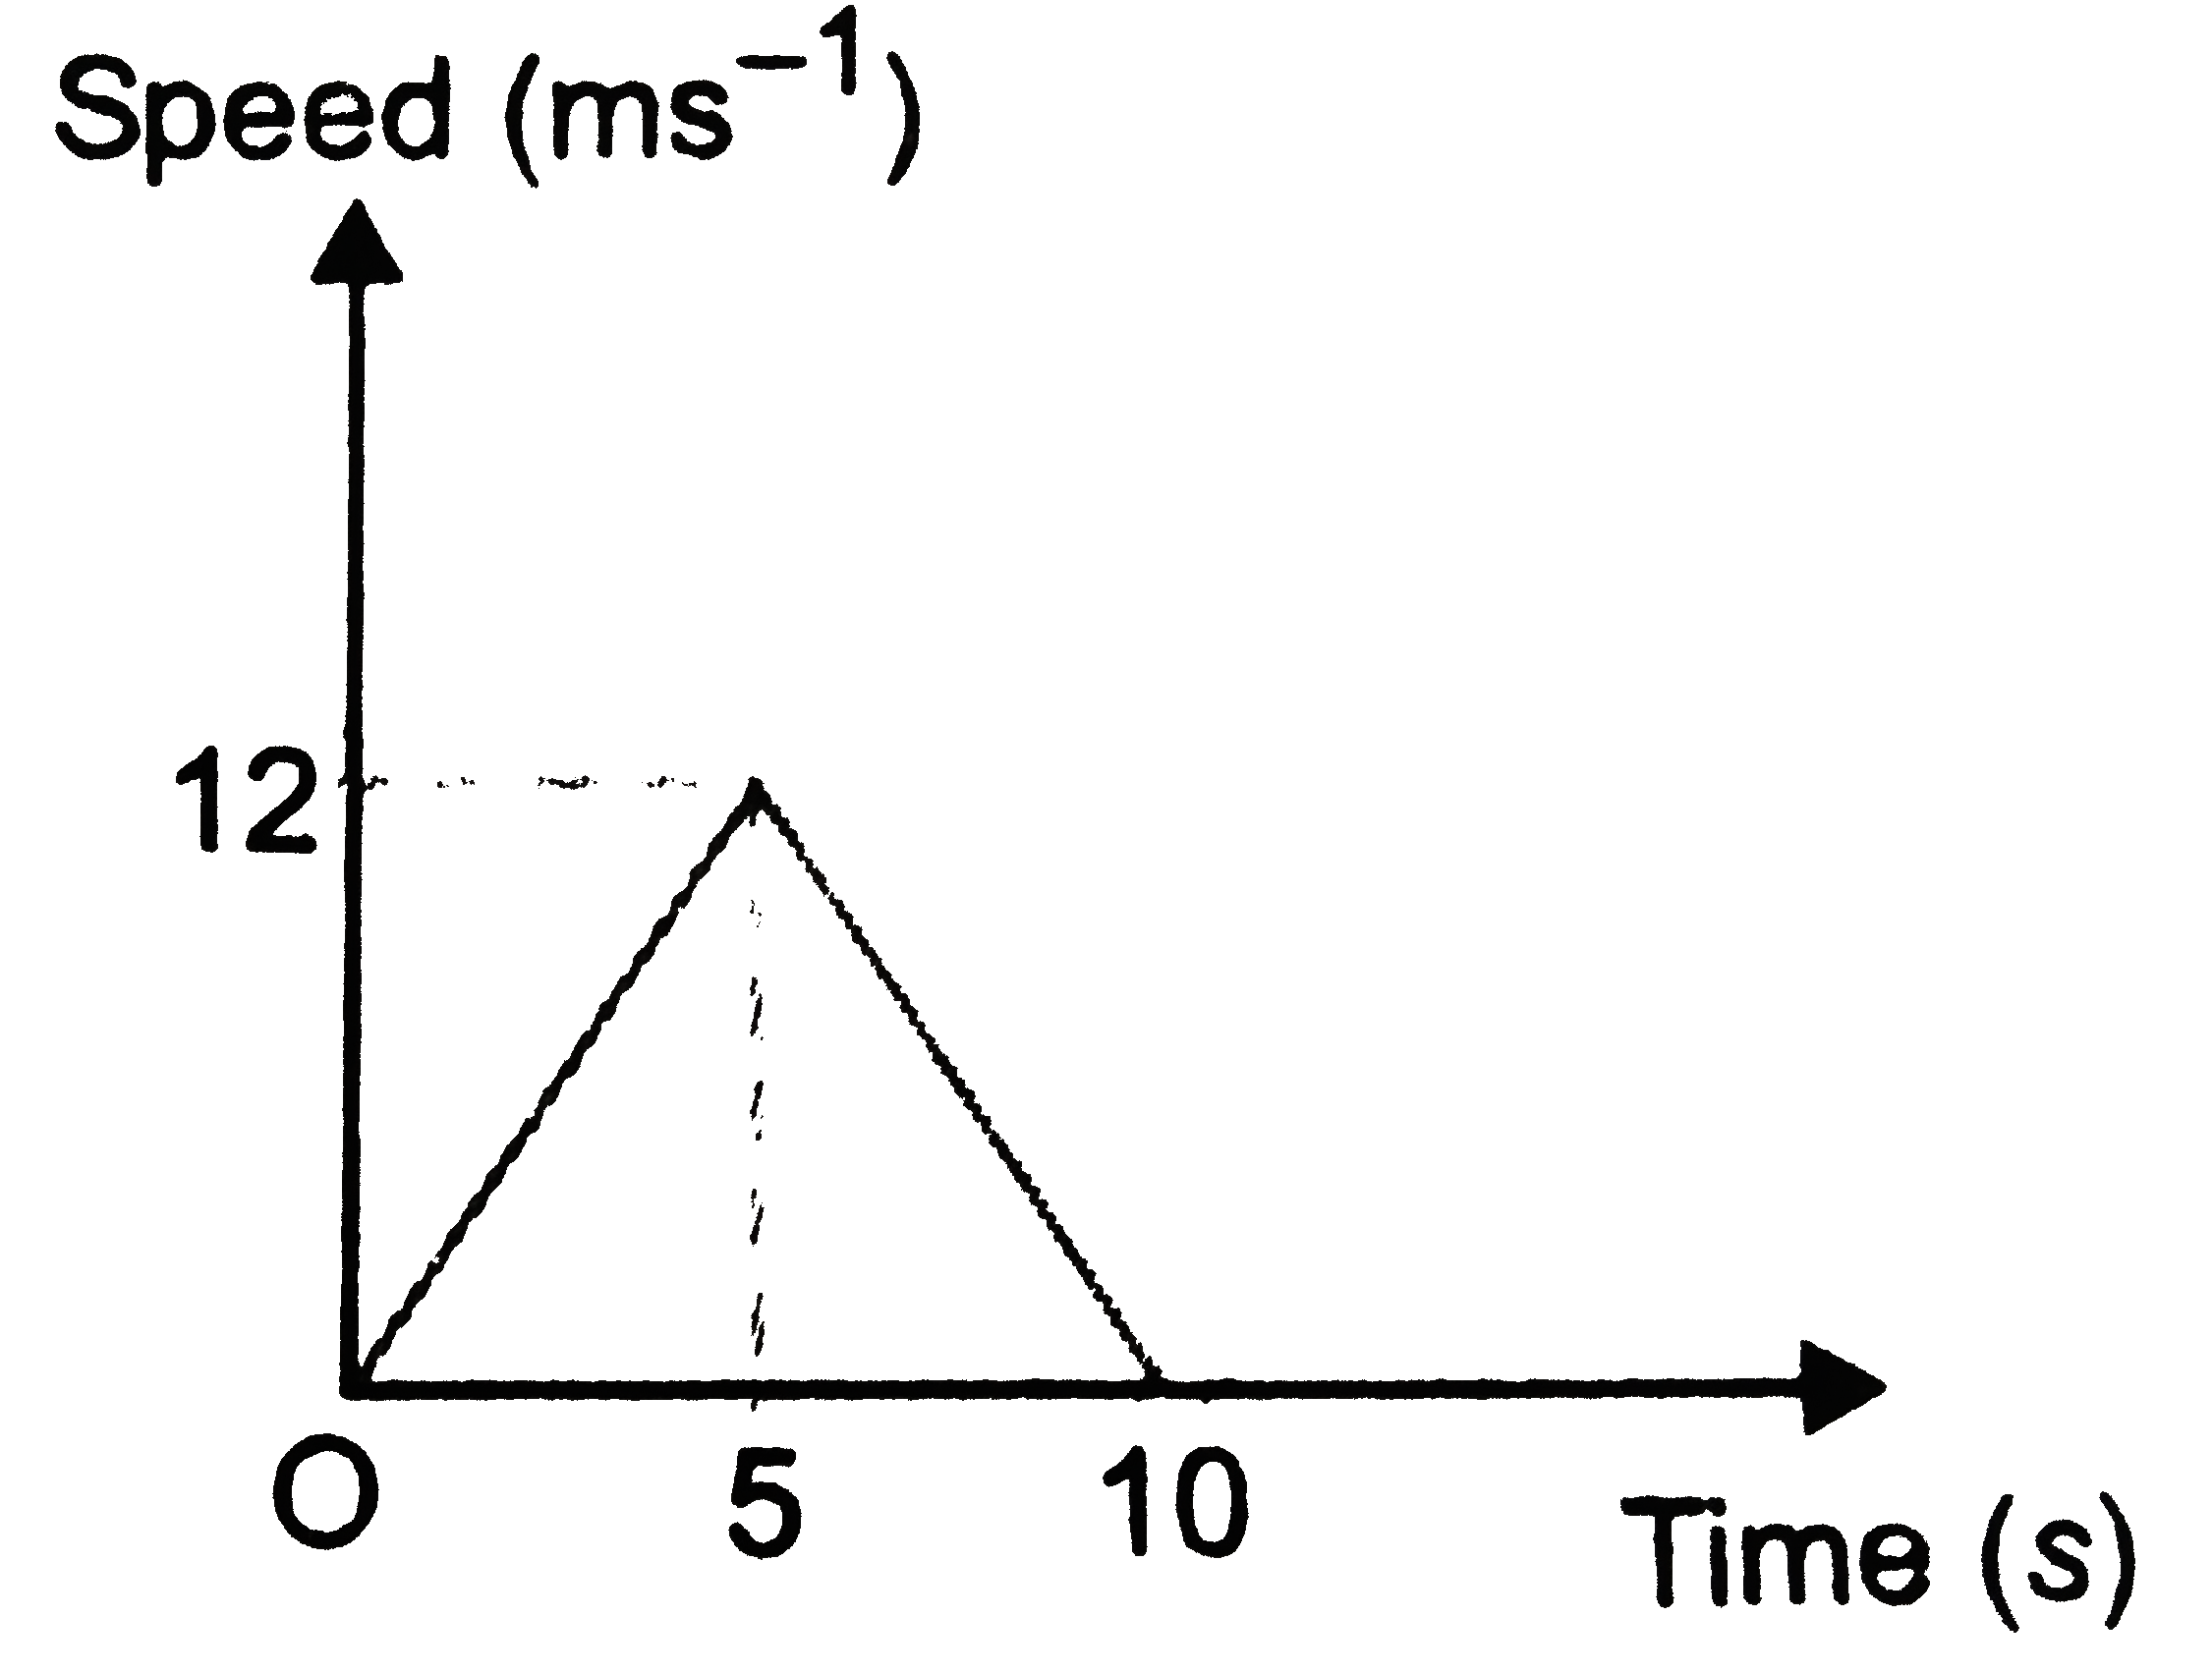 .A26mB36mC46mD56m
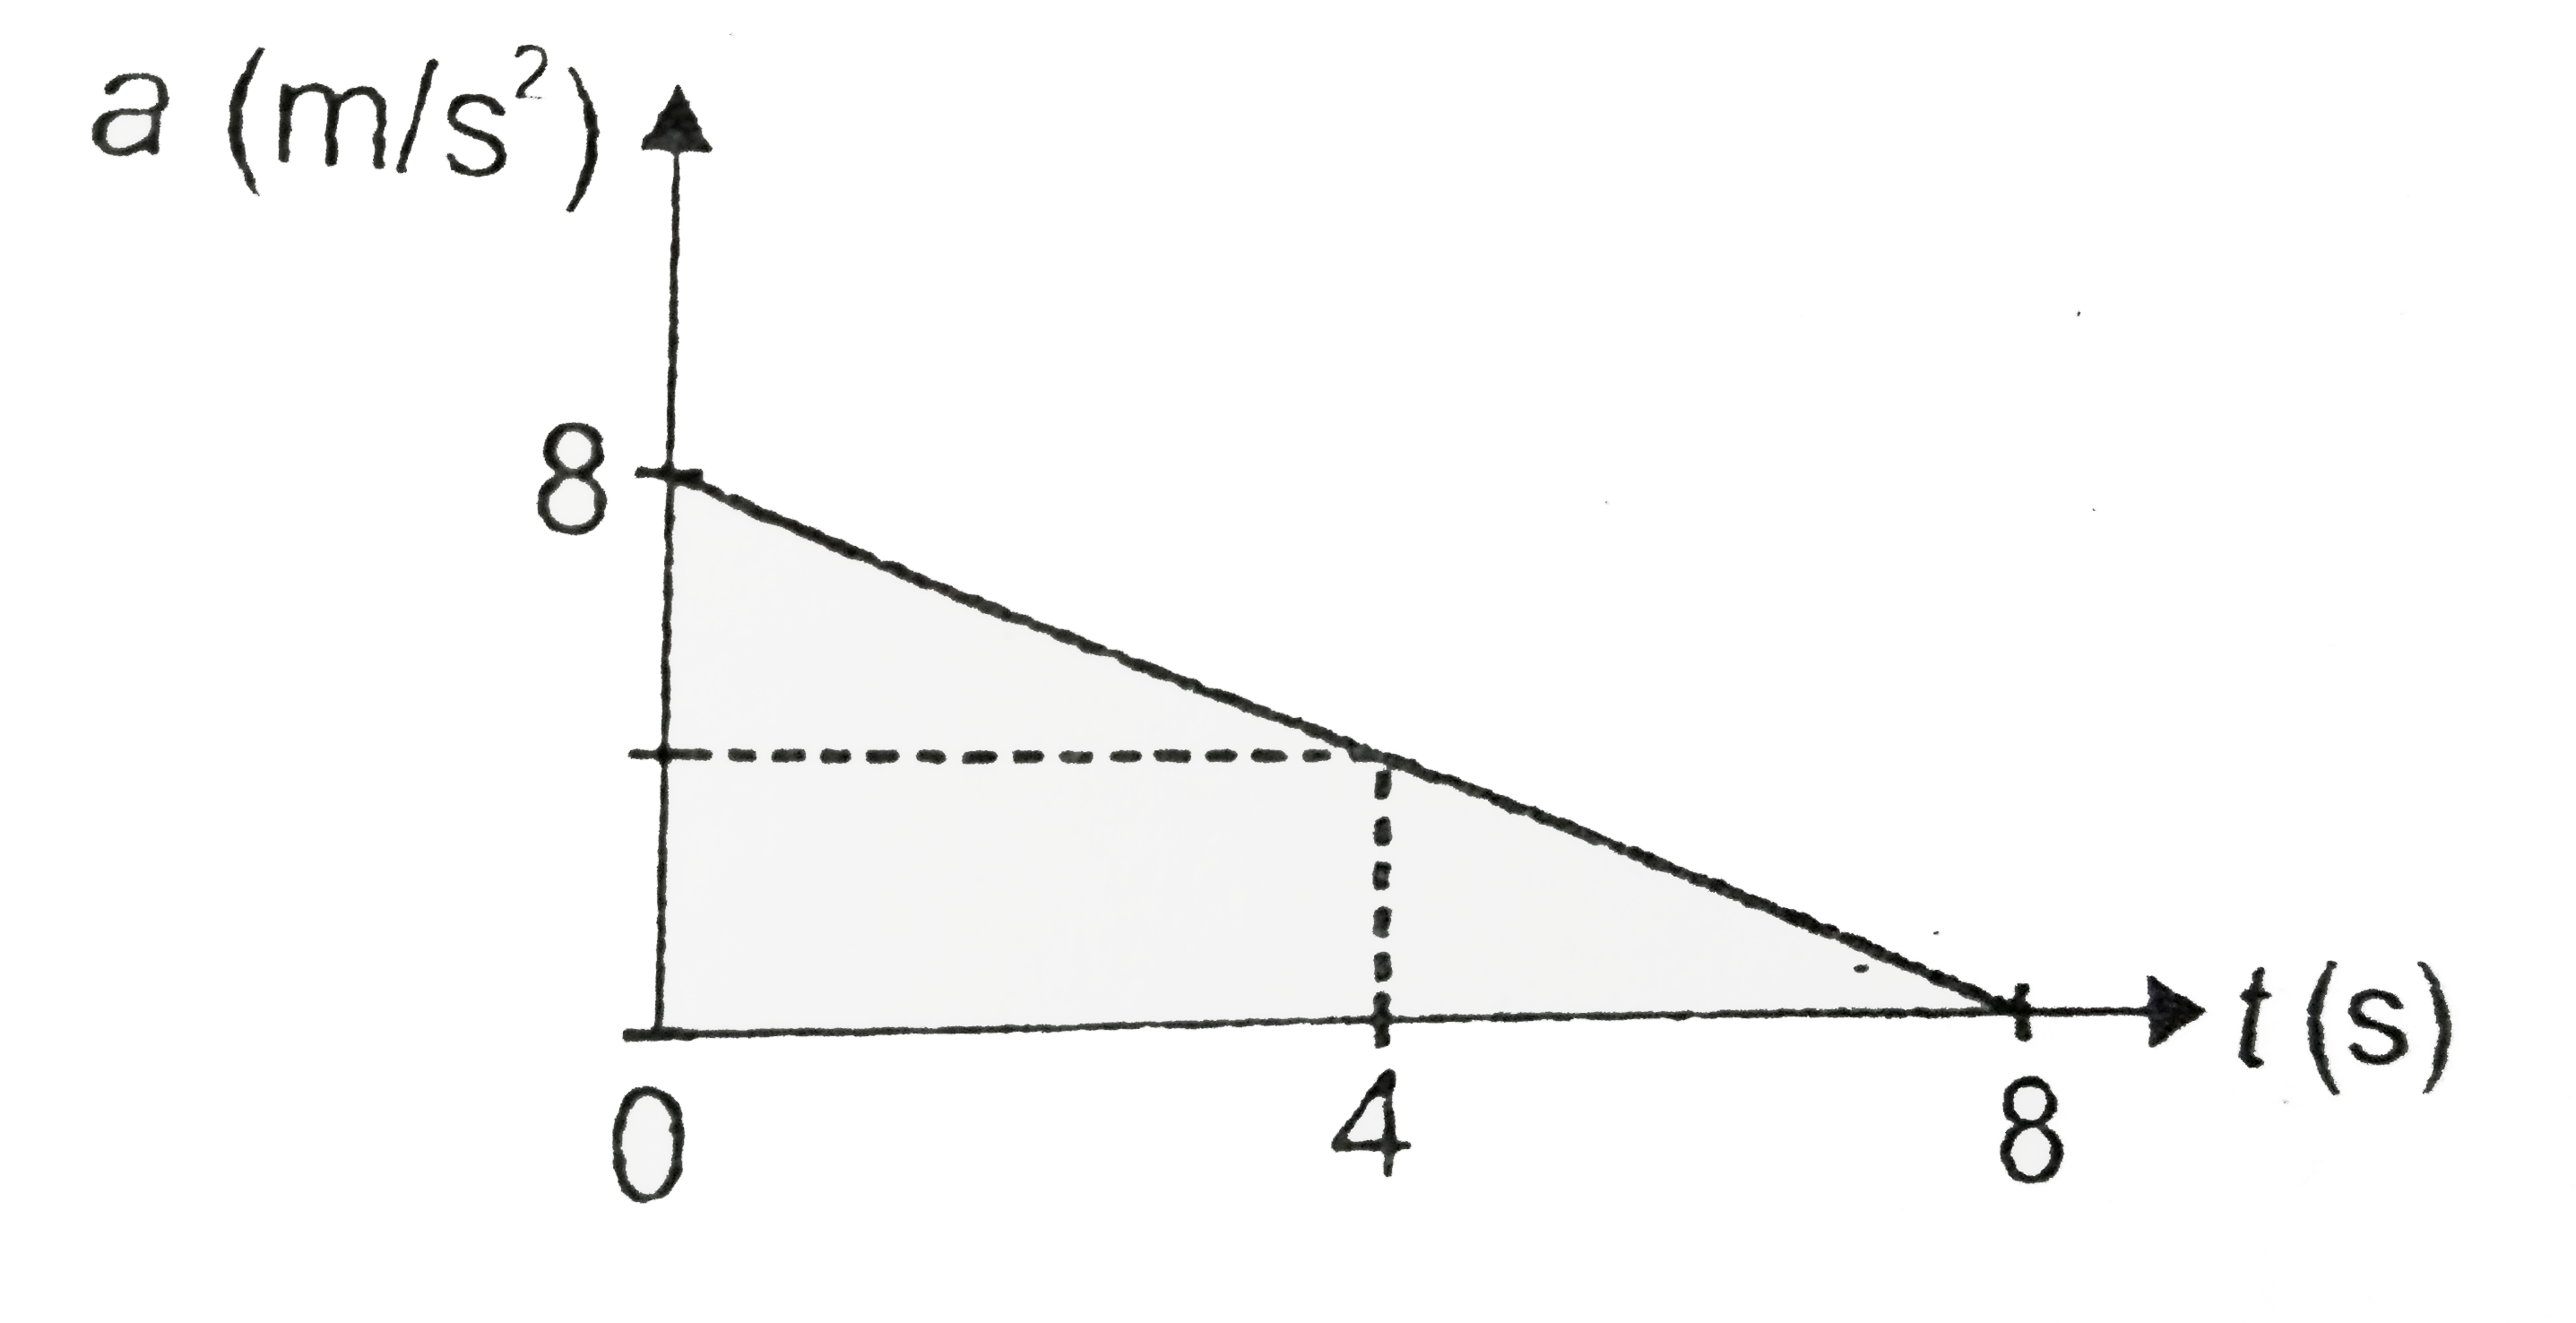
The acceleration-time graph of a particle moving along x-axis is shown in the figure. If the particle starts with velocity 3 m/s at t = 0, find the velocity of particle at t = 4 s.
 View Solution
s-t graph of a particle in motion is shown in Fig. Calculate
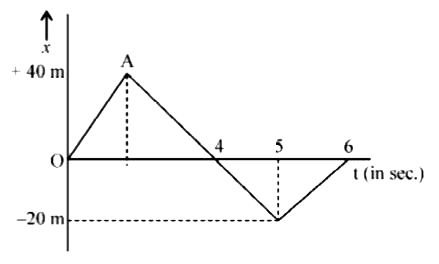
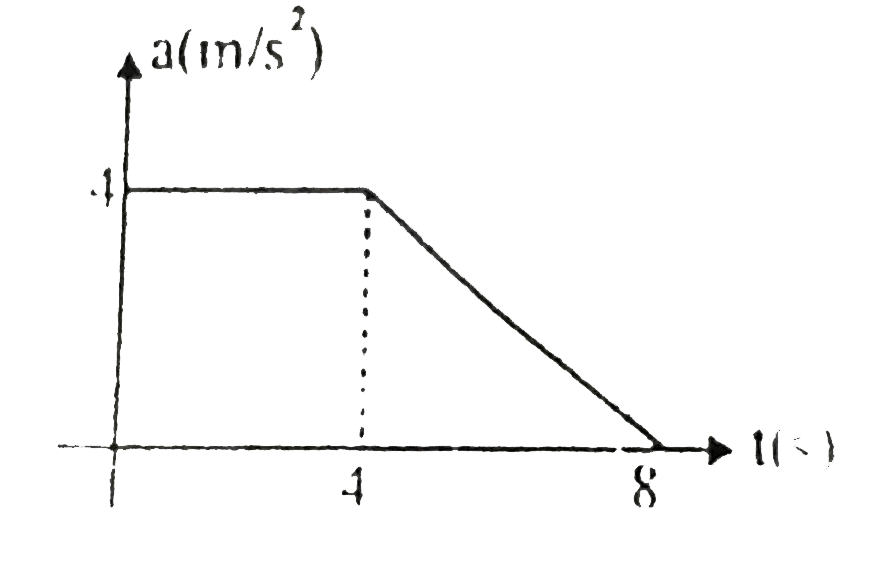
DisplacementView SolutionThe acceleration - time graph of a particle is as shown in figure Initial velocity of particle is 10m/s Displacement of the particle (in m) at the end of 8 sec is ___ Round off to nearest integer.
 View Solution
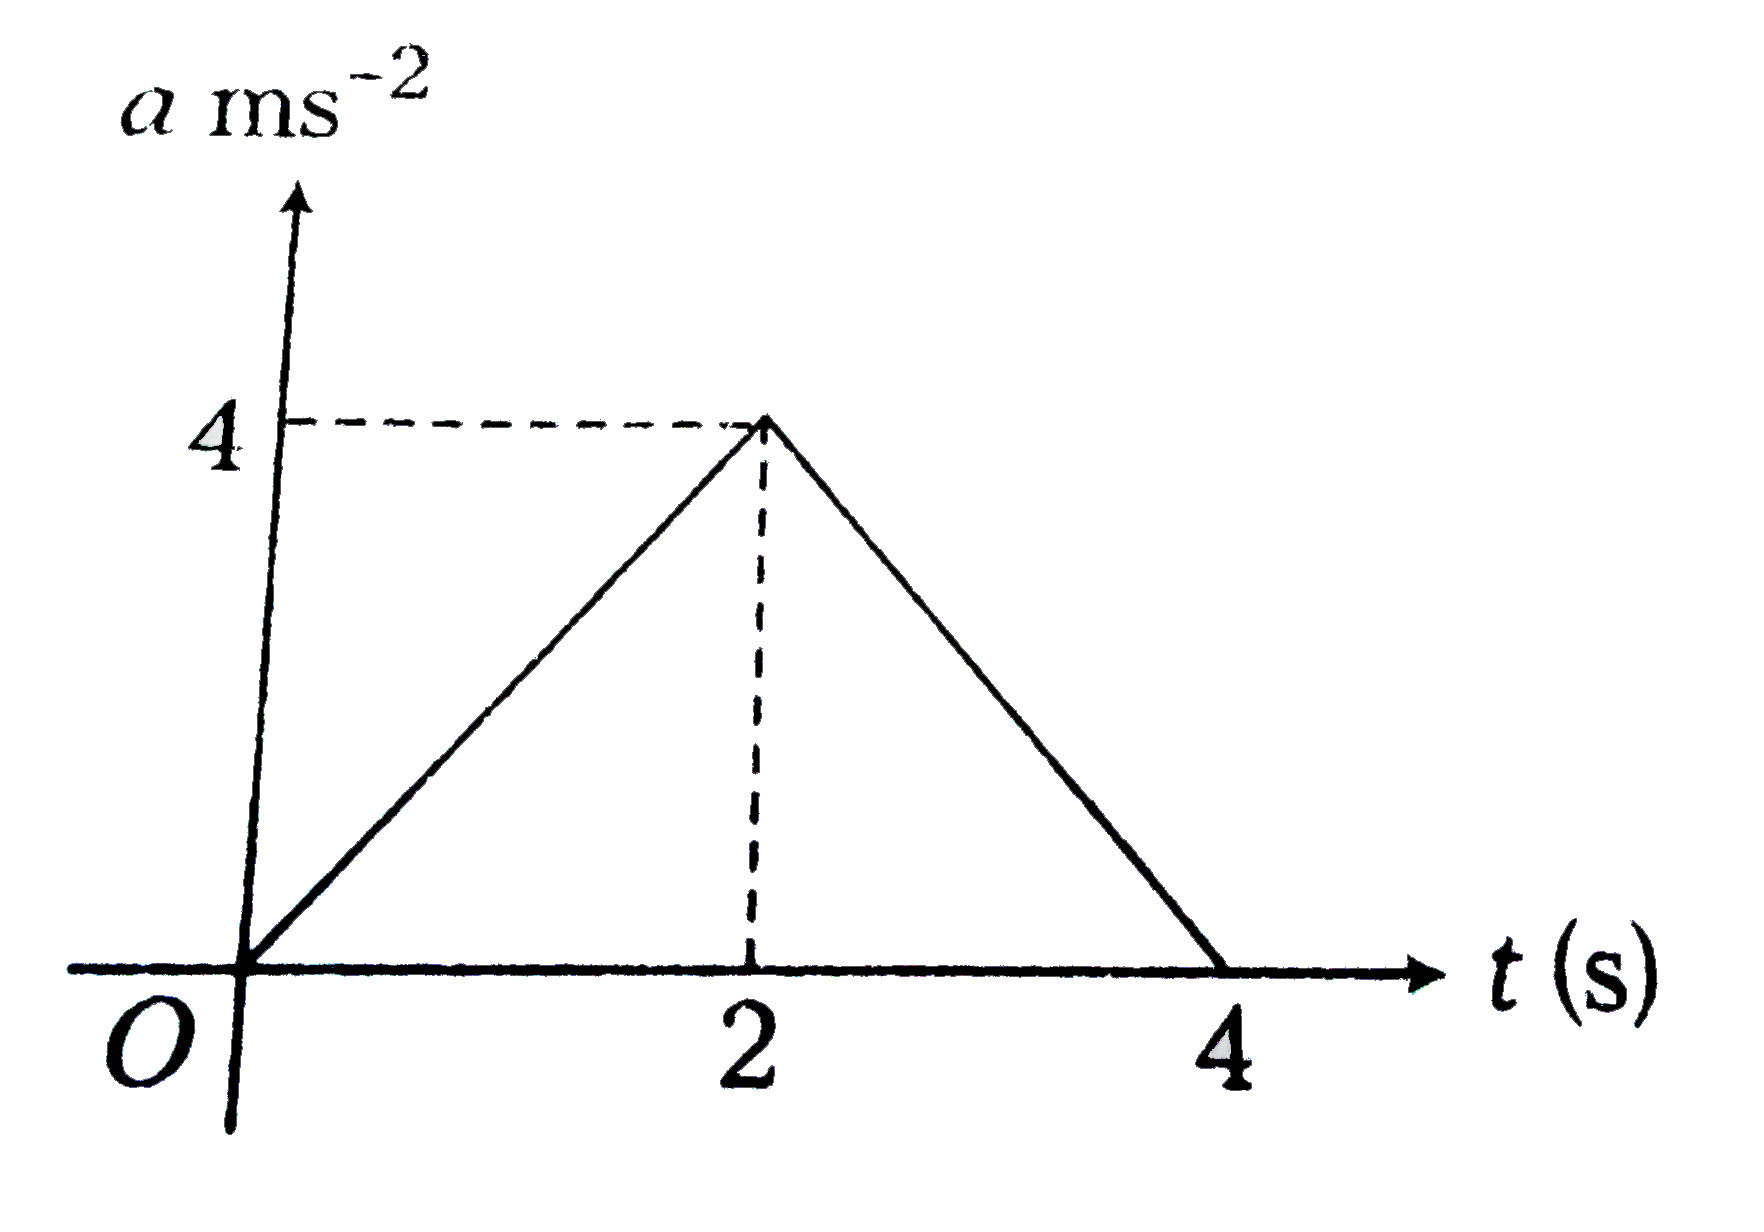
Acceleration - time graph of a particle moving in a straight line is shown in figure. Velocity of particle at time t = 0 is 2ms−1. Find velocity at the end of fourth second.
 View Solution
The acceleration-time graph of a particle moving in a straight line is as shown in figure. The velocity of the particle at time t=0 is 2m/s. The velocity after 2 seconds will be
 View Solution
