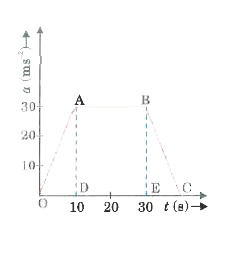
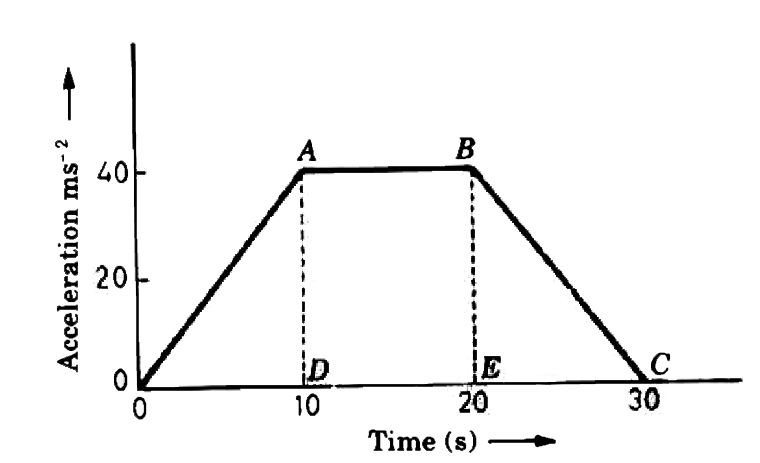
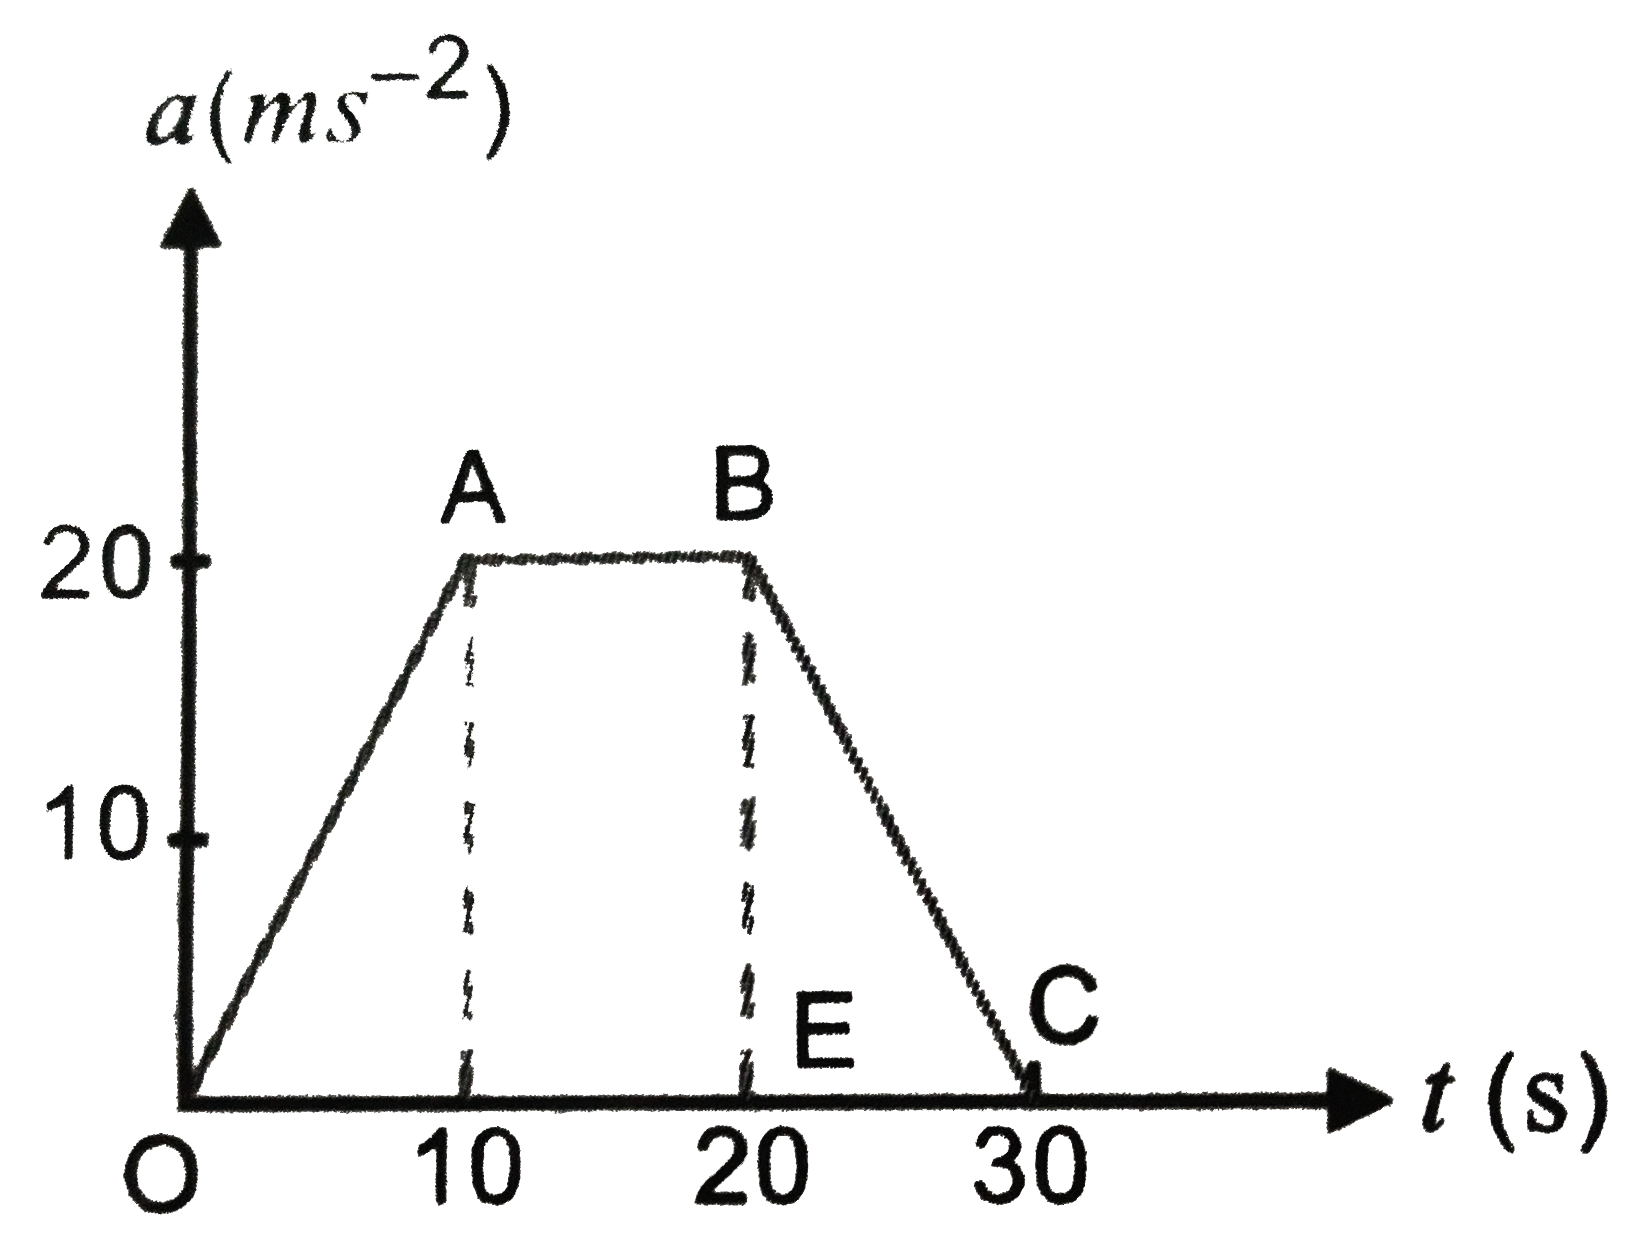
Fig. 3.39 shows the acceleration - time graph for a particle in rectilinear motion. Find the average acceleration in first 20 s.
Video Solution
Text Solution
The correct Answer is:30ms−2
|
Answer
Step by step video, text & image solution for Fig. 3.39 shows the acceleration - time graph for a particle in rectilinear motion. Find the average acceleration in first 20 s. by Physics experts to help you in doubts & scoring excellent marks in Class 11 exams.
Updated on:21/07/2023Topper's Solved these Questions
Similar Questions
Knowledge Check
Acceleration time graph of a particle moving along a straight line is given. Then average acceleration between t=0 & t=4 is :−
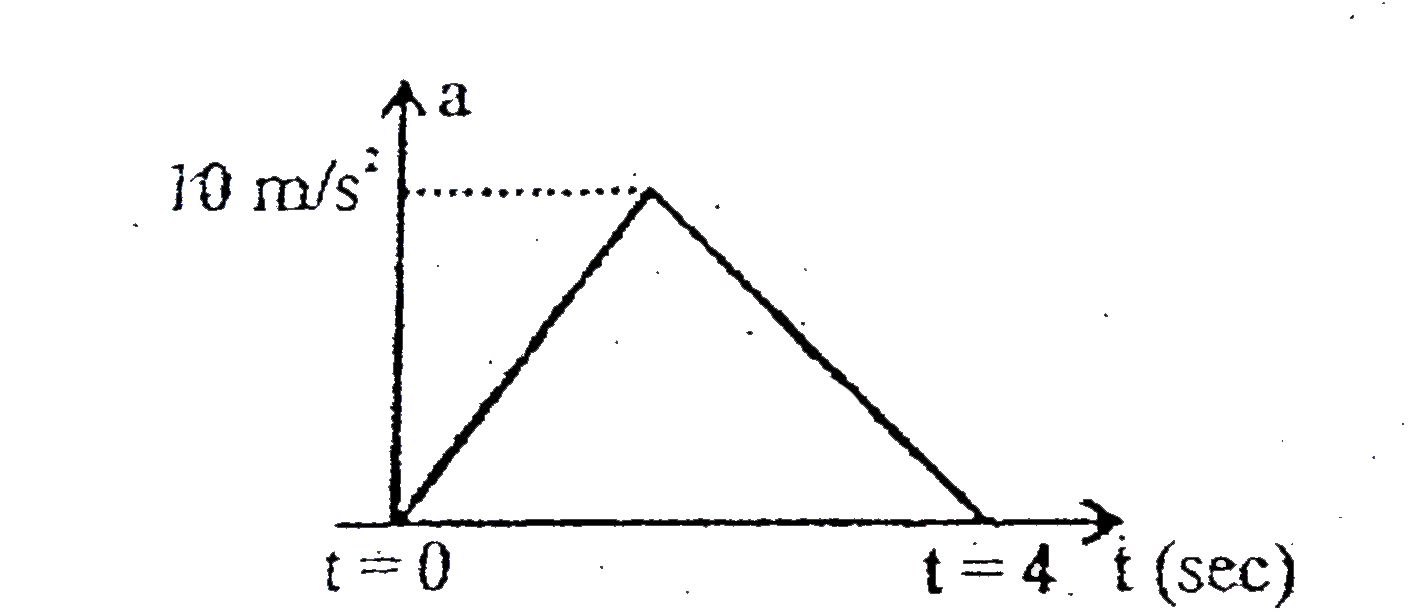 A0m/s2B5m/s2C10m/s2D7.5m/s2
Figure shows the position time graph for a particle in one dimensional motion. What is the displacement of the particle in first 4 seconds ?
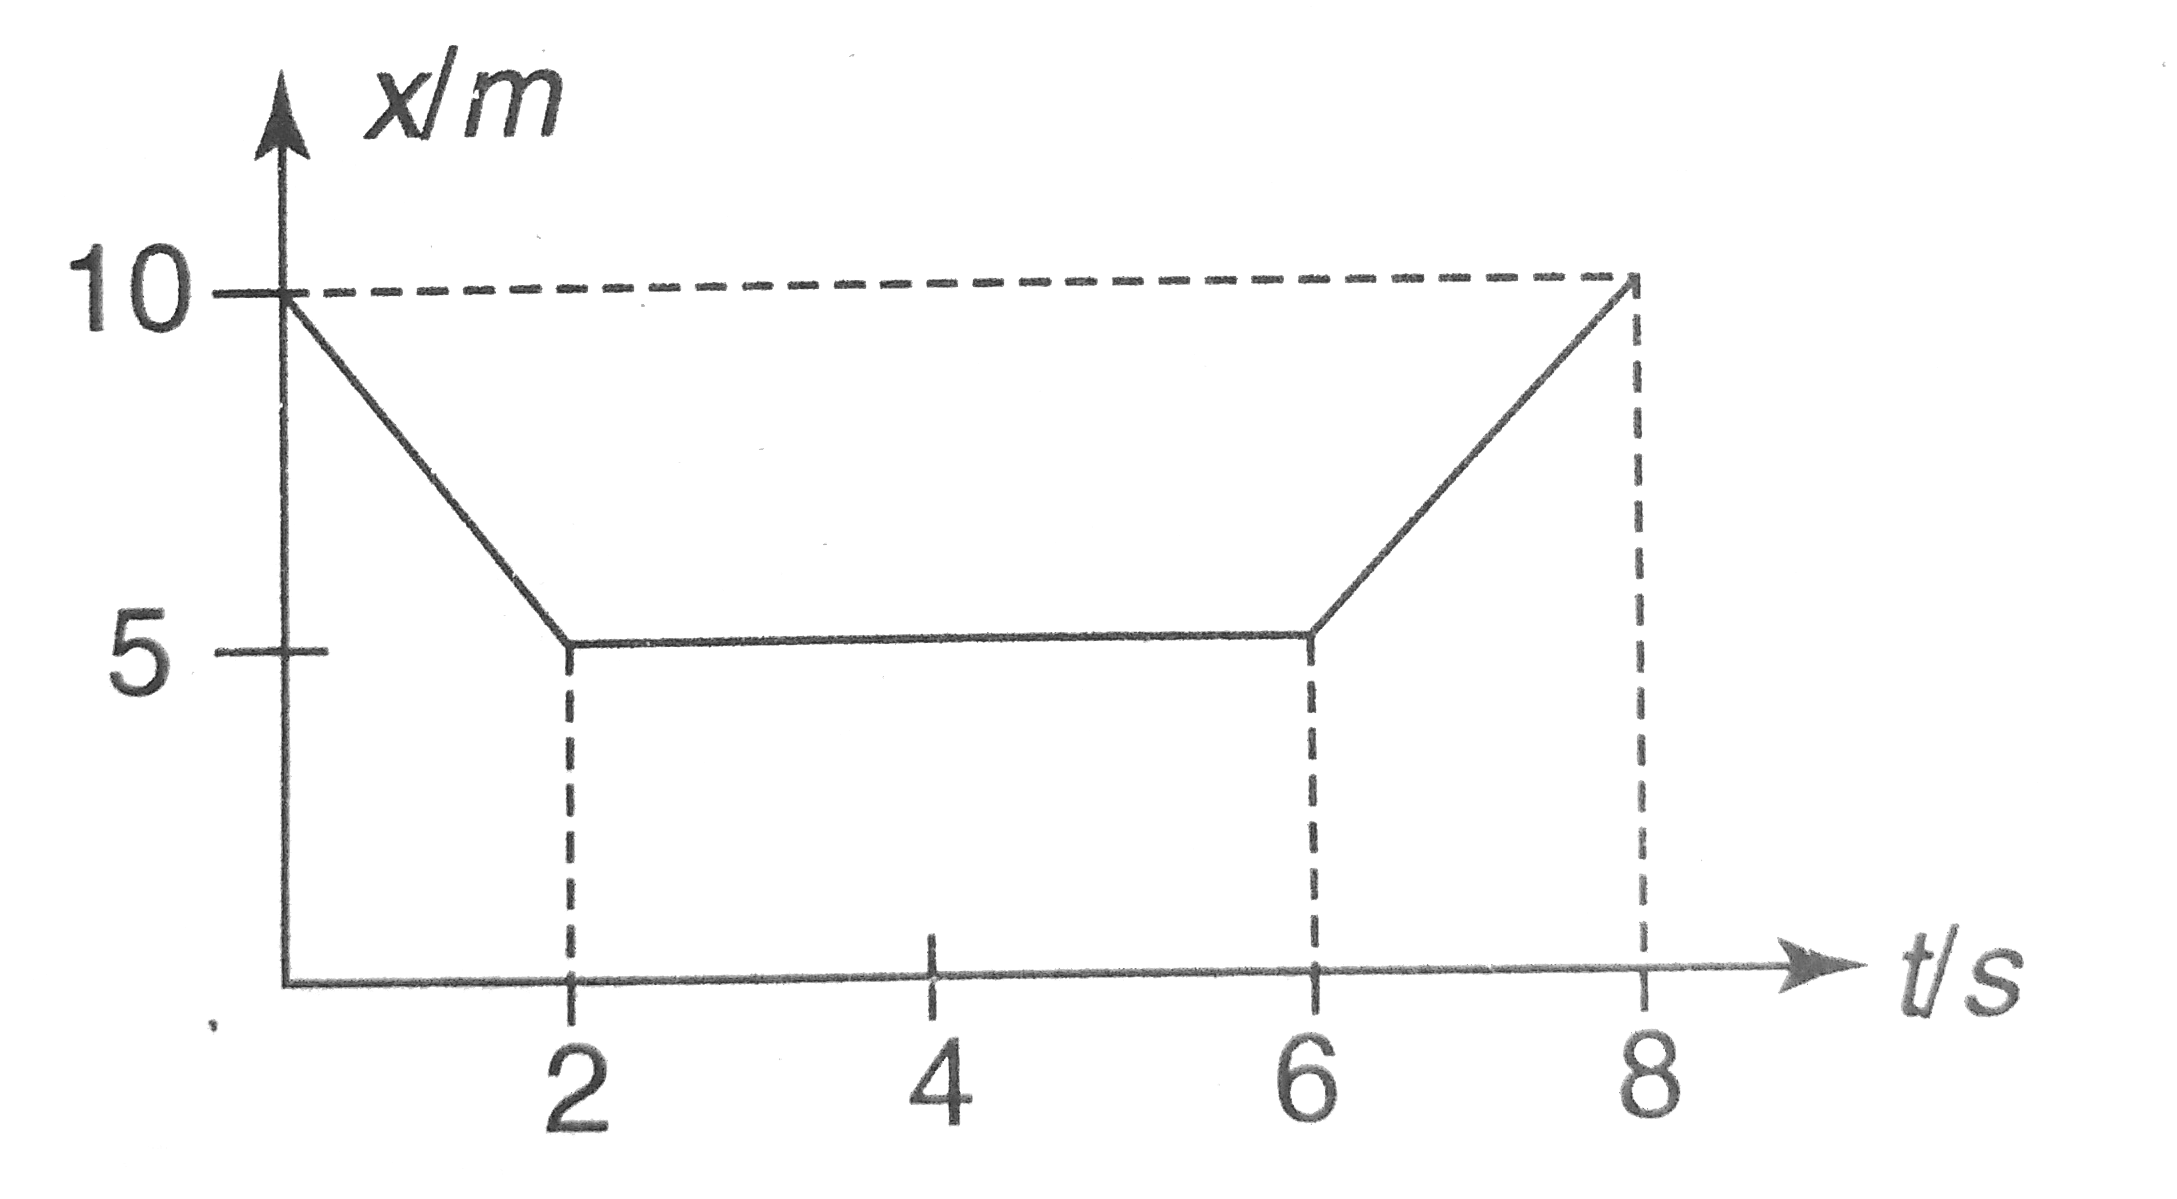 A5 mB−5mCzeroD15 m
The average acceleration vector for a particle having a uniform circular motion is
AA constant vector of magnitude v2rBA vector of magnitude v2r directed normal to the plane of the given uniform circular motionCEqual to the instantaneous acceleration vector at the start of the motionDA null vector
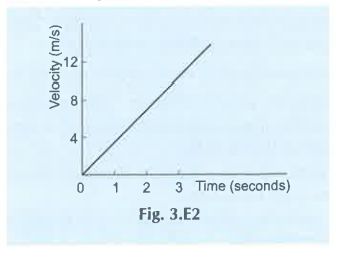
Figure 3.E2 shows the velocity -time graph for a particle moving in a fixed direction. Find the acceleration of the particle.
View Solutions-t graph of a particle in motion is shown in Fig. Calculate
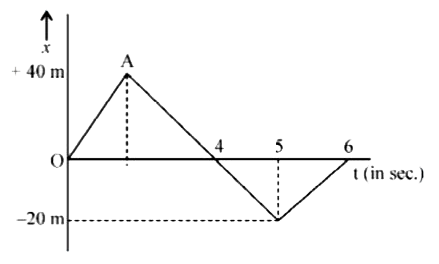
Average speed
View Solutions-t graph of a particle in motion is shown in Fig. Calculate
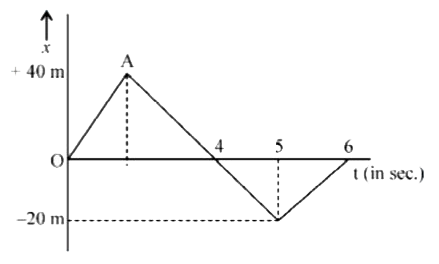
Average velocity
View SolutionFor a uniformly accelerated motion, the average acceleration is equal to
View SolutionPosition-time graph for motion with zero acceleration is
View Solution

 .
.