The graph below represents the velocity vs. time graph for a car.
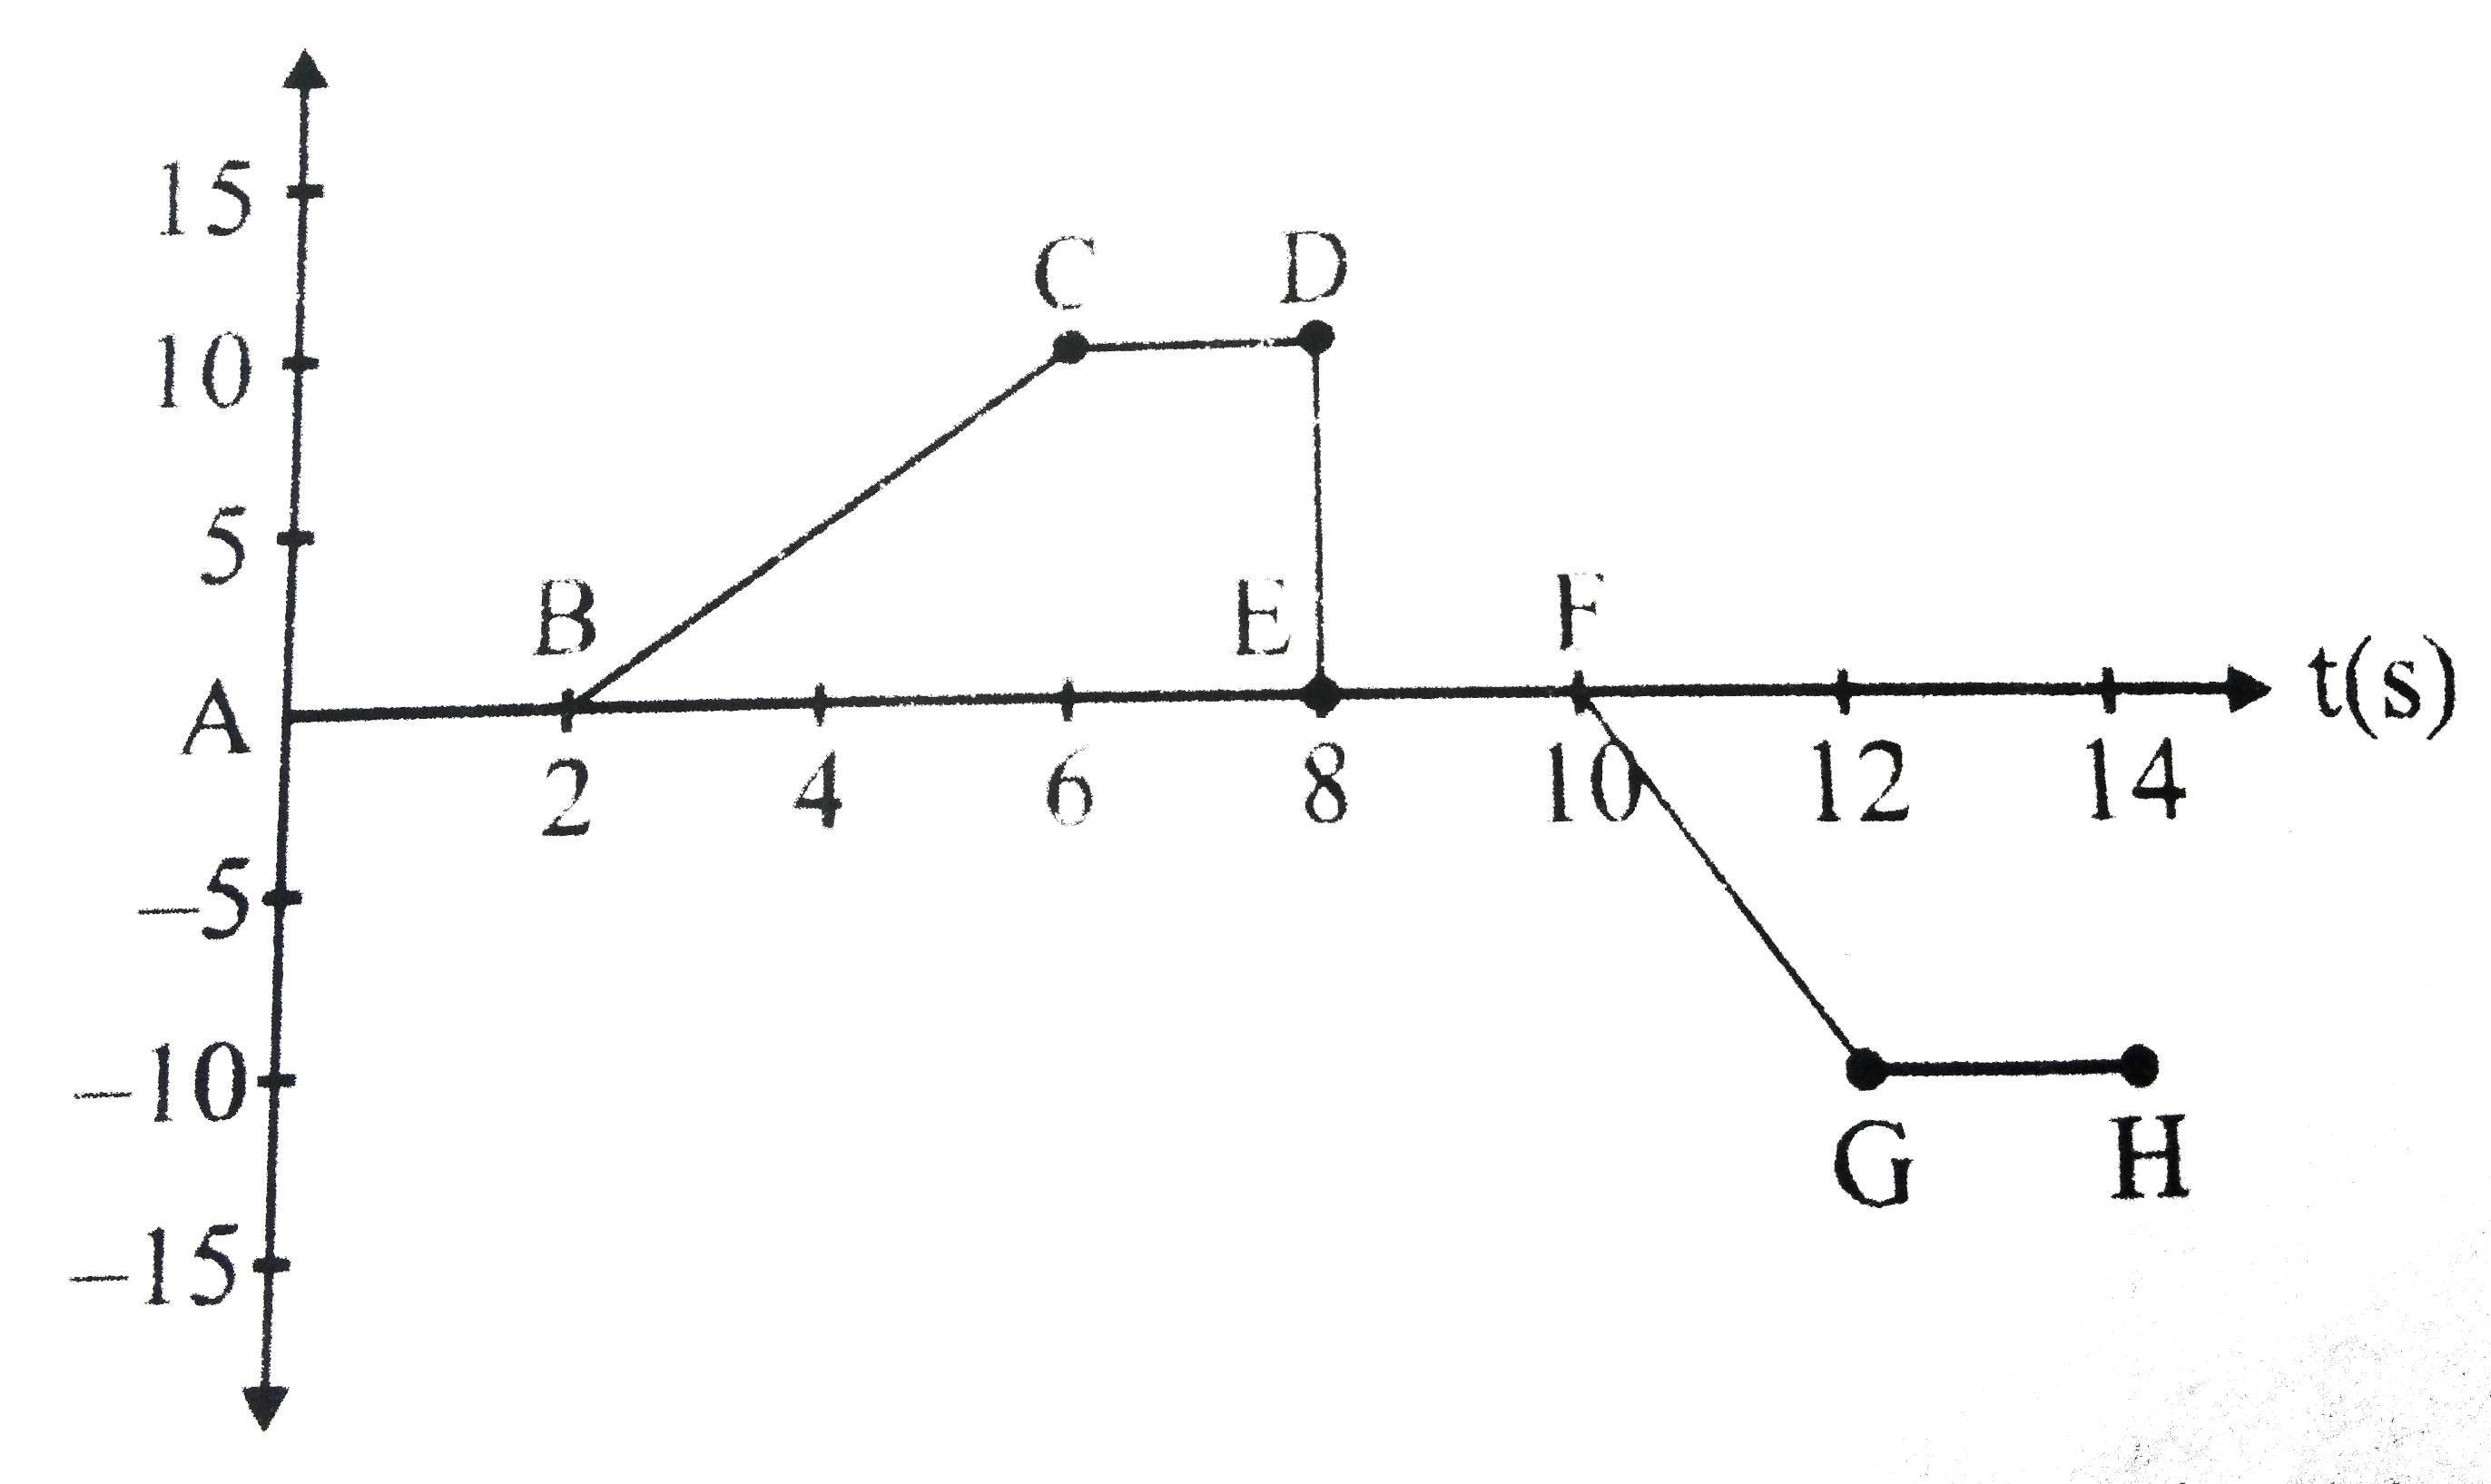
(A) During which intervals is the car at rest?
(B) During which intervals is the car moving a constant nonzero velocity ? State the velocity at each of these intervals
(C) There are two intervals during which the car is accelerating. Find the acceleration in each of these intervals.
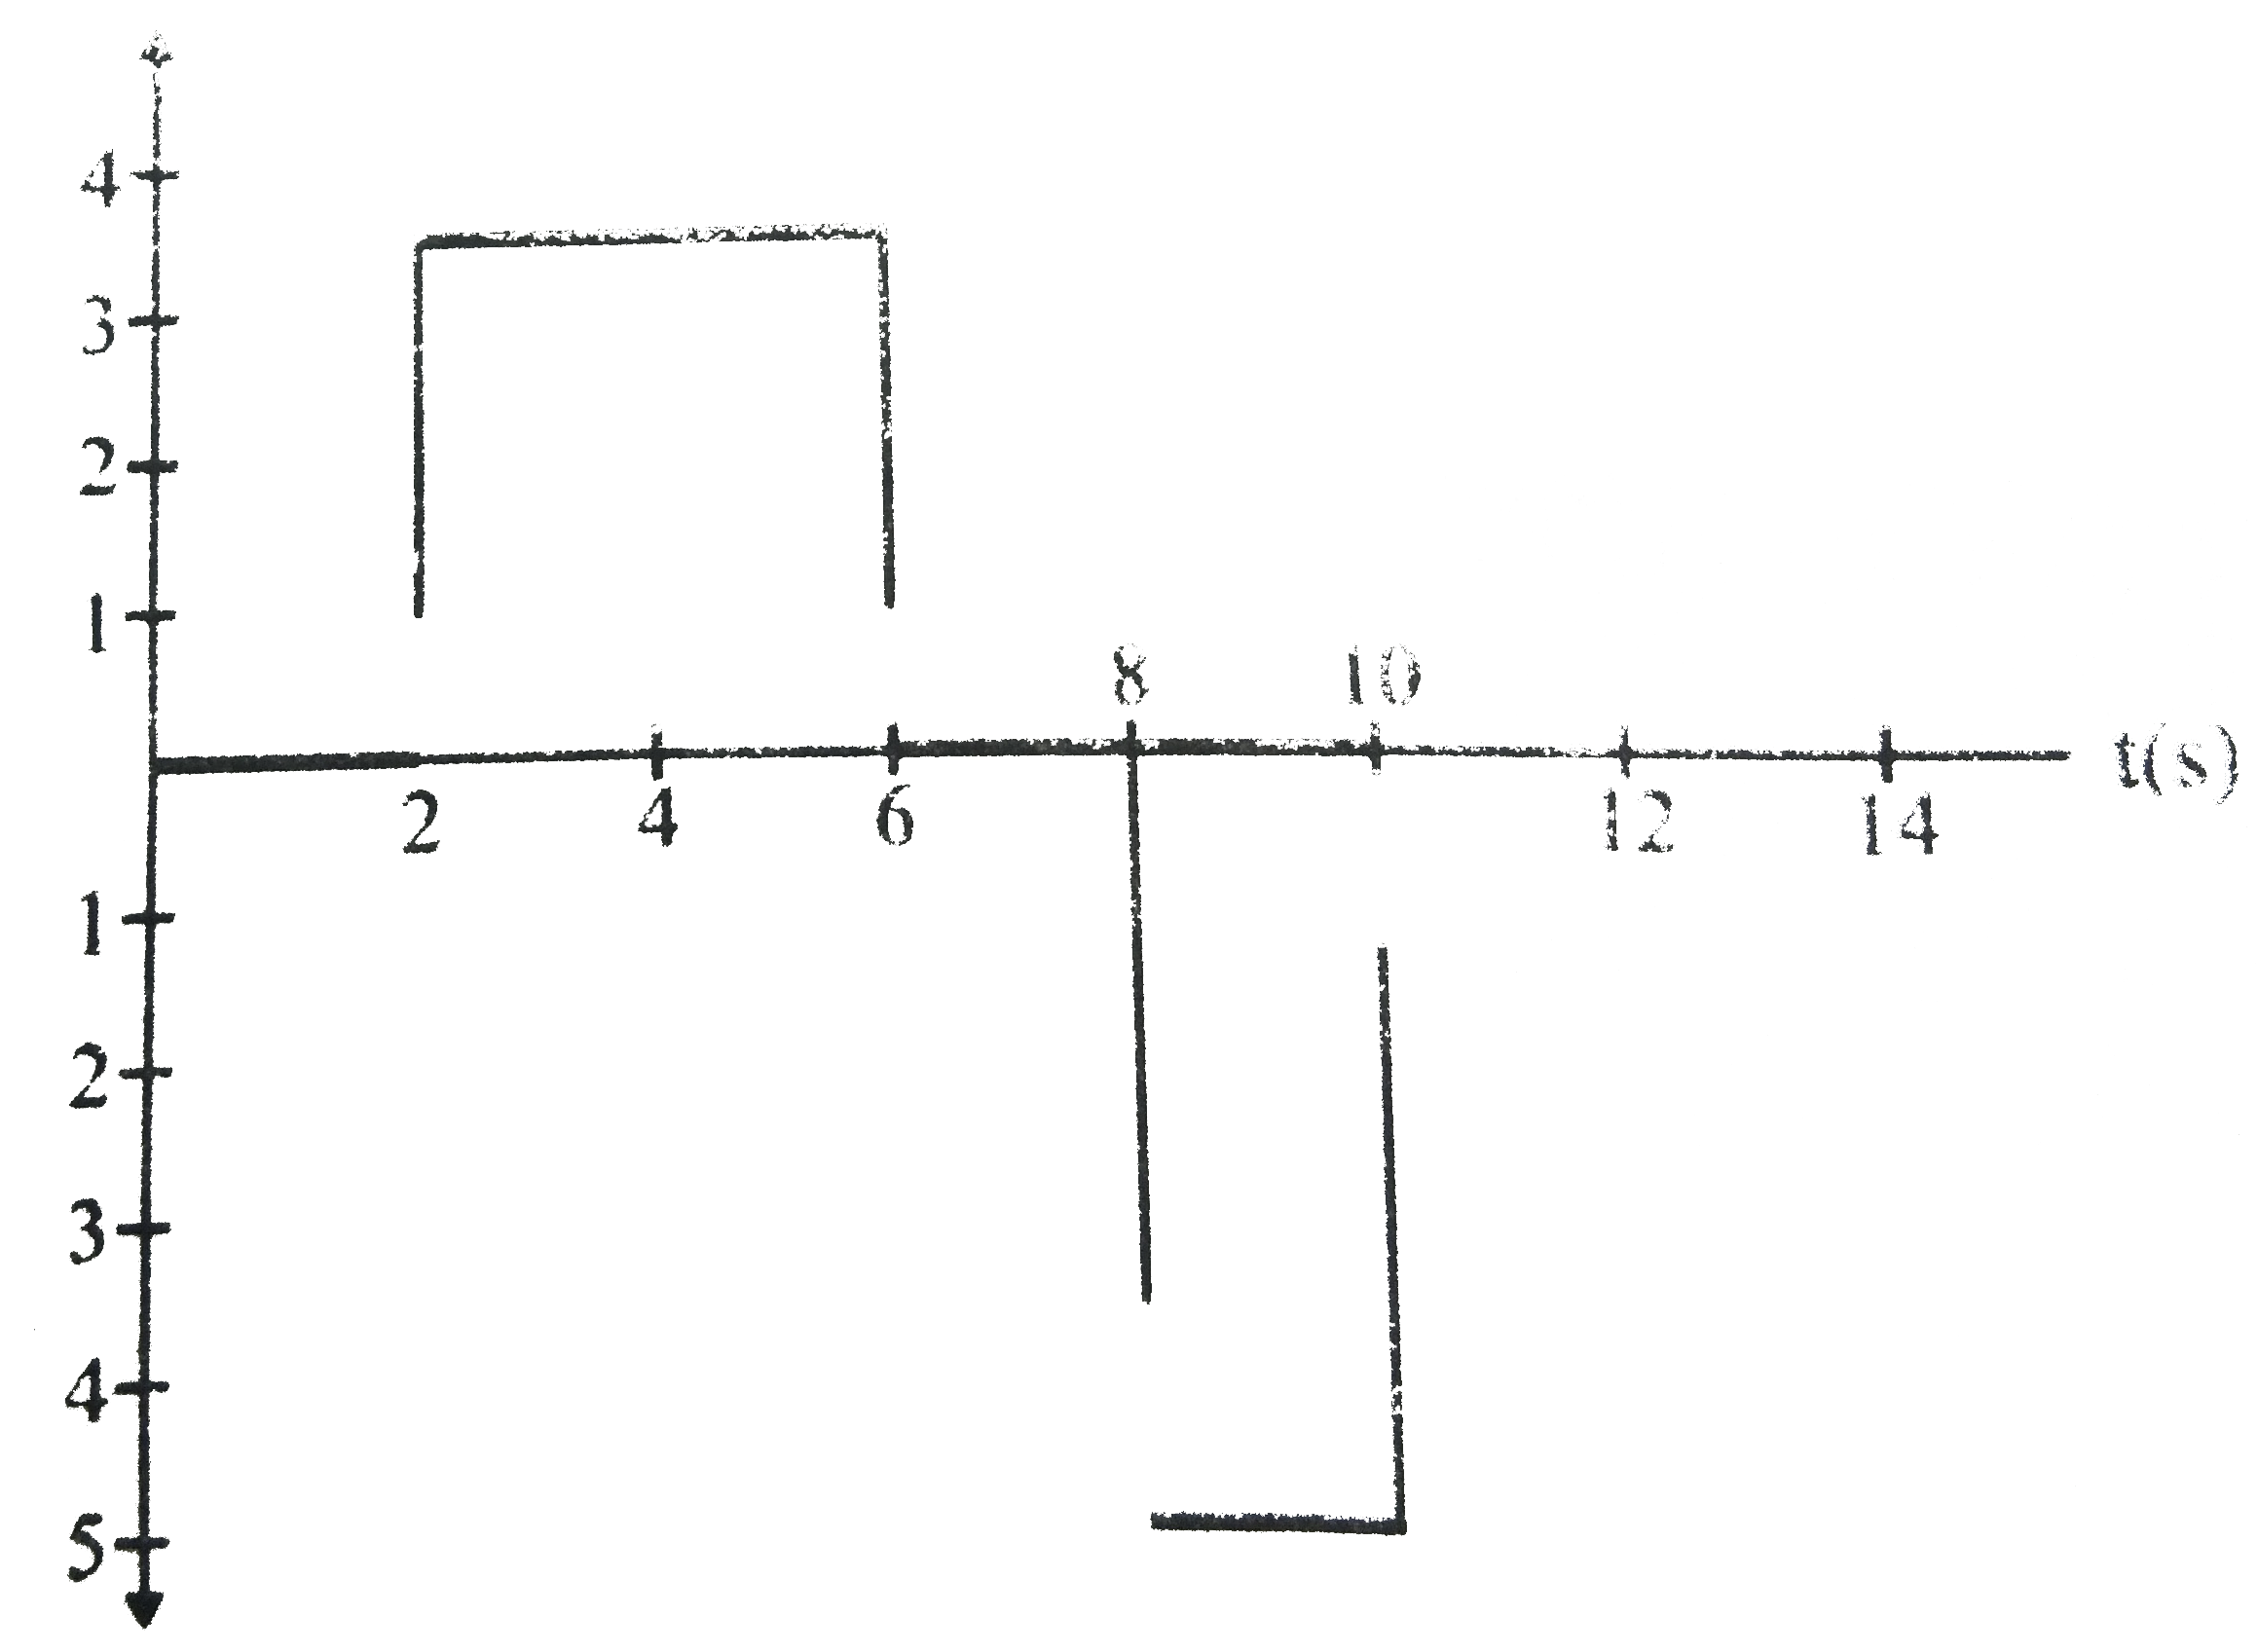
(D) Sketch the acceleration vs. time garph that corresponds to the motion of the car form 0s to 14s.
(A) The car is at rest when the velocity is zero.: A to B and E to F.
(B) The velocity of the car is constant form C to D, when its velocity is +10m/s, and from G to H,when its velocity is −10m/s. The car is raveling backward during the interval G to H compared to the interval C to D.
(C) The car is accelerating during intervals B to C and F to G. During the interval B to C, the acceleration can be found be finding the slope of the vvs,.t graph:
slope of a vvs.t graph =riserun=ΔvΔt=10m/s−06s−2s
=±2.5ms2.
During the interval F to G:
slope =riserun=ΔvΔt=−10m/s−012s−10s=−5m/s2
In this last case, the car is still speeding up (from 0to −10m/s2), it's just speeding a negative direction
(D) The acceleration vs. time graph looks like this
Similar Questions
The following figure represents the velocity-time graph of a moving car on a road:
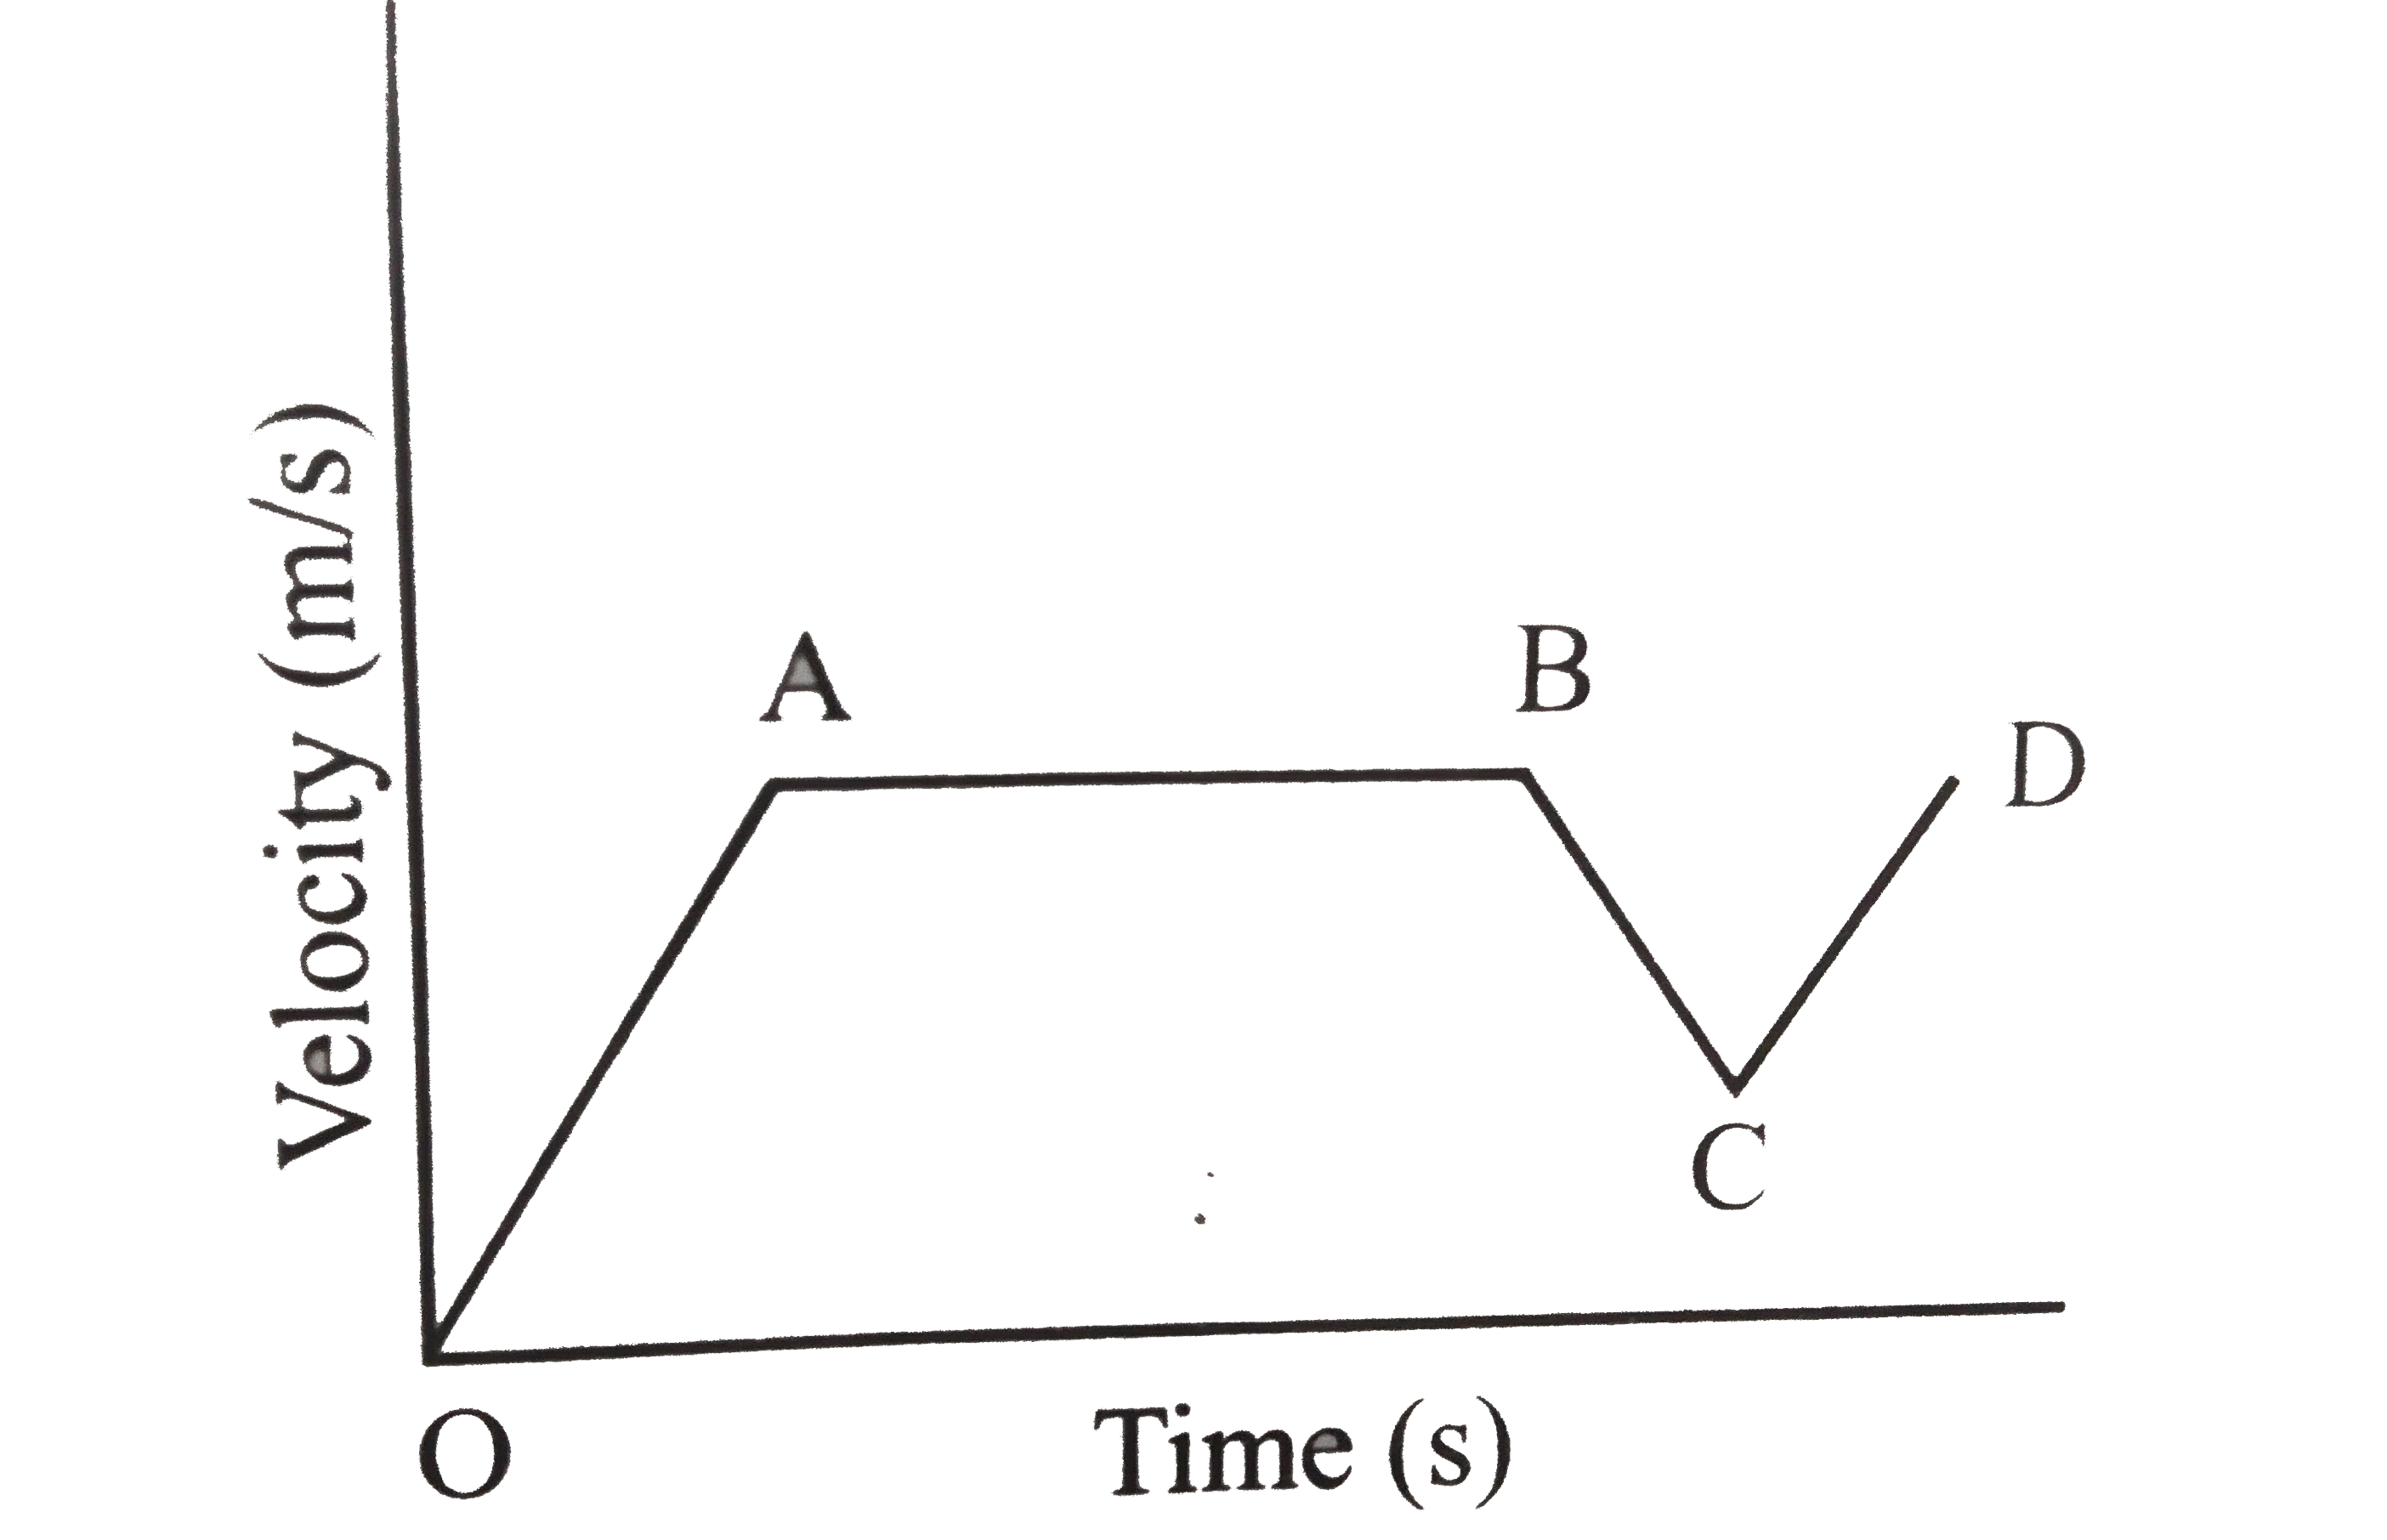
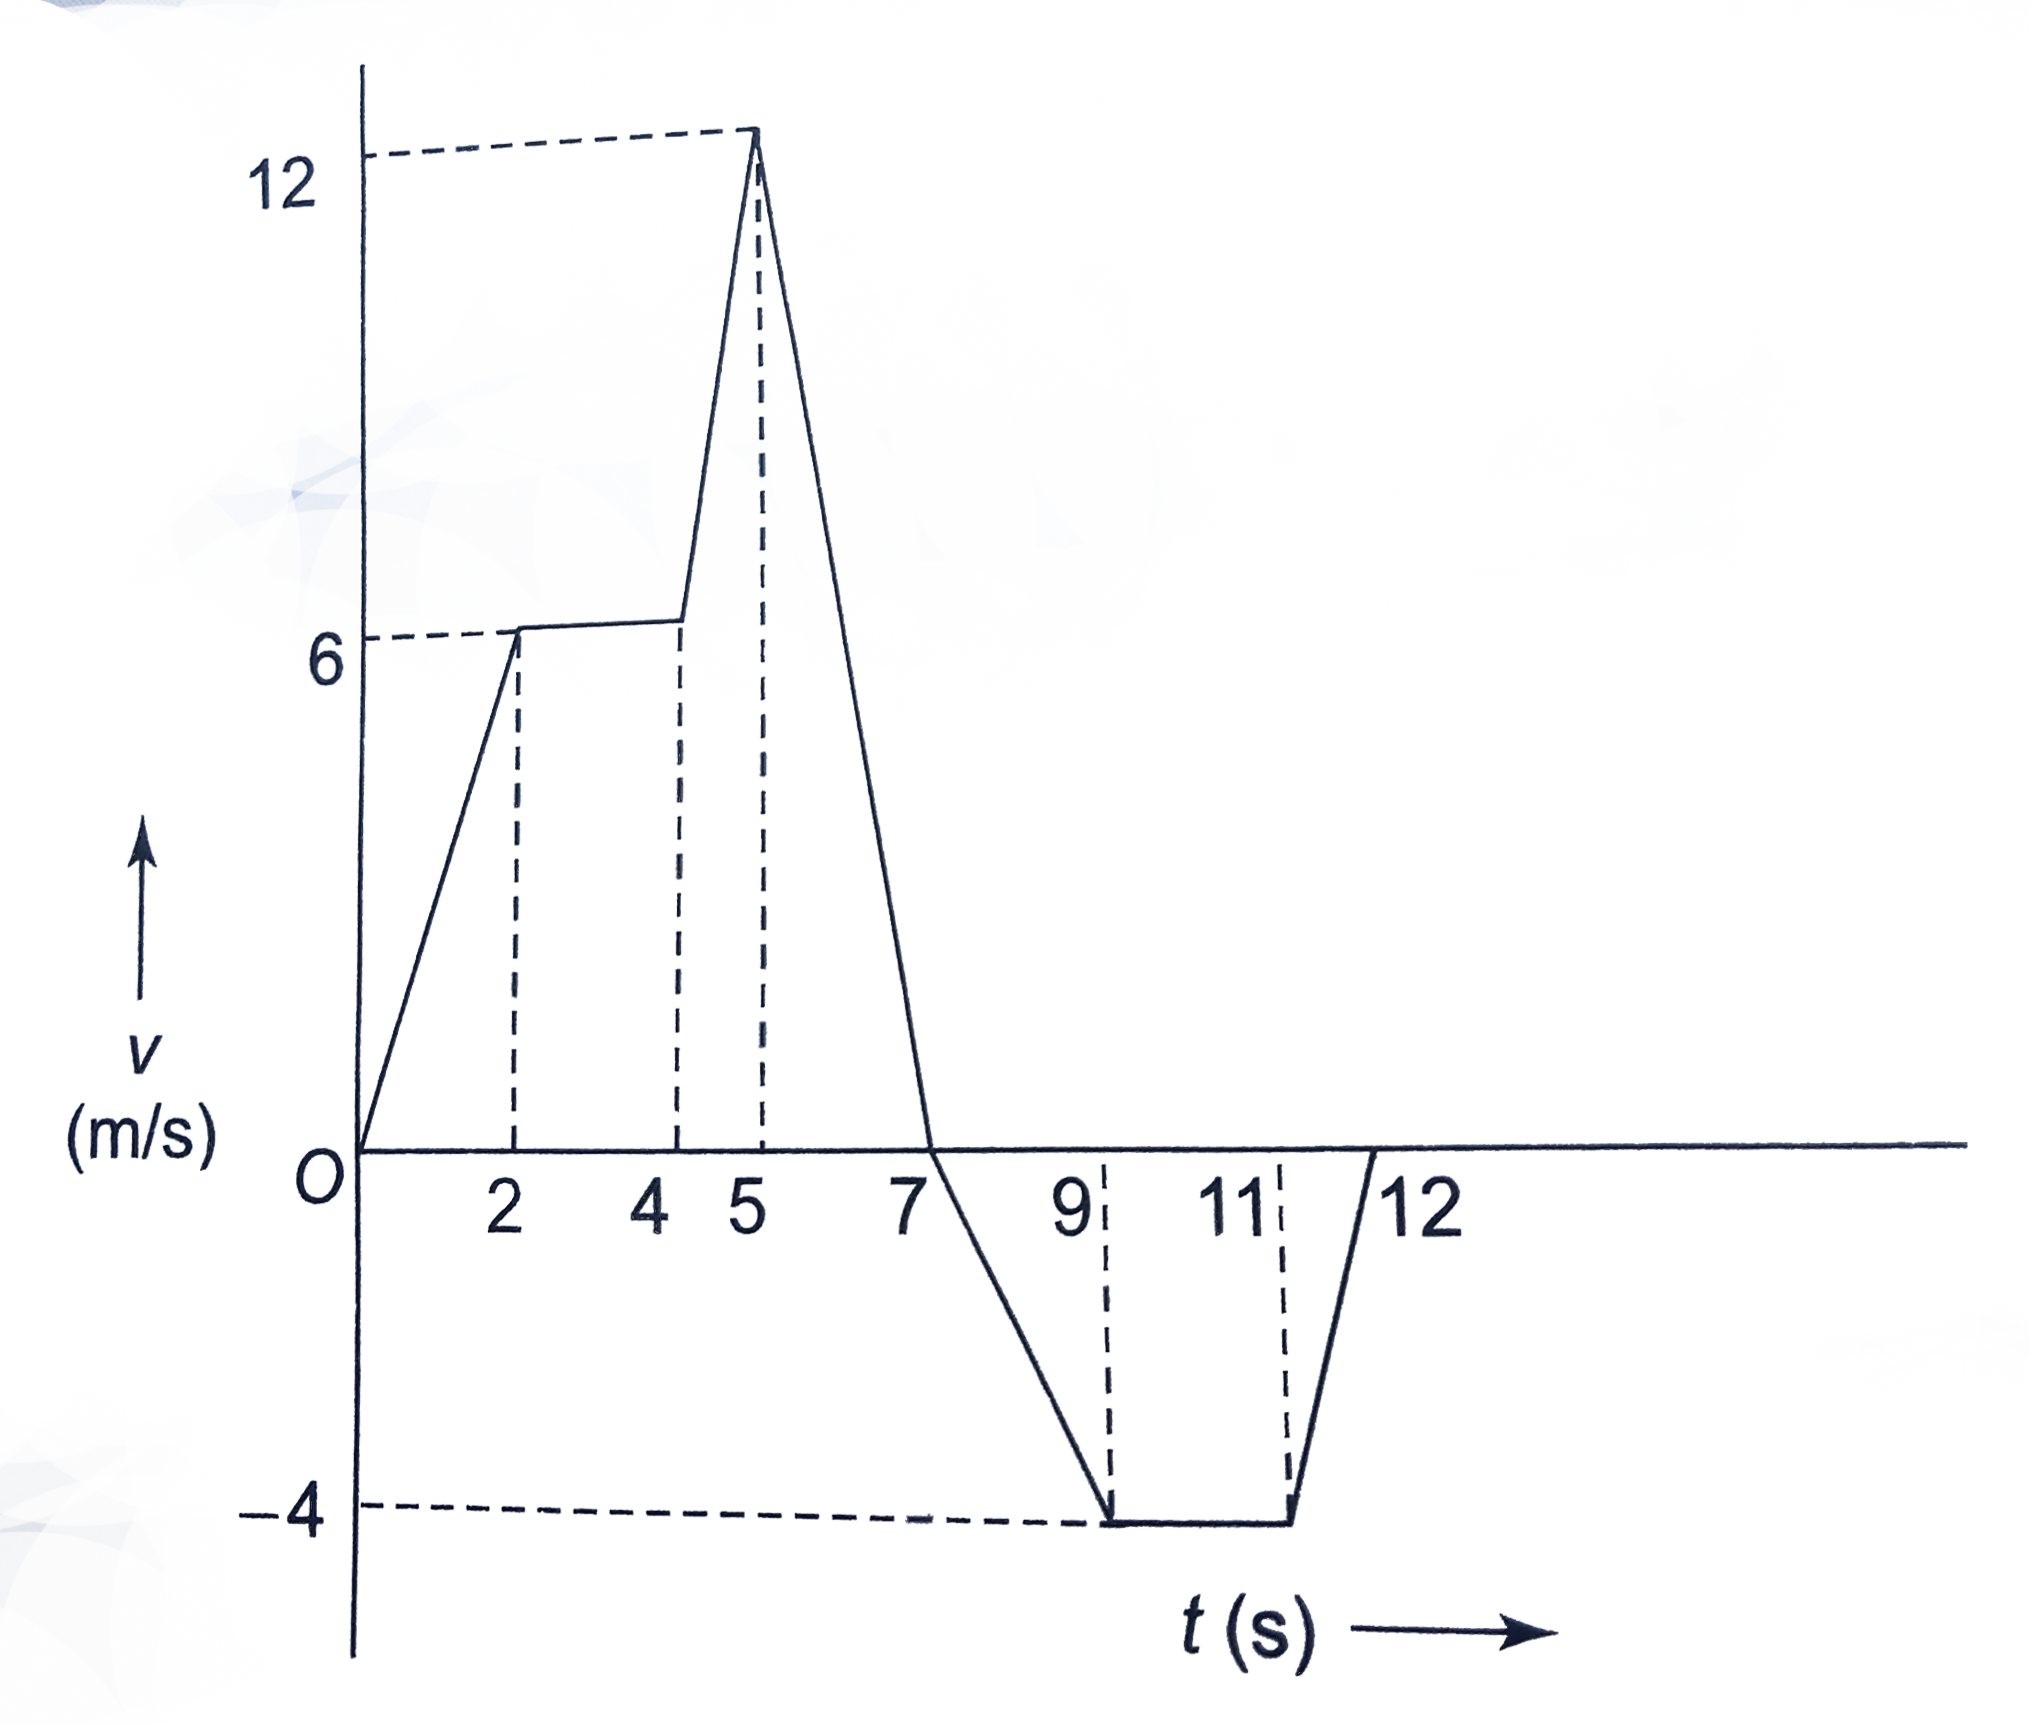
Which segment of the graph represents the retardation?View SolutionStudy the following velocity-time graph. Determine the displacement and distance in the time interval t=0 to t=12s. Sketch the acceleration-time graph.
 View Solution
Knowledge Check
- Question 1 - Select One or More
The velocity time graph of the motion of a car is given here.
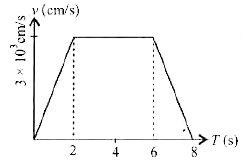 AThe distance travelled by the car in the first six seconds is 150 m.BThe deceleration of the car during the last two seconds are −15ms2.CThe distance travelled by the car in the first six second is 220 m.DThe deceleration of the car during the last two second is −20ms2
 - Question 2 - Select One
The diagram shows a velocity-time graph for a car moving in a straight line. At point Q the car must be
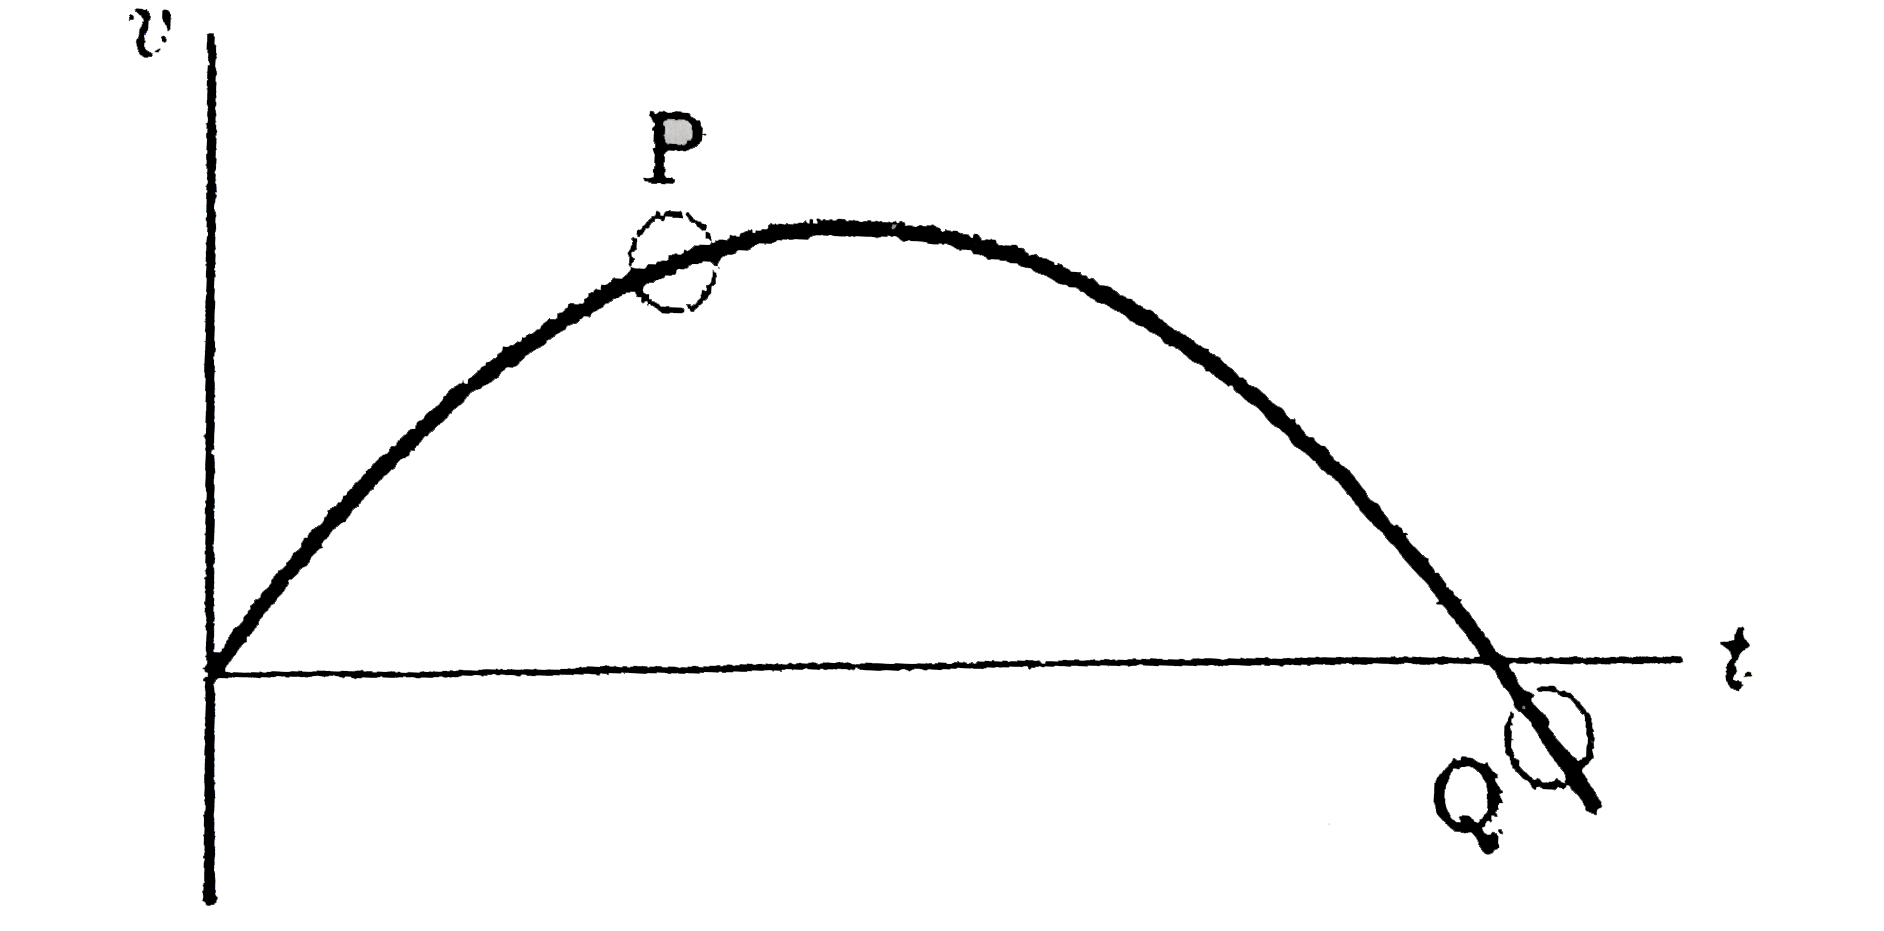 Amoving the with zero accelerationBtravelling in the reverse direction to that at point PCtraveling below ground -levelDmoving with decreasing speed.
 - Question 3 - Select One
The area under velocity-time graph for a particle in a given interval of time represents
AvelocityBaccelerationCwork doneDDisplacement does not tell the nature of the actual motion of a particle between the points.
The v-t graph for a particle moving along x-axis is shown in the figure, find
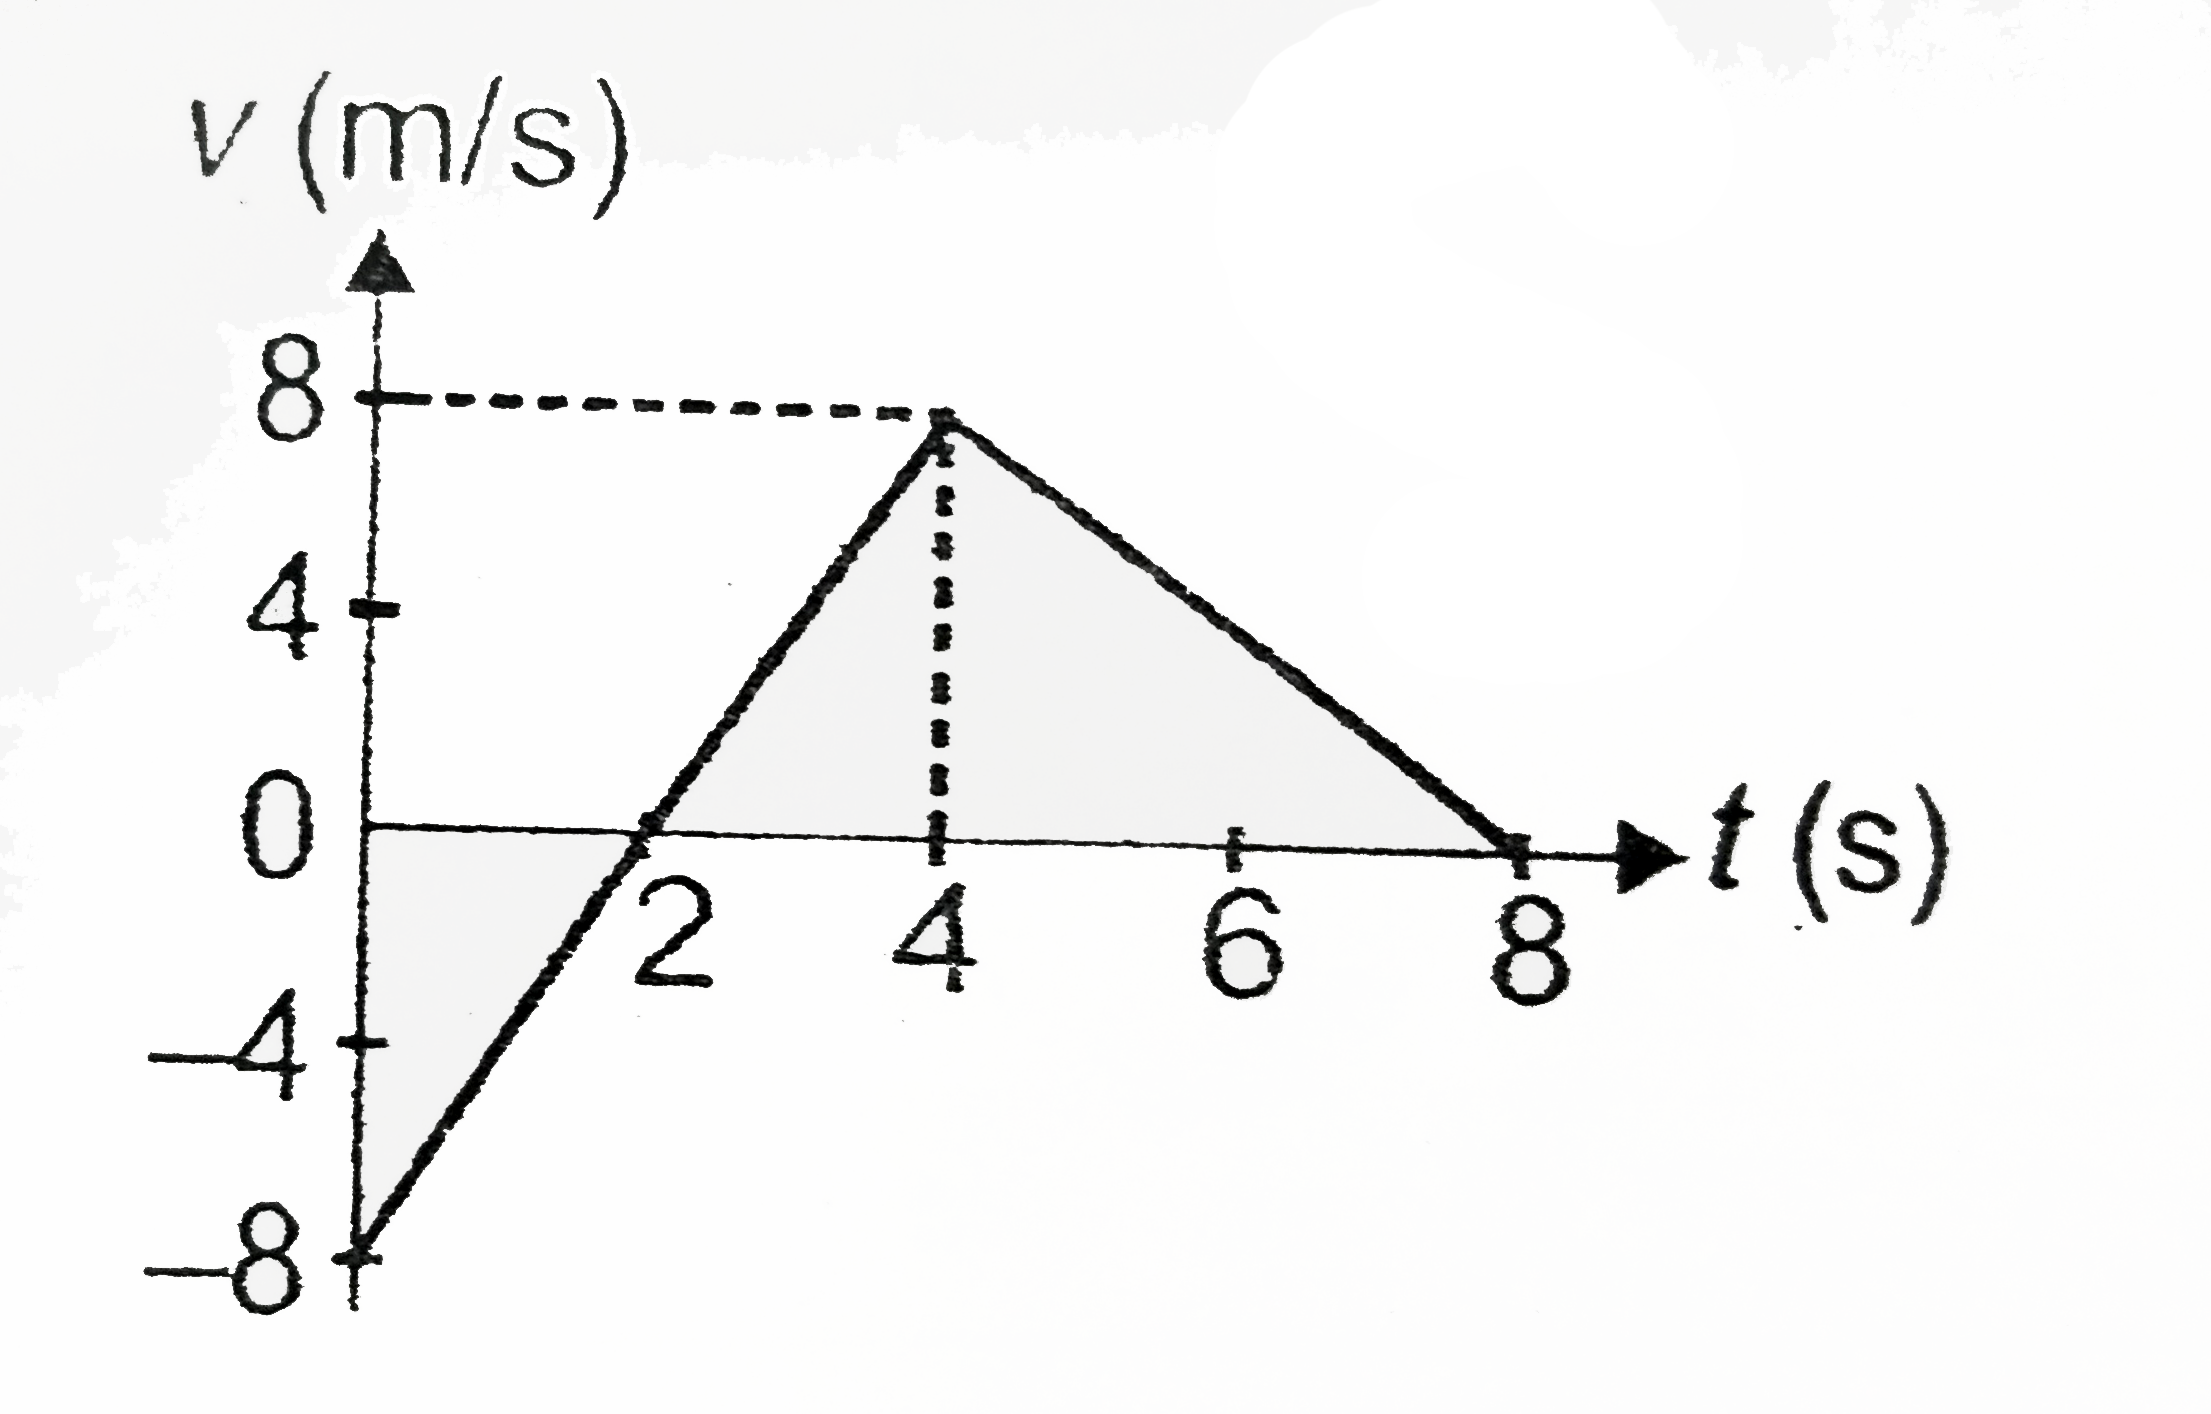
(a) Average velocity in the interval 0 to 8 s.
(b) Average speed in the interval 0 to 8 s.
(c) Average acceleration in the interval 0 to 4 s.
(d) Instantaneous acceleration at t = 2.5 s.View SolutionThe velocity of a car as a function of time is shown in Fig. Find the distance travelled by the car in 8s and its acceleration.
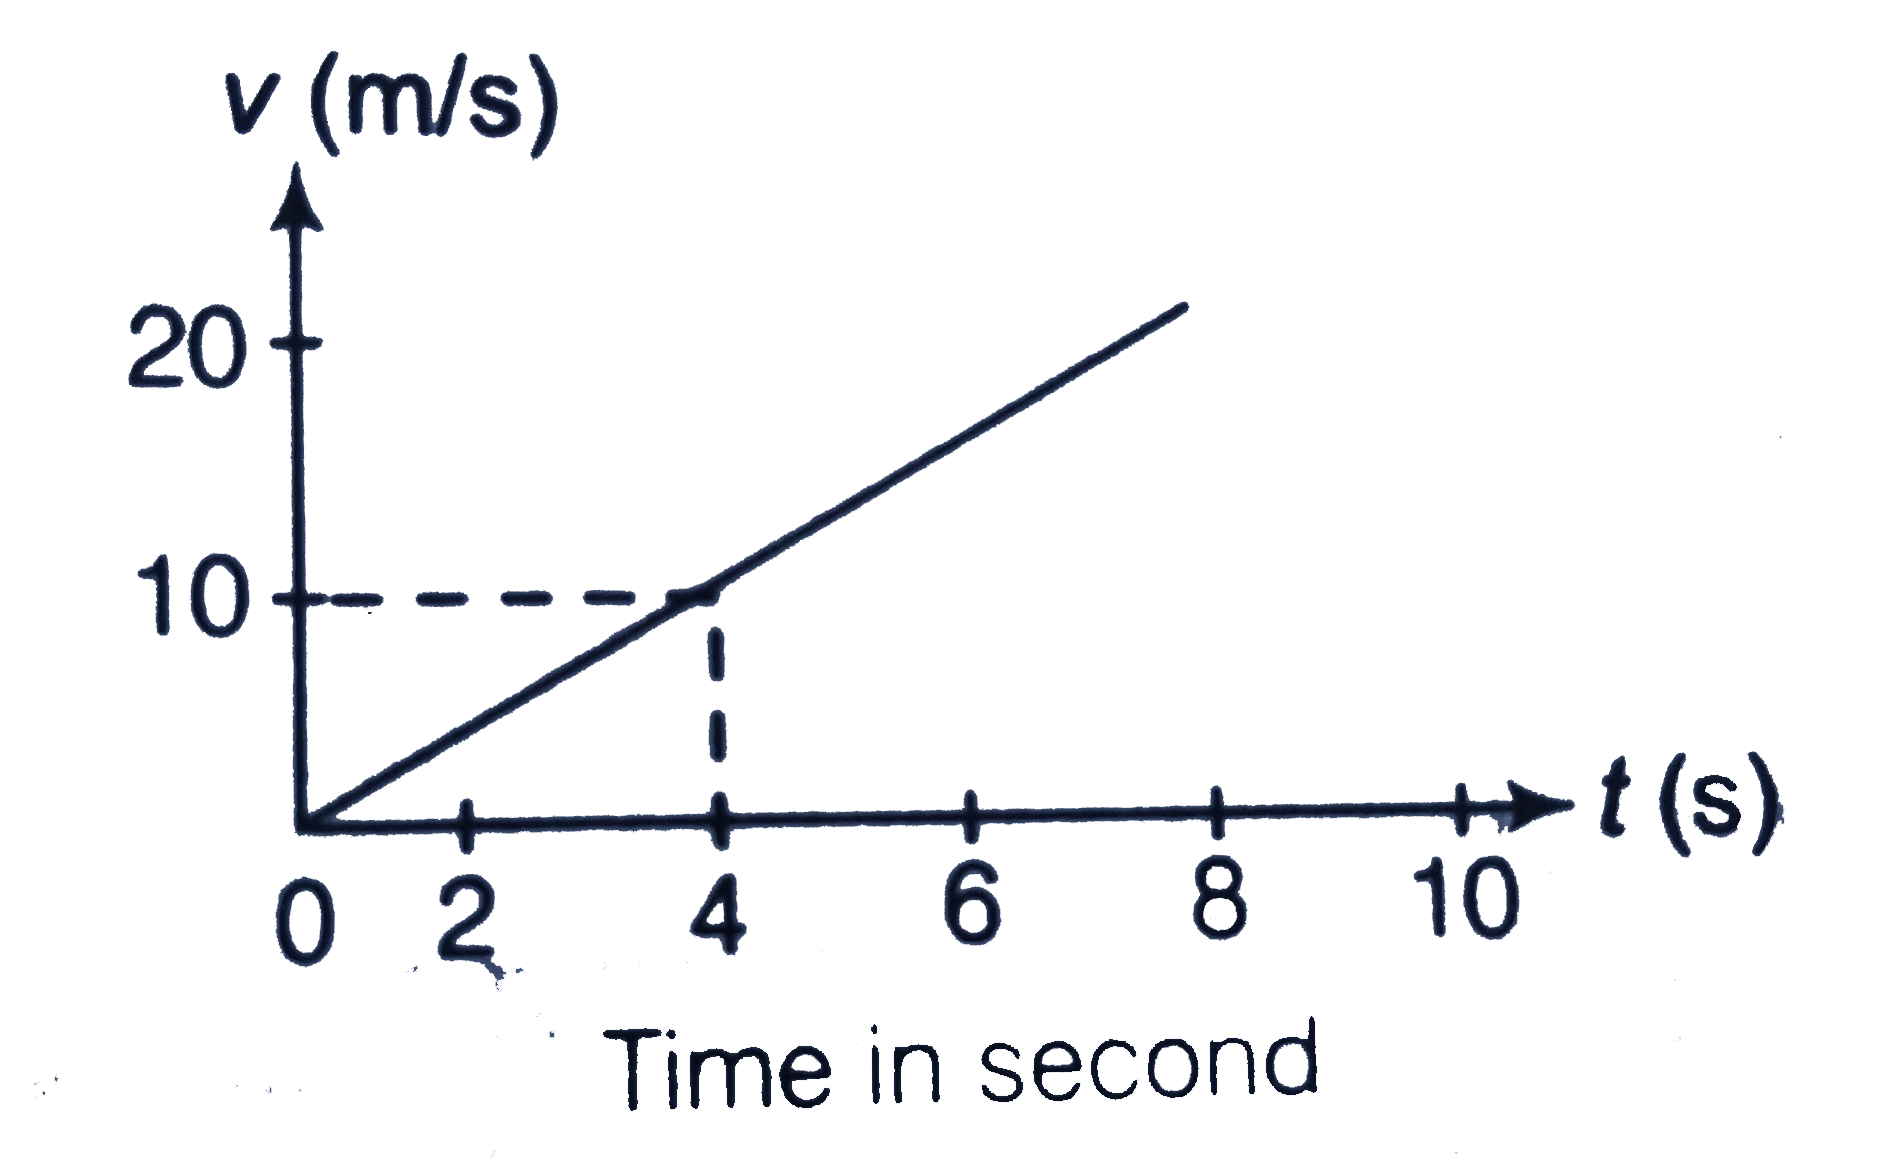 View Solution
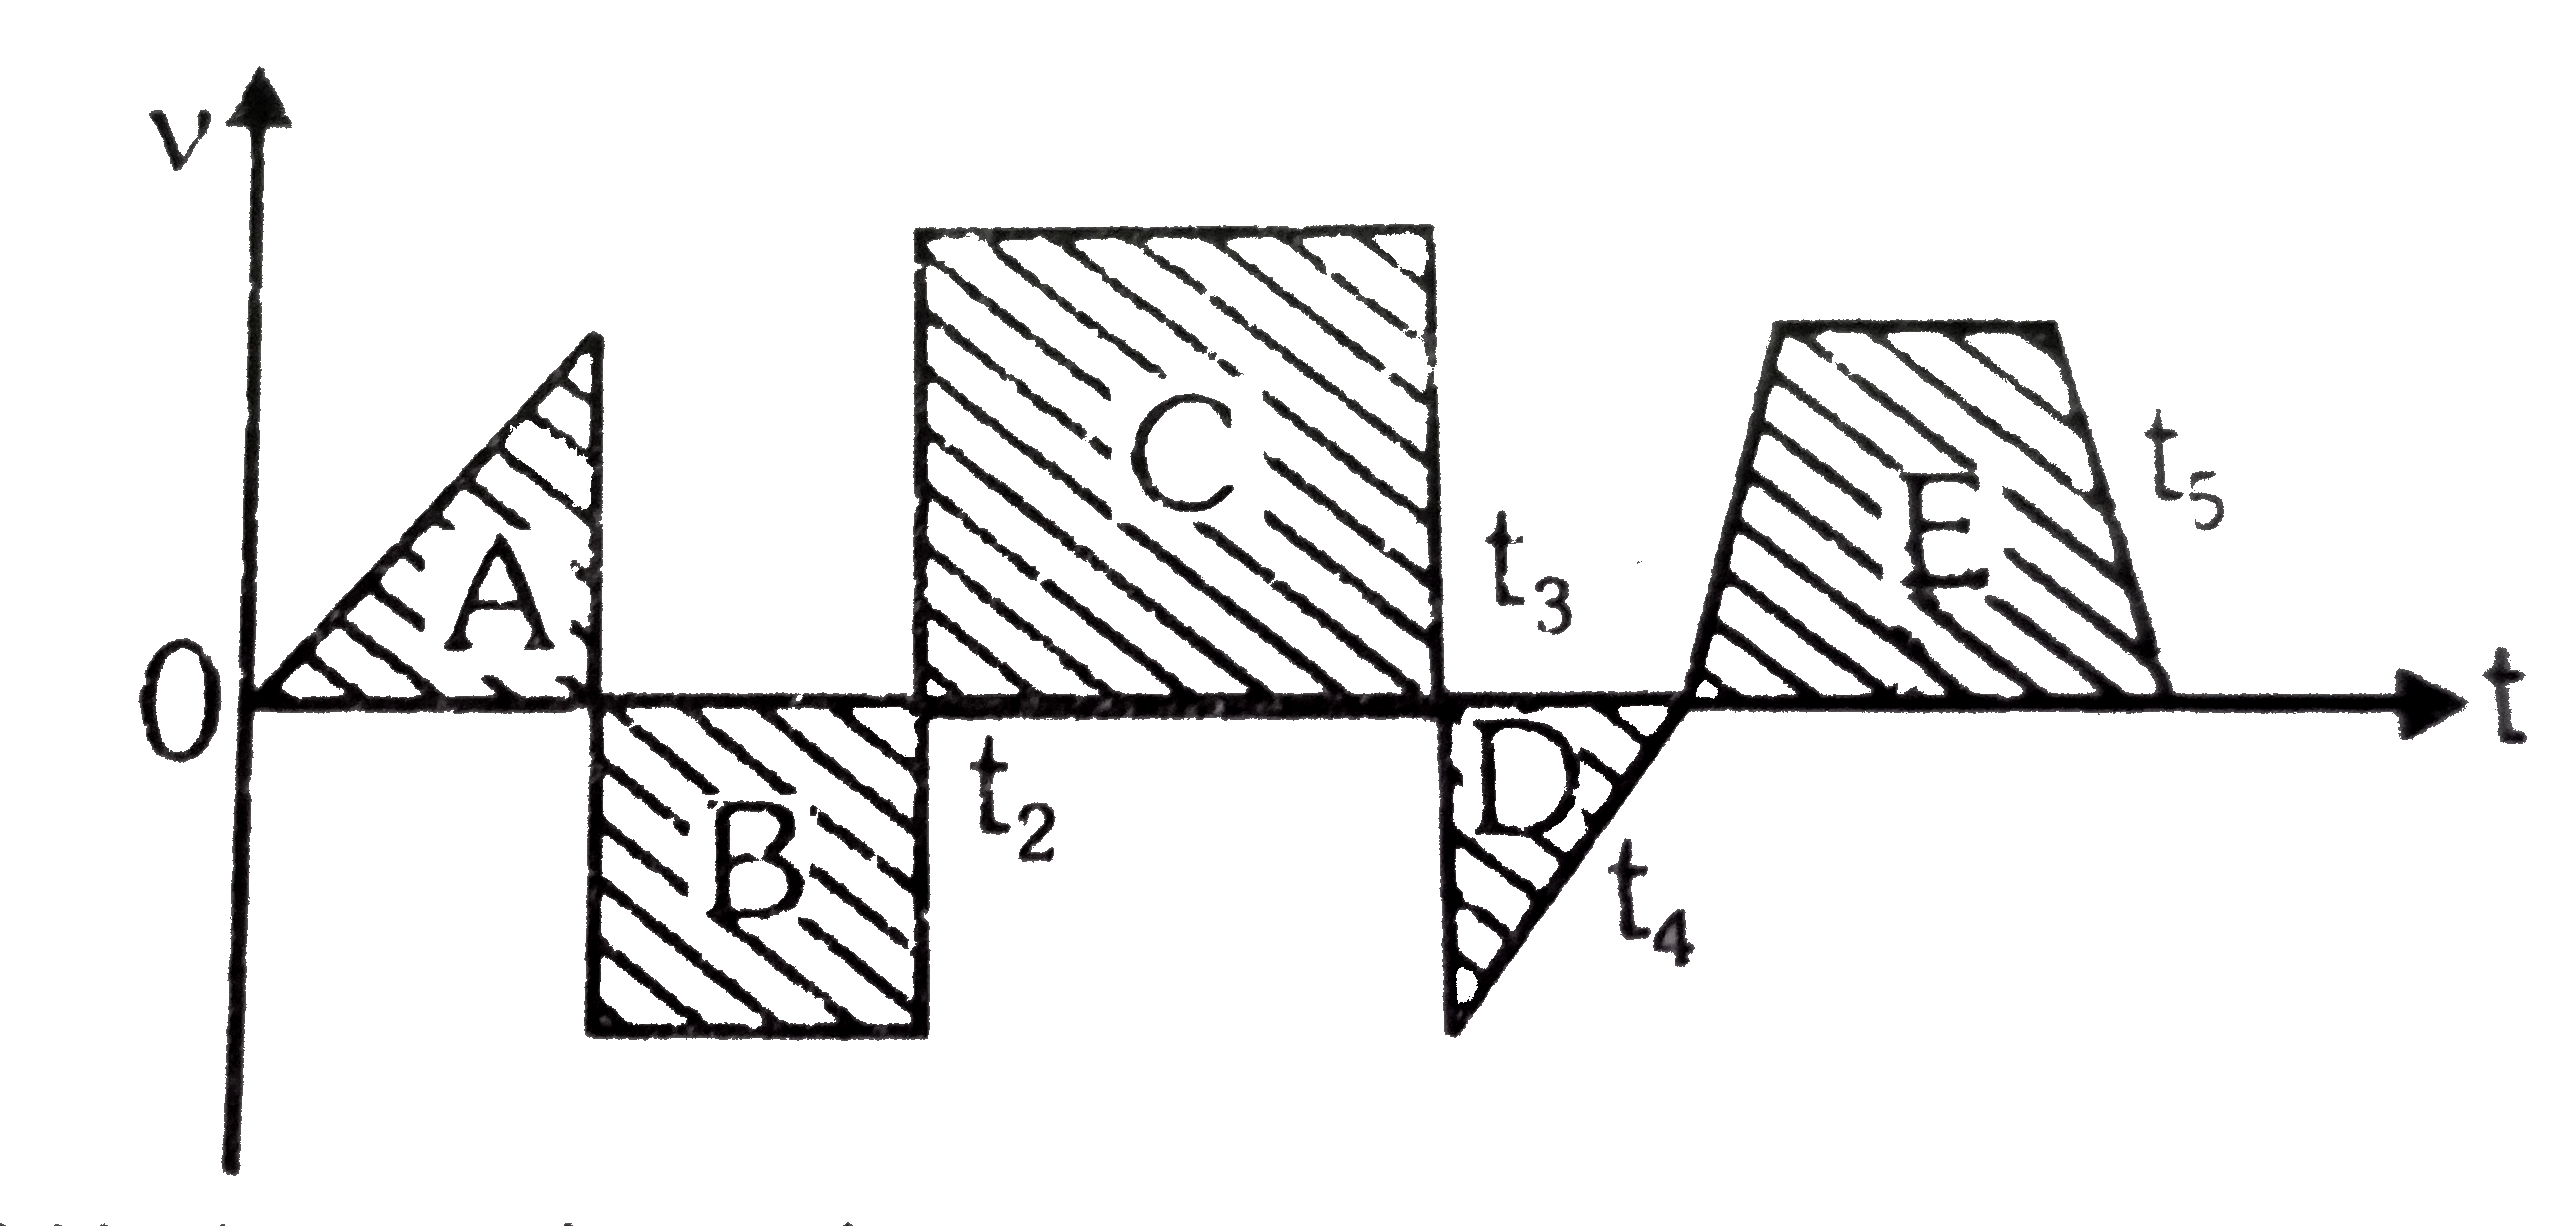
The velocity-time graph of an objects is as shown. The displacement during the interval 0 to t4 is
 View Solution
In the above problem the acceleration of the rocket during burning interval is :
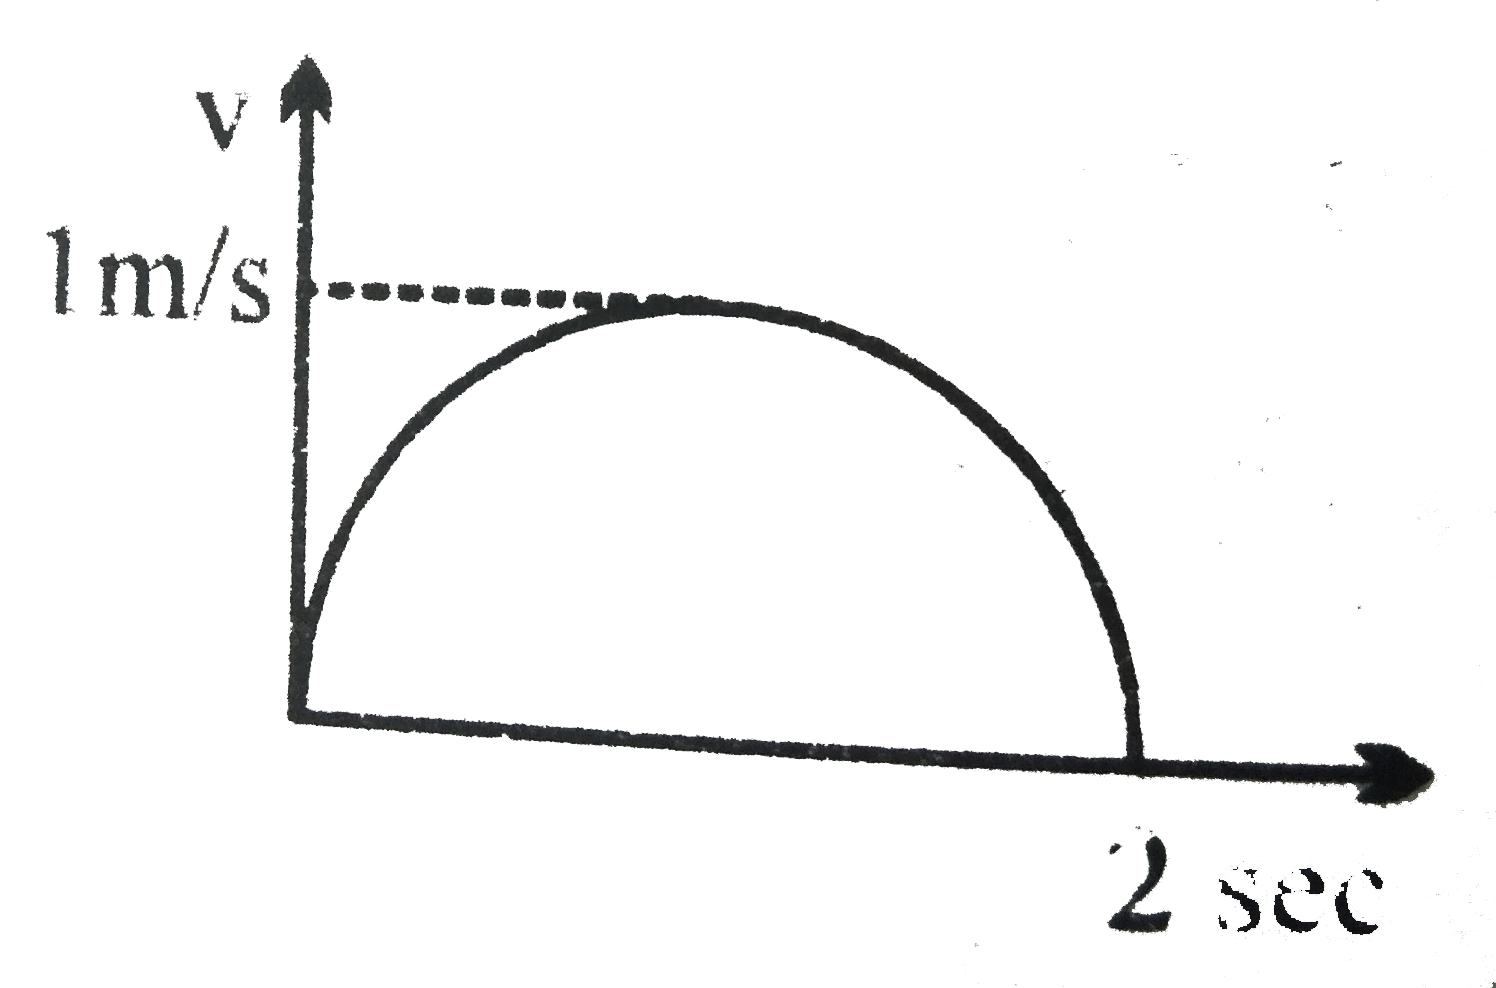
View SolutionVelocity-time graph for a car is semicircle as shown here. Which of the following is correct:
 View Solution

