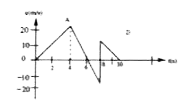
Velocity-time graph for a body moving with retardation is shown. Calculate the (i) retardation and (ii) displacement of the body.

(i) Here, retardation=Decrease in velocitytime taken
=(10−0)m/s(5−0)s=105m/s2=2m/s2
(ii) Displacement=Area of velocity-time graph
=Area of ΔAOB
=12×OB×OA=(12×5×10)m=25m.
Similar Questions
Knowledge Check
- Question 1 - Select One or More
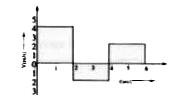
The velocity-time graph of a body moving in a straight line is shown in the figure.
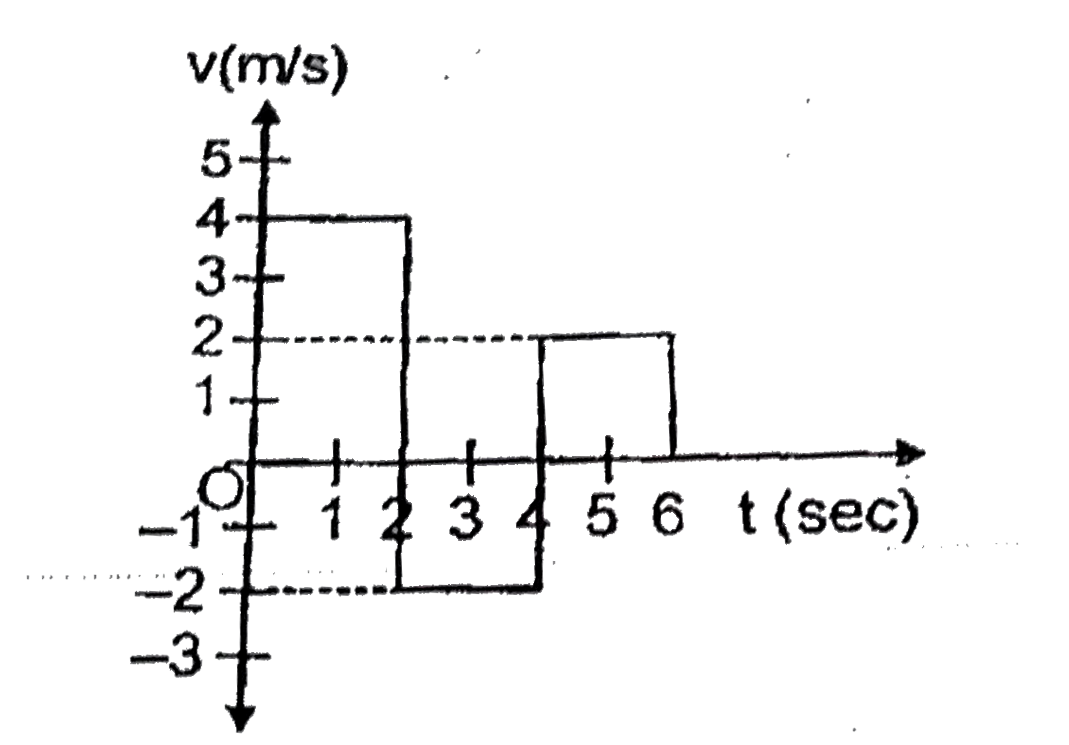 AThe magnitude of displacement of the body in 1st 2 sec is 8 mBThe magnitude of displacement of the body in 1st 4 sec is 4 mCThe distance travelled in 1st 2 sec is 8 mDThe distance travelled in 1st 4 sec is 12 m
 - Question 2 - Select One
The velocit-time graph of a body moving in a straight line is shown in Fig. 2 (d) . 32. Find the displacement and the distance travelled by the body in 6seconds.
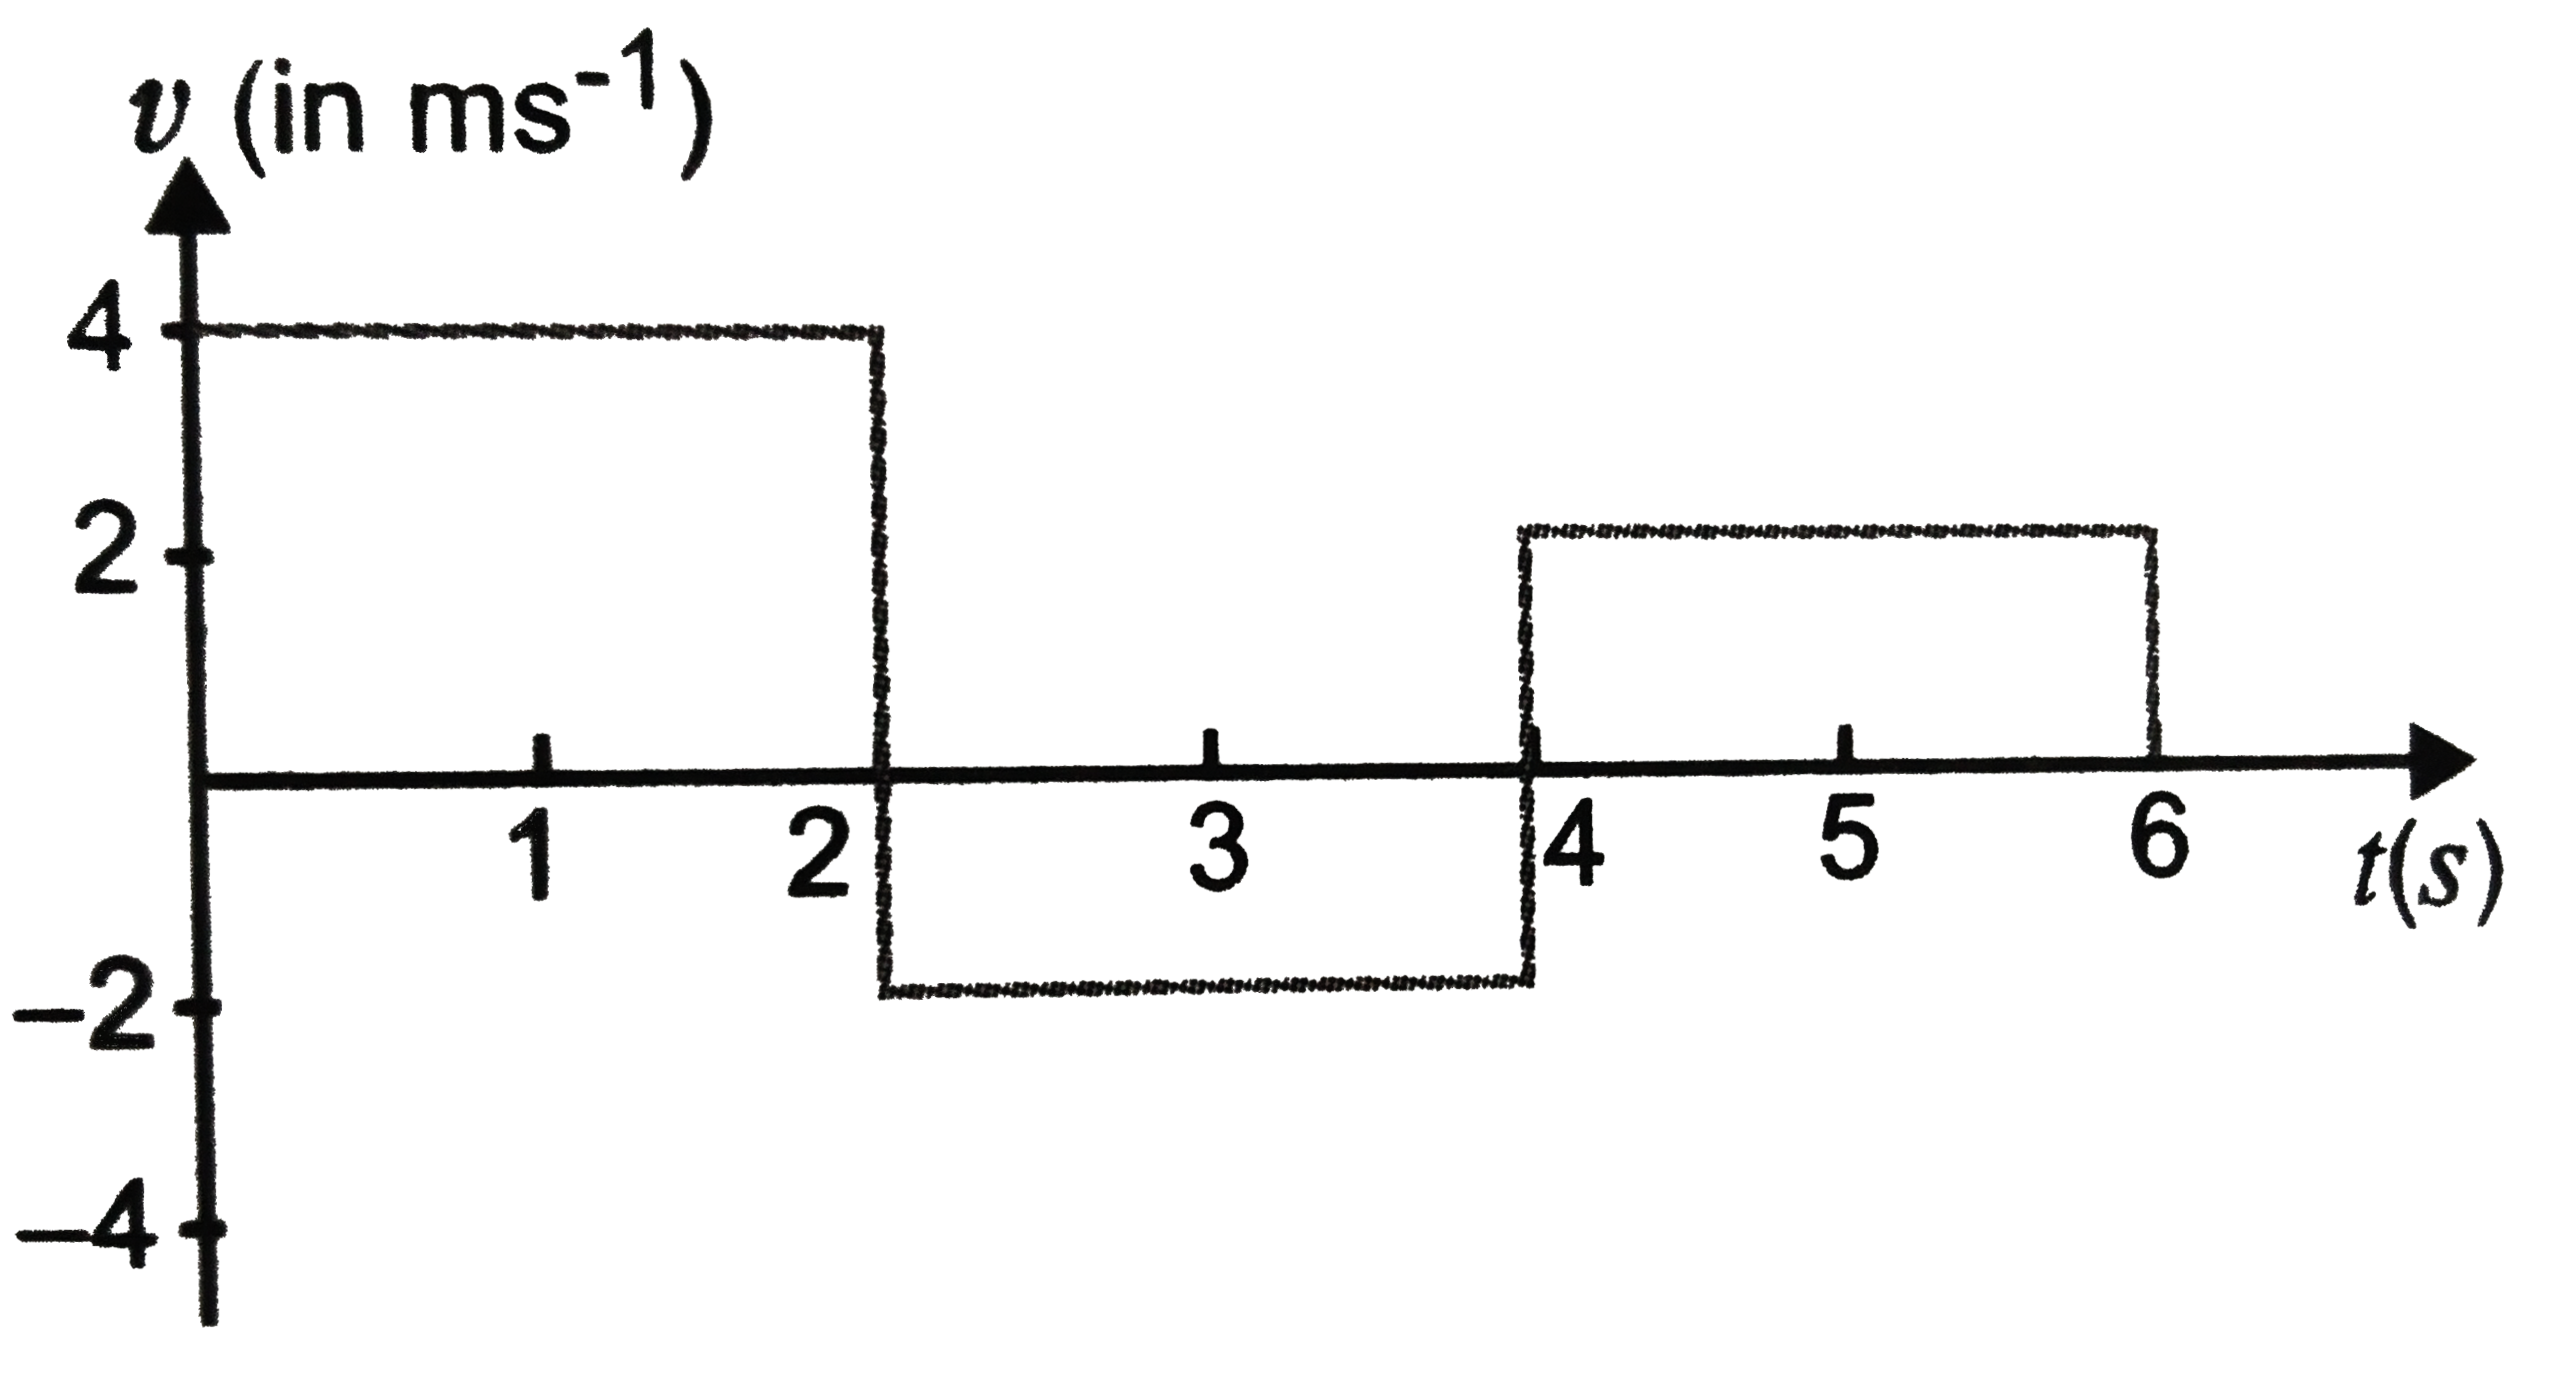 .A8 m , 16 mB16 m, 8 mC16m, 16mD8 m, 8 m
 - Question 3 - Select One
The velocity versus time graph of a body moving along a straight line is as shown in figure. The ratio of displacement and distance covered body in 5 second is :-
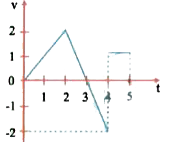 A2:3B3:5C1:1D1:5:5
The velocity time graph of a body moving in a straight line is shown in the figure. The displacement and distance travelled by the body in 6 sec are respectively.
 View Solution
A displacement -time graph of a body moving with uniform velocity is shown in the figure. Find out its velocity and its displacement at the end of 5 seconds
View SolutionThe velocity versus time graph of a body moving along a straight path is shown below.
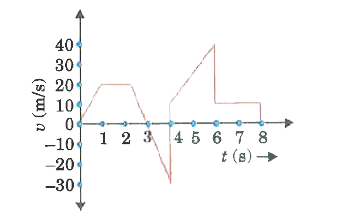
(i) Calculate the distance covered by the body from t=0 to t=8s.
(ii) find its net displacement from t=0 to 8 s.View SolutionThe velocity time graph of a body moving in a straight line is as follows. Find the magnitude of displacement of body and distance travelled by body during first 6 seconds.
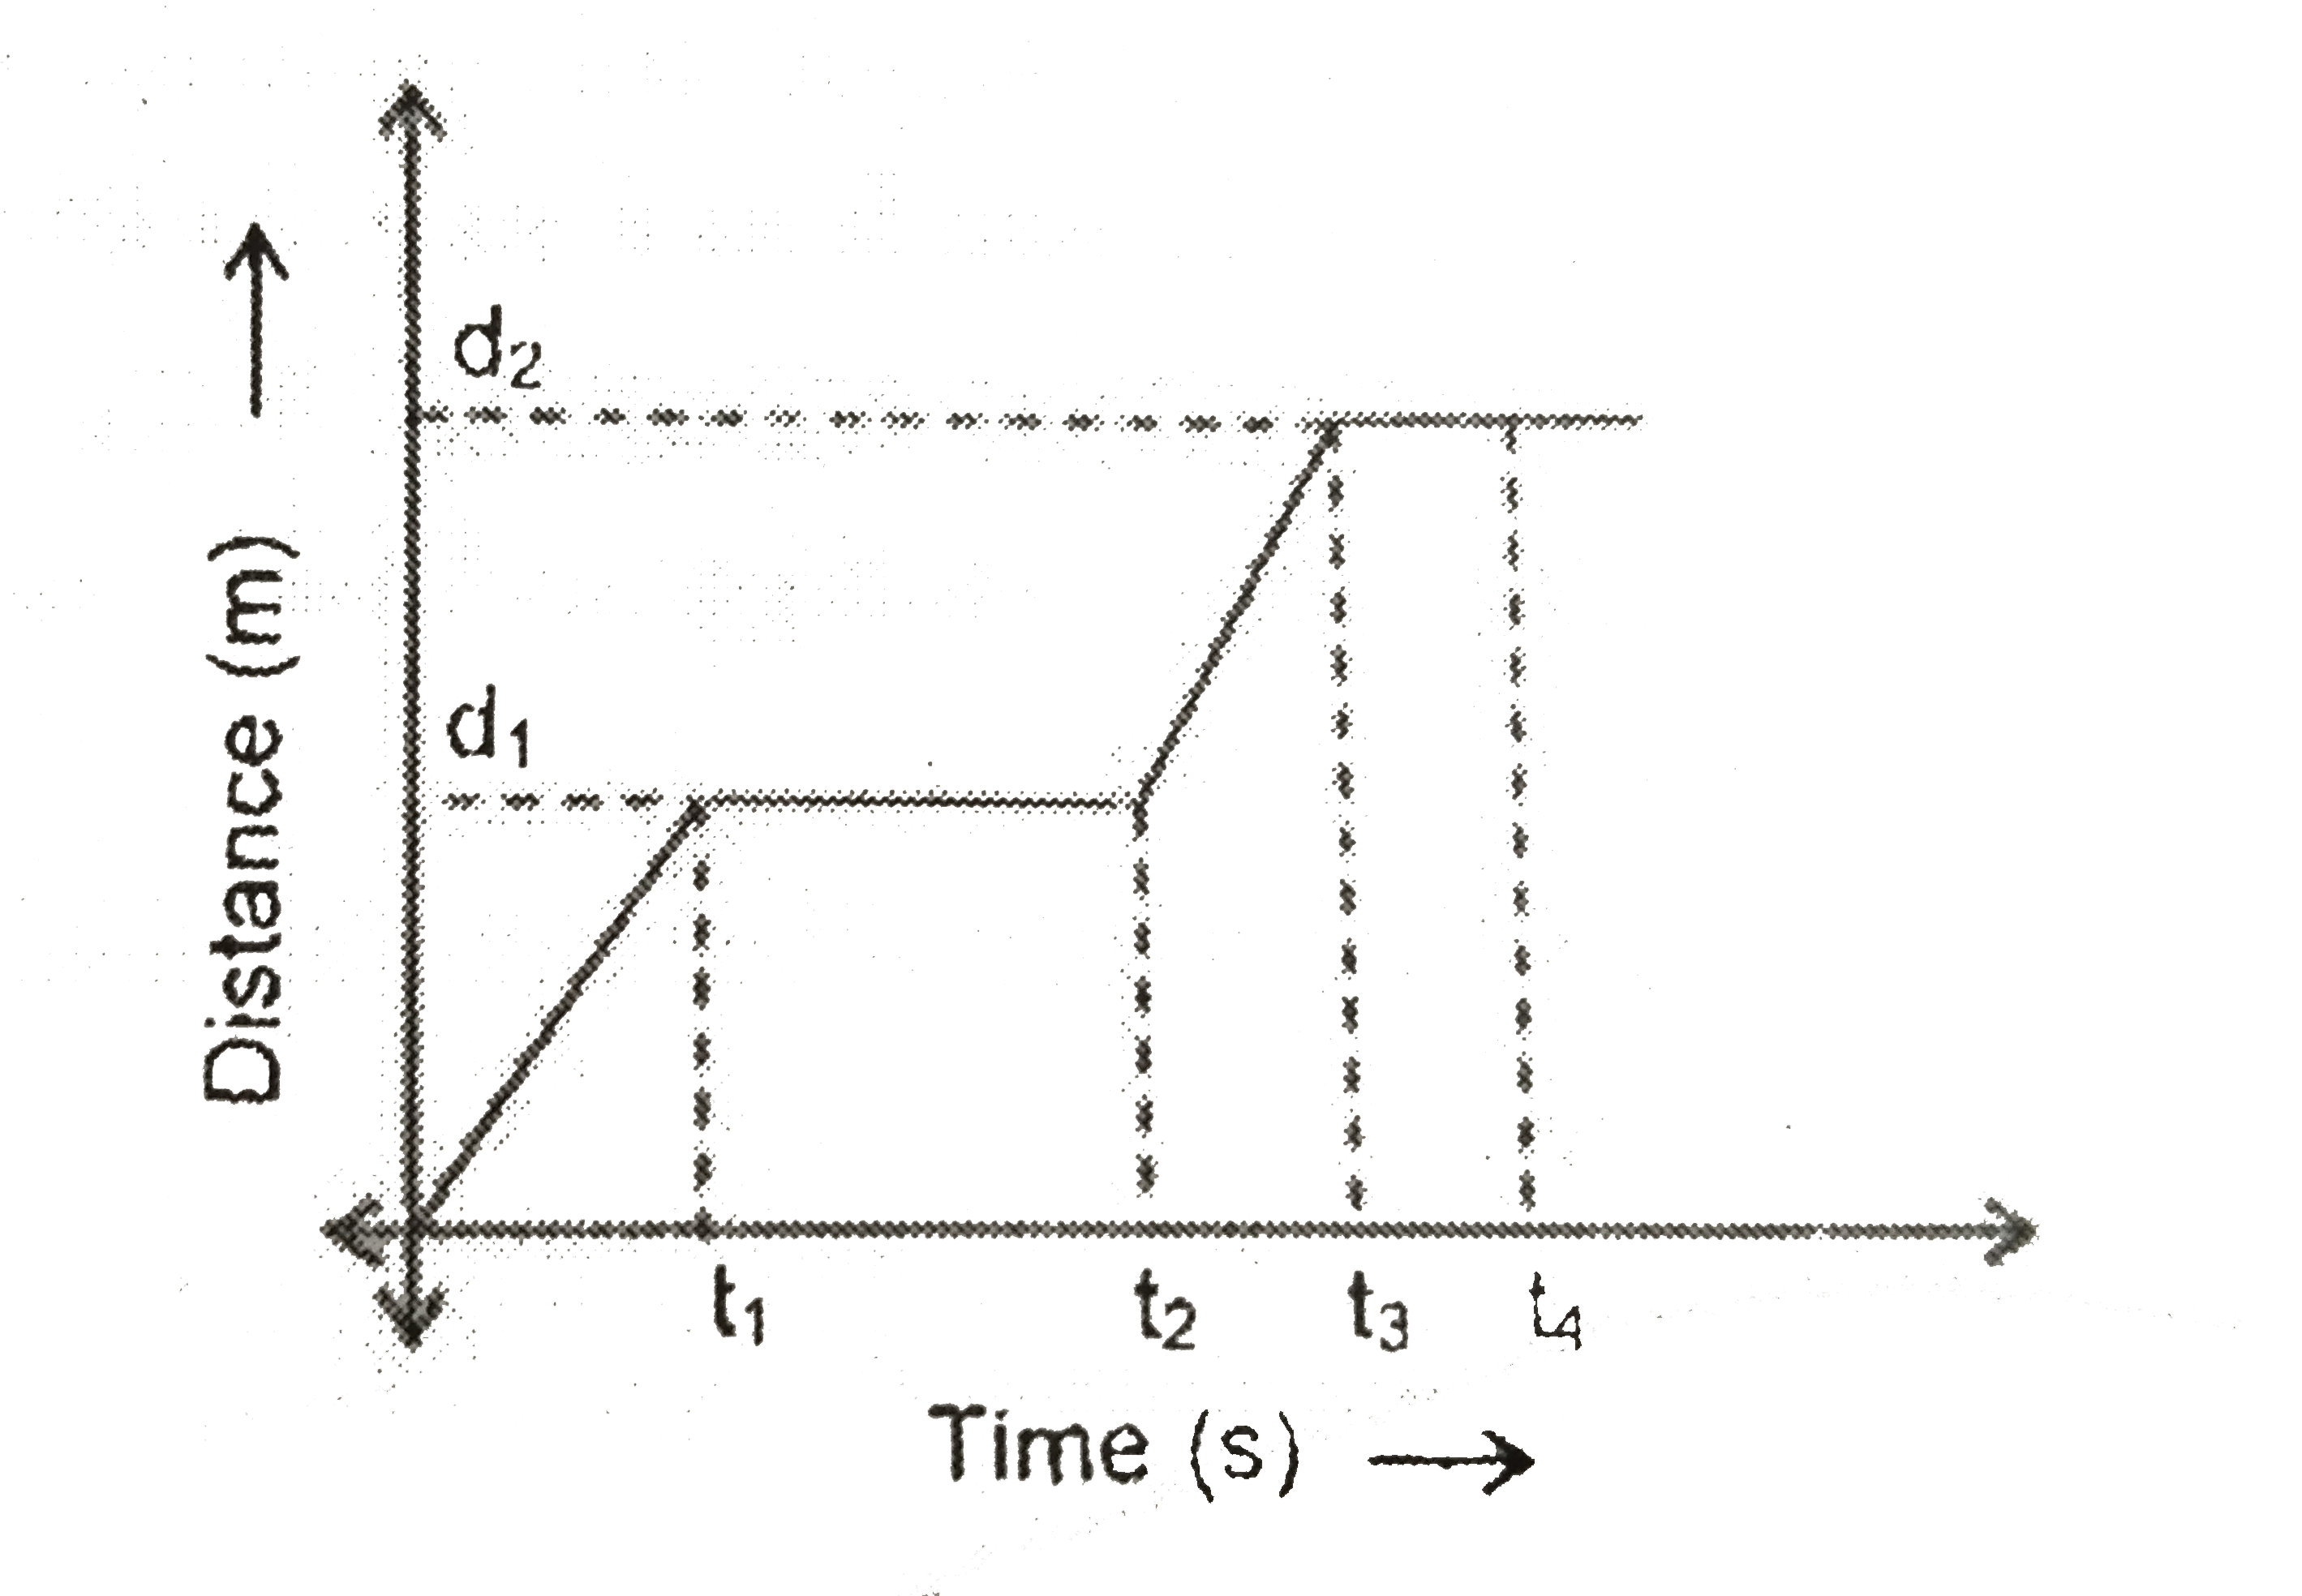
View SolutionThe distance -time graph of a body moving in a straight line is shown below. Draw the speed time graph of the motion of the body.
 View Solution


