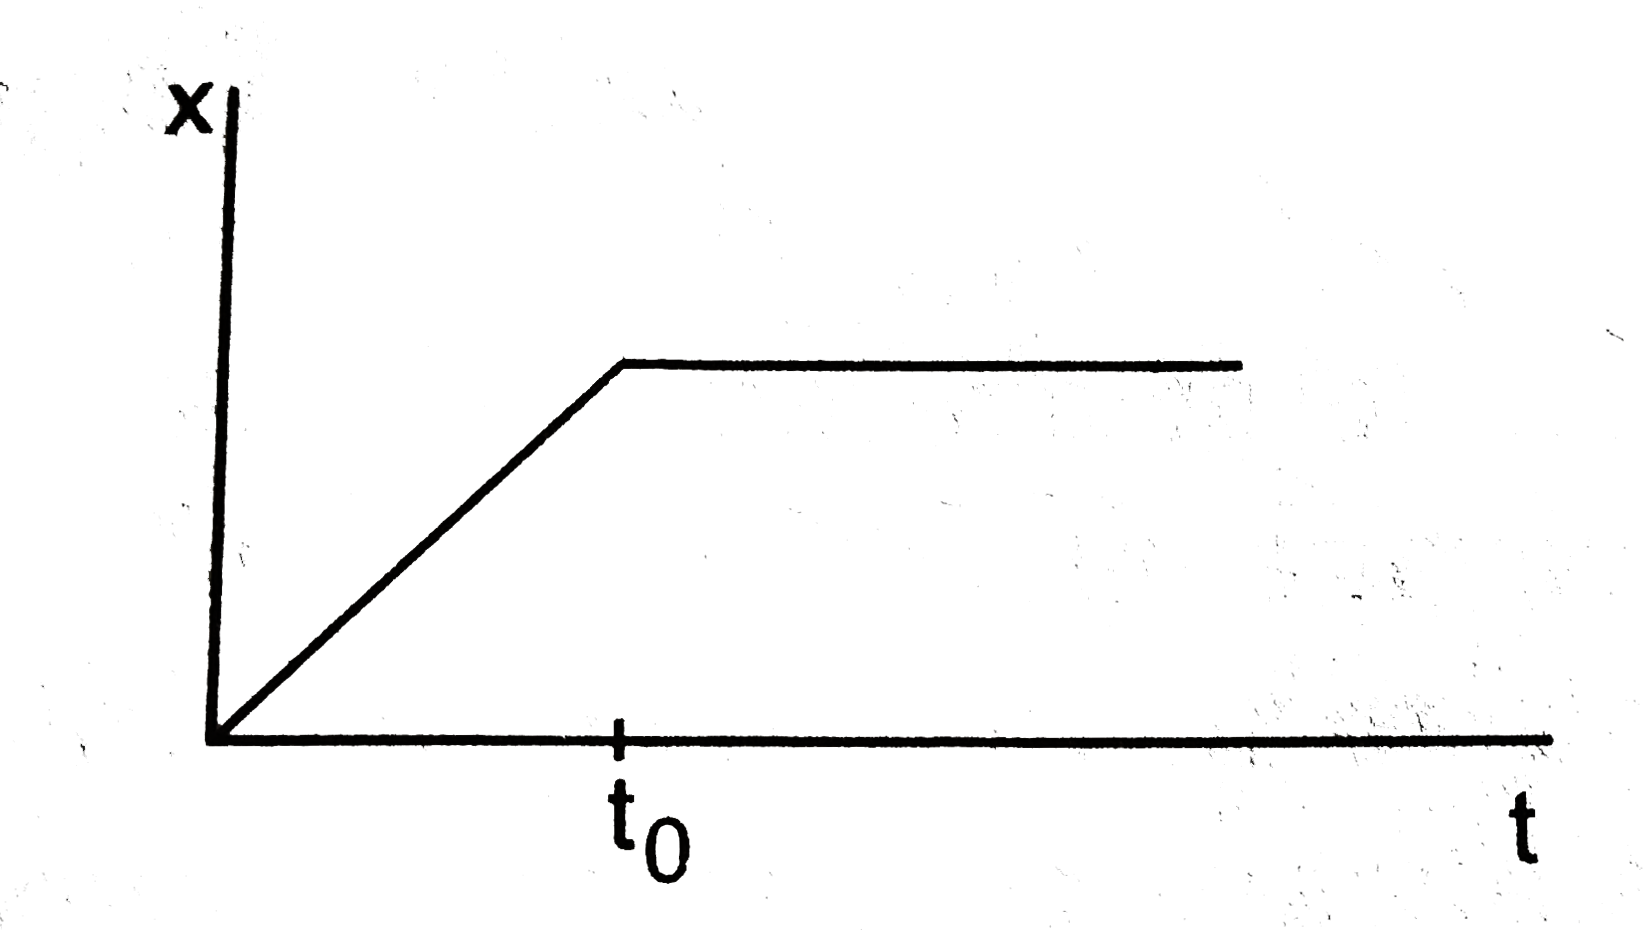
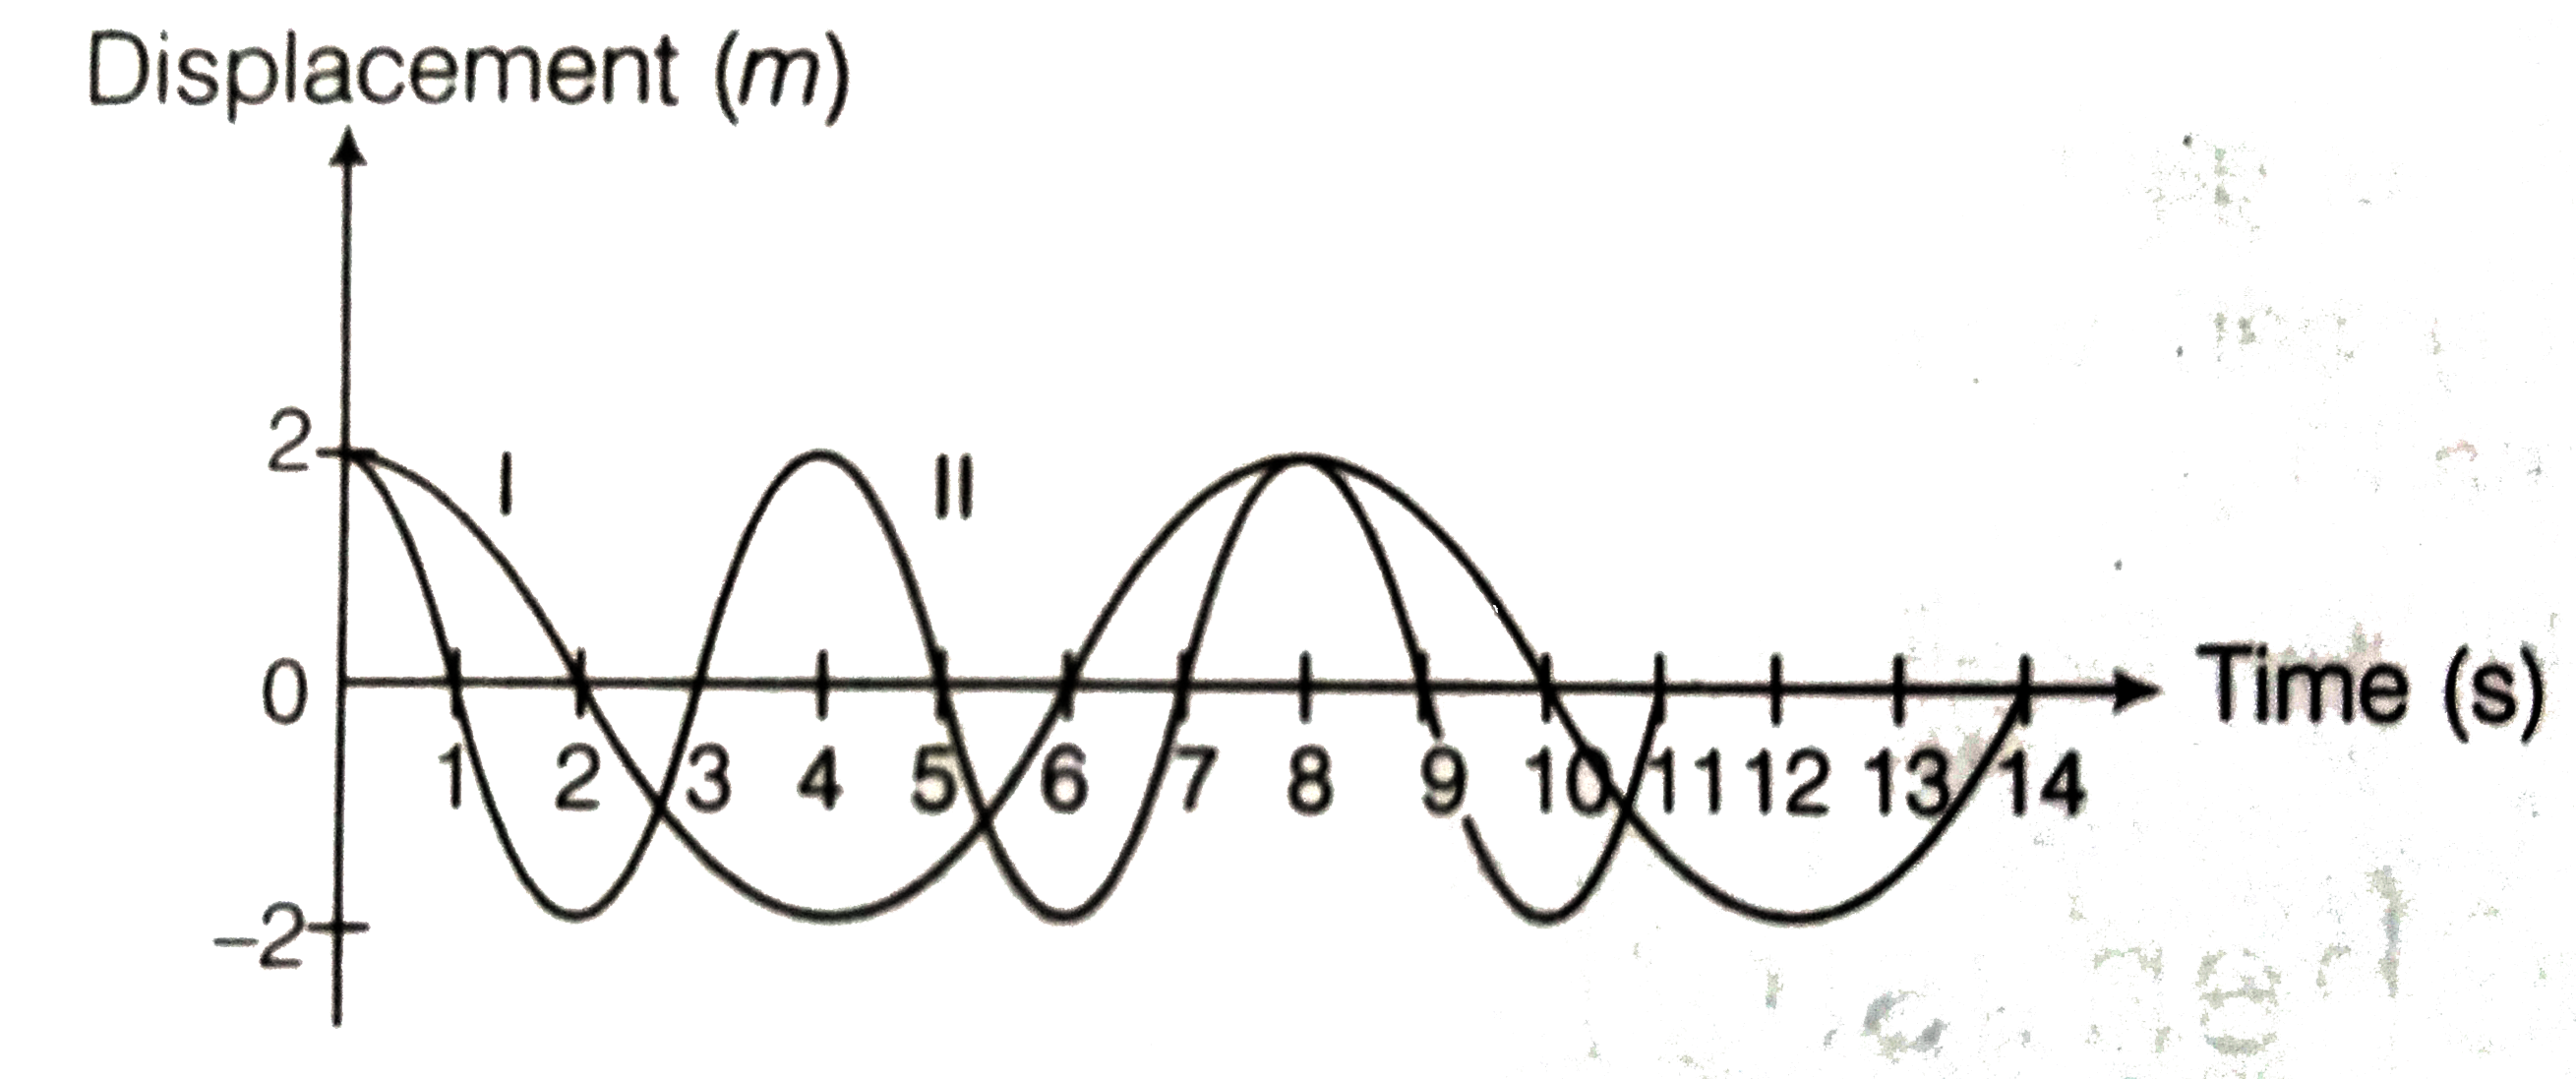
Figure shows the displacement time graphs of two simple harmonic motions I and II. From the graph it follows that
curve I has same frequency as that of curve II
curve I has a frequency twice that of curve II
curve I has a frequency half that of cure II
curve I has frequency four times that of curve II
The correct Answer is:C
For the first curve, one oscillation is completed in 8 s.
Period T1=8s
∴ Frequency n1=1T1=18Hz
For the second curve, one oscillation is completed in 4s.
∴Period T2=4s and frequency n2=1T2=14Hz
∴n1n2=1/81/4=12orn1=12n2
Thus (c ) is the correct option.
Topper's Solved these Questions
Similar Questions
Knowledge Check
- Question 1 - Select One
Figure show the displacement - time graph of a particle moving on the x-axis
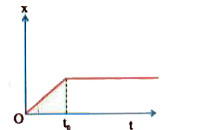 Athe particle is continuously going in positive X directionBthe particle is at restCthe velocity increases up to a time t0 and then becomes constant.Dthe particle moves at constant velocity up to a time t0 and then stops.
 - Question 2 - Select One
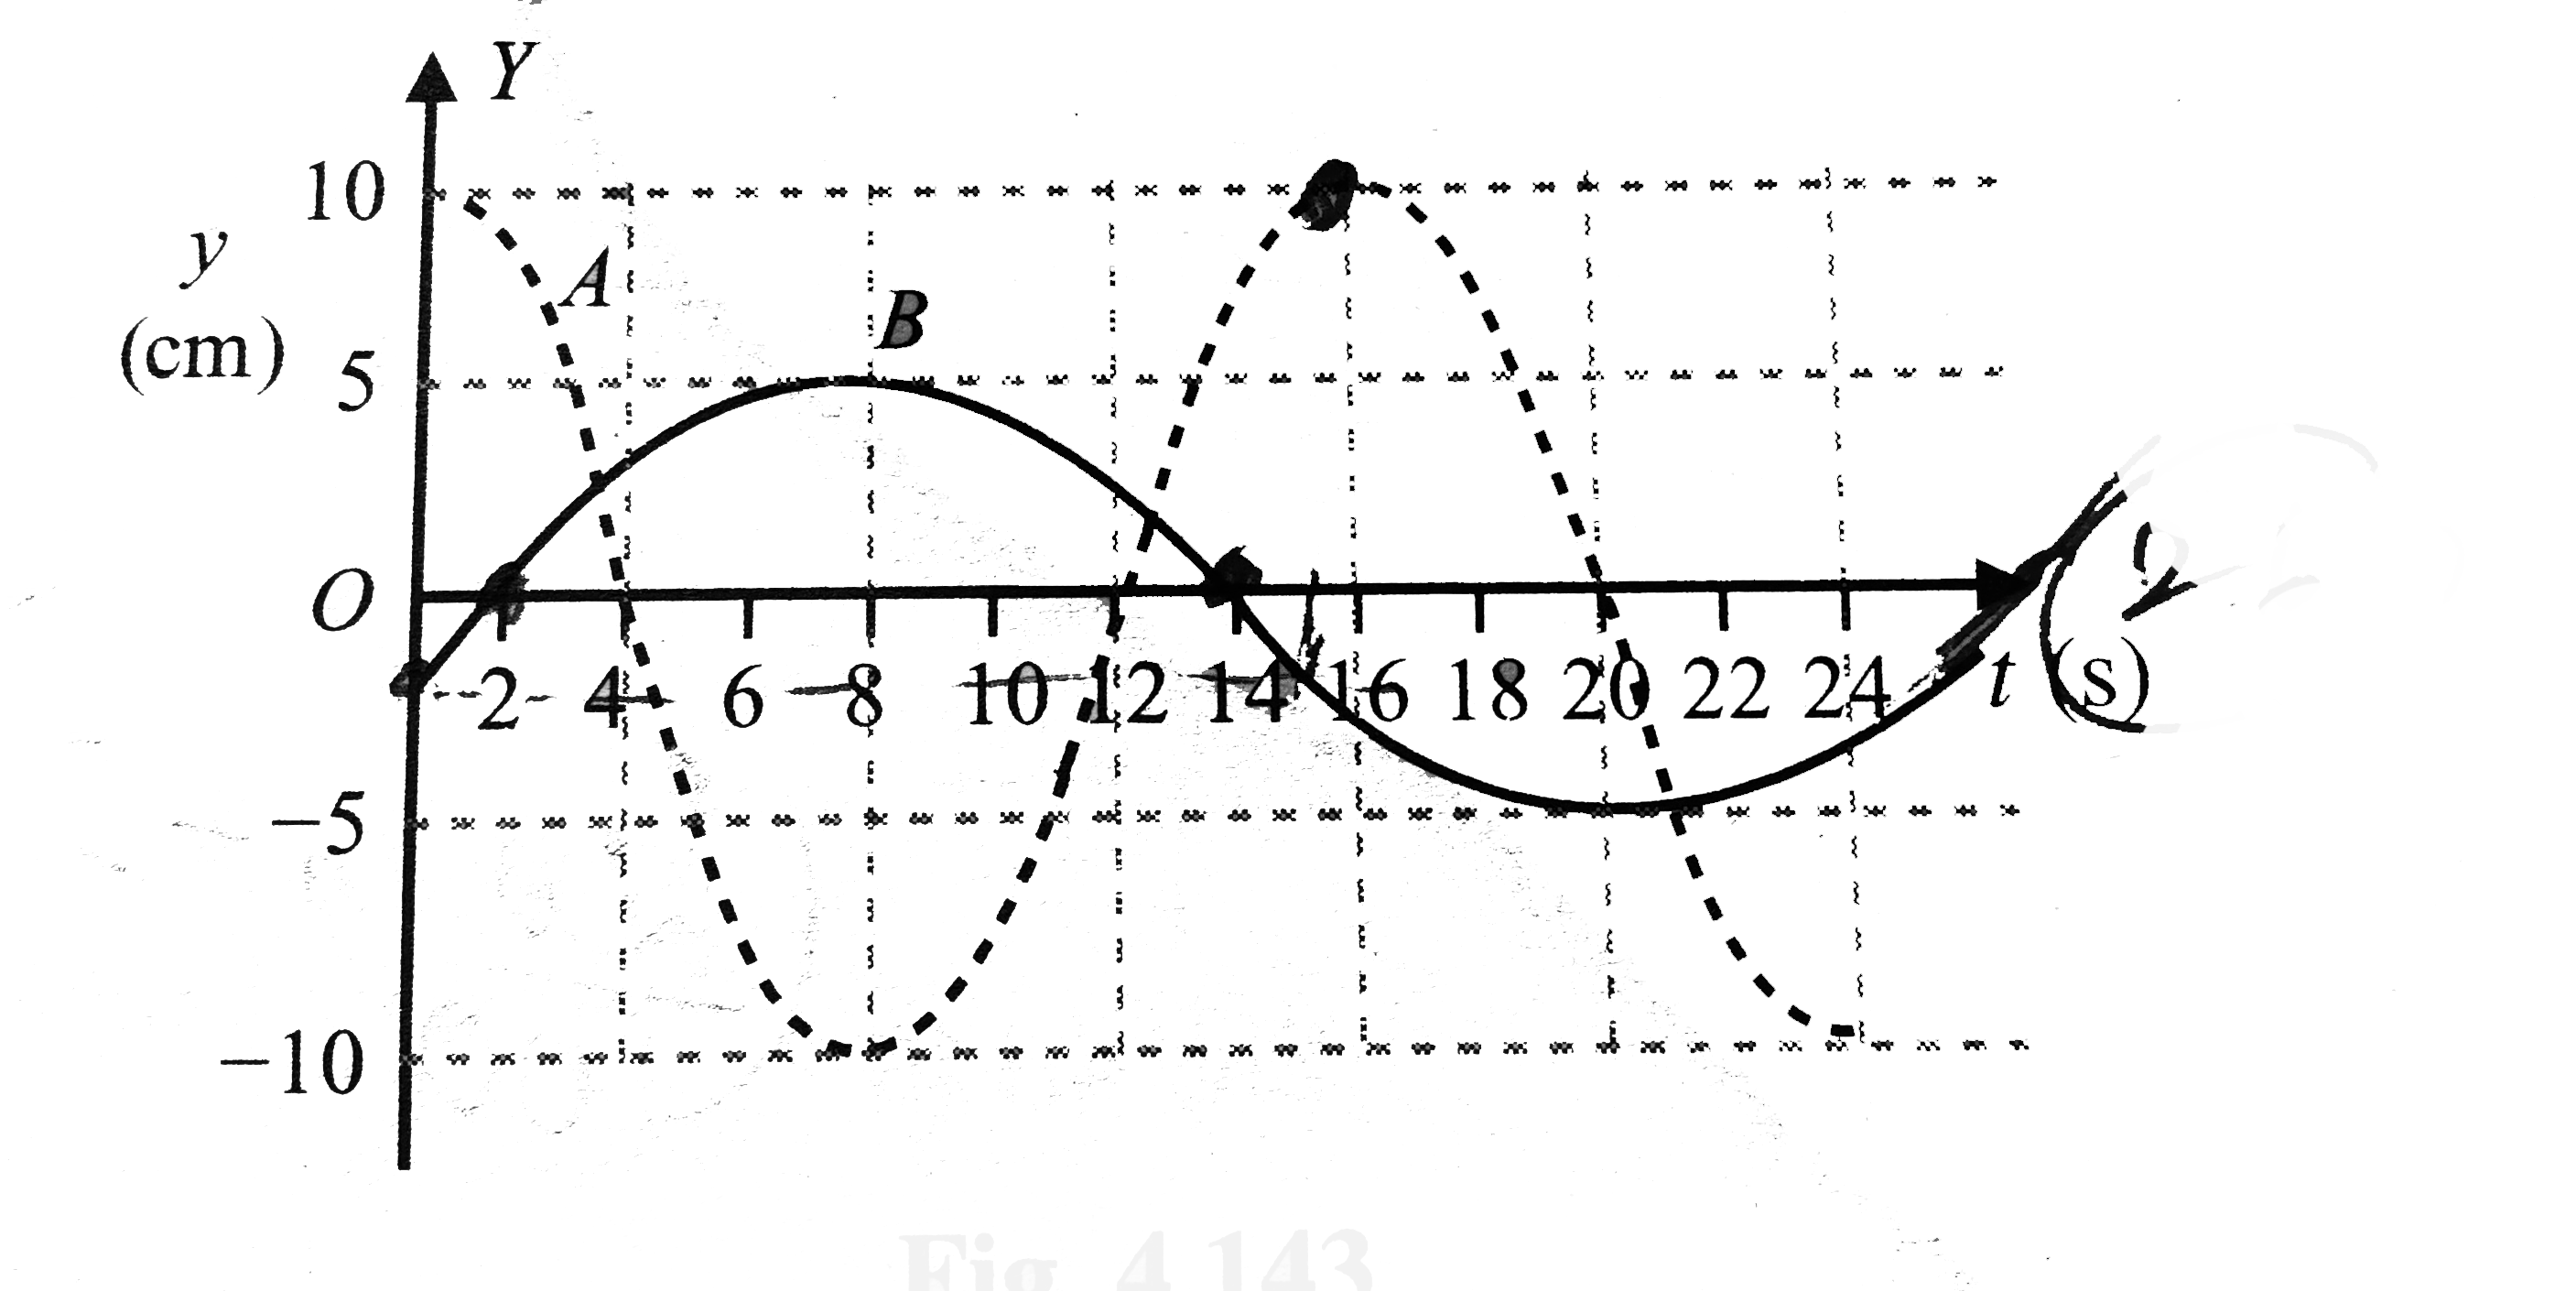
The following figure shows the displacement versus time graph for two particles A and B executing simple harmonic motions. The ratio of their maximum velocities isA3:1B1:3C1:9D9:1 - Question 3 - Select One
Figure shows position-time graph of two cars A and B.
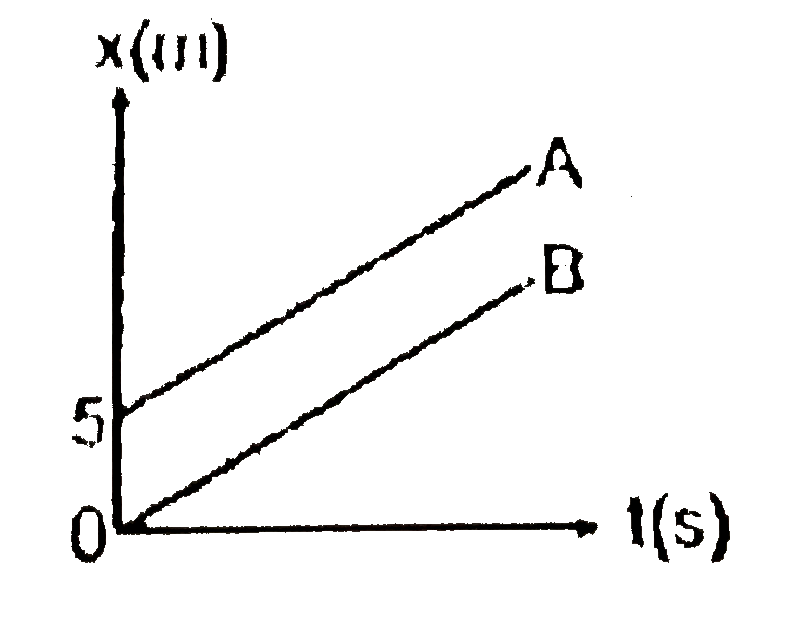 ACar A is faster than car B.BCar B is faster than car A.CBoth cars are moving with same velocity.DBoth cars have positive acceleration.
The displacement of a particle in simple harmonic motion in one time period is
View SolutionThe figure gives the displacement versus time graph of a simple harmonic oscillator. The position with maximum speed directed down wards is at
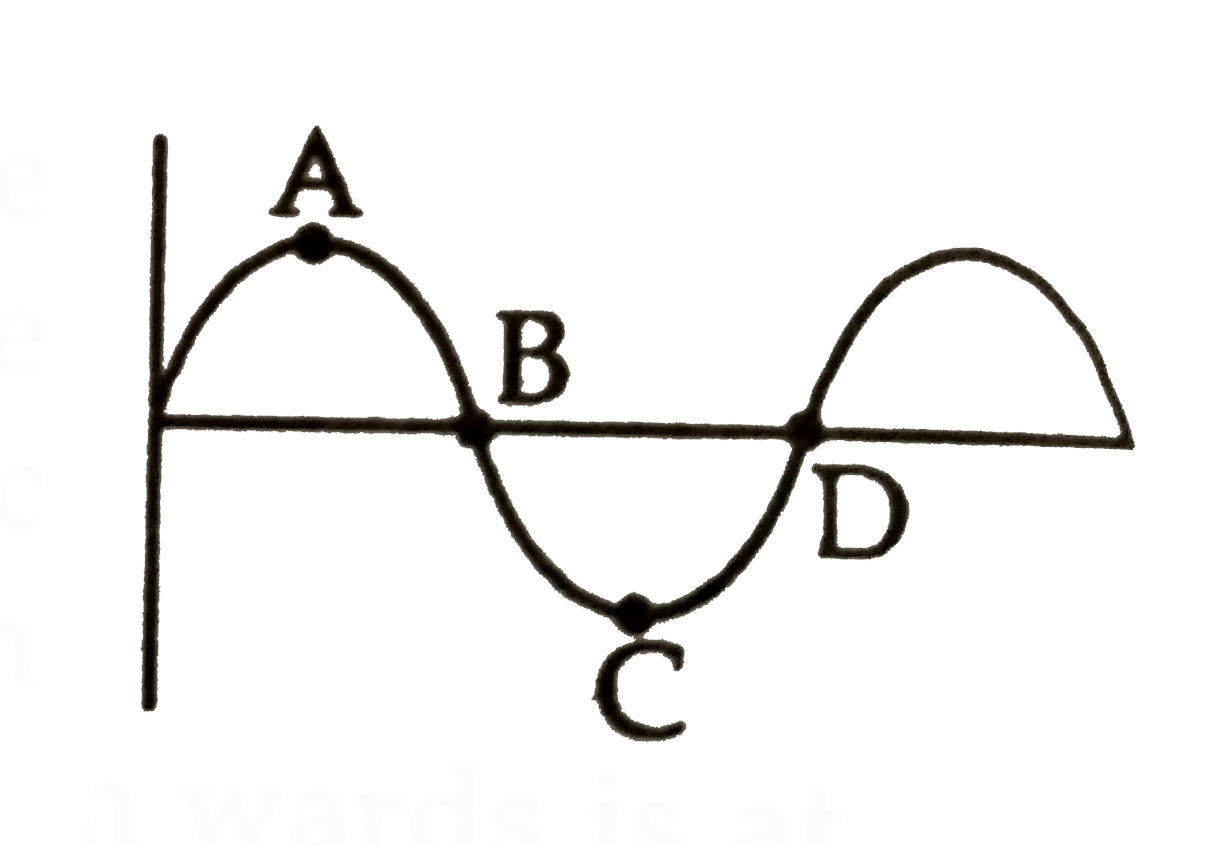 View Solution
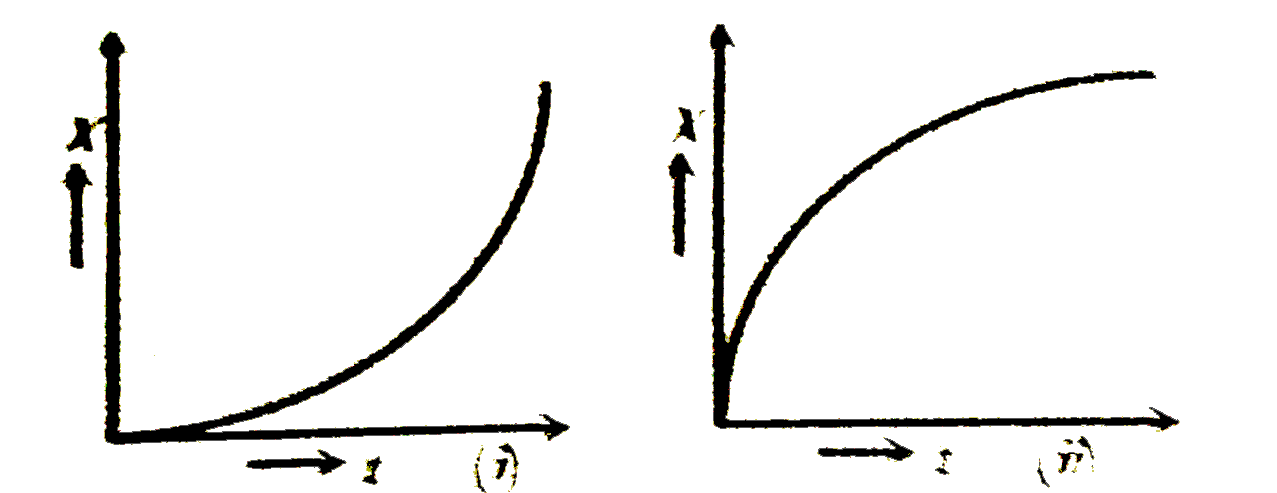
Figure (i) and (i) show the displacement-time graphs of two particles moving along the x-axis. We can say that
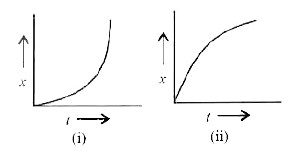 View Solution
Figure given shows the distance - time graph of the motion of a car. It follows from the graph that the car is
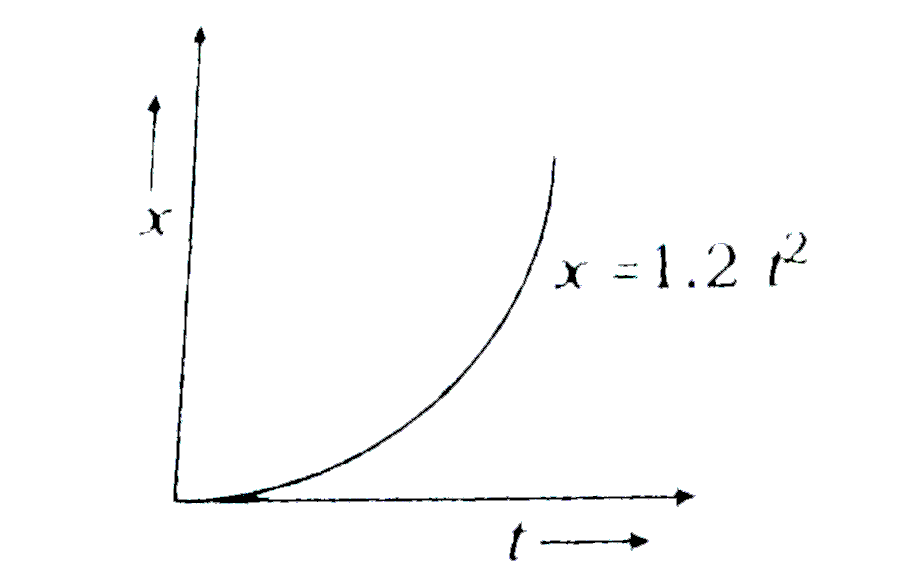 View Solution
Figures (i) and (ii) below show the displacement-time graphs of two particles moving along the x -axis. We can say that
 View Solution


