The table below shows the net asset value (NAV) per unit of mutual funds of some companies.Draw a histogram representing the information.

Step by step video & image solution for The table below shows the net asset value (NAV) per unit of mutual funds of some companies.Draw a histogram representing the information. by Maths experts to help you in doubts & scoring excellent marks in Class 10 exams.
Updated on:21/07/2023Topper's Solved these Questions
- STATISTICSBOOK - TARGET PUBLICATIONCHAPTER - STATISTICSEXERCISE - Apply your knowledge
5 Videos
- STATISTICSBOOK - TARGET PUBLICATIONCHAPTER - STATISTICSEXERCISE - Chapter Assessment
15 Videos
- STATISTICSBOOK - TARGET PUBLICATIONCHAPTER - STATISTICSEXERCISE - Multiple Choice Questions
14 Videos
- SIMILARITY BOOK - TARGET PUBLICATIONCHAPTER - SIMILARITY EXERCISE - Chapter Assessment
19 Videos
- TRIGONOMETRY BOOK - TARGET PUBLICATIONCHAPTER - TRIGONOMETRY EXERCISE - Chapter Assessment
18 Videos
Similar Questions
Knowledge Check
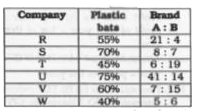
The table given below shows the information about bats manufactured by 6 different companies. Each company manufactures only plastic and wooden bats. Each company lables these bats as Brand A or Brand B. The table shows the number of plastic bats as percentage of total bats manufactured by each company. It also show the ratio of wooden bats labeled A and B. Each company manufactured a total of 550000 bats.

What is the total number of wooden bats of brand A manufactured by company T?A23420B22990C68920D72600
The following table shows the marks secored by a student in annual examination in various subjects. Draw a histogram to represent the given data.
SubjectTeluguHindiEnglishMathsScienceSocial StudiesMarks807482949088
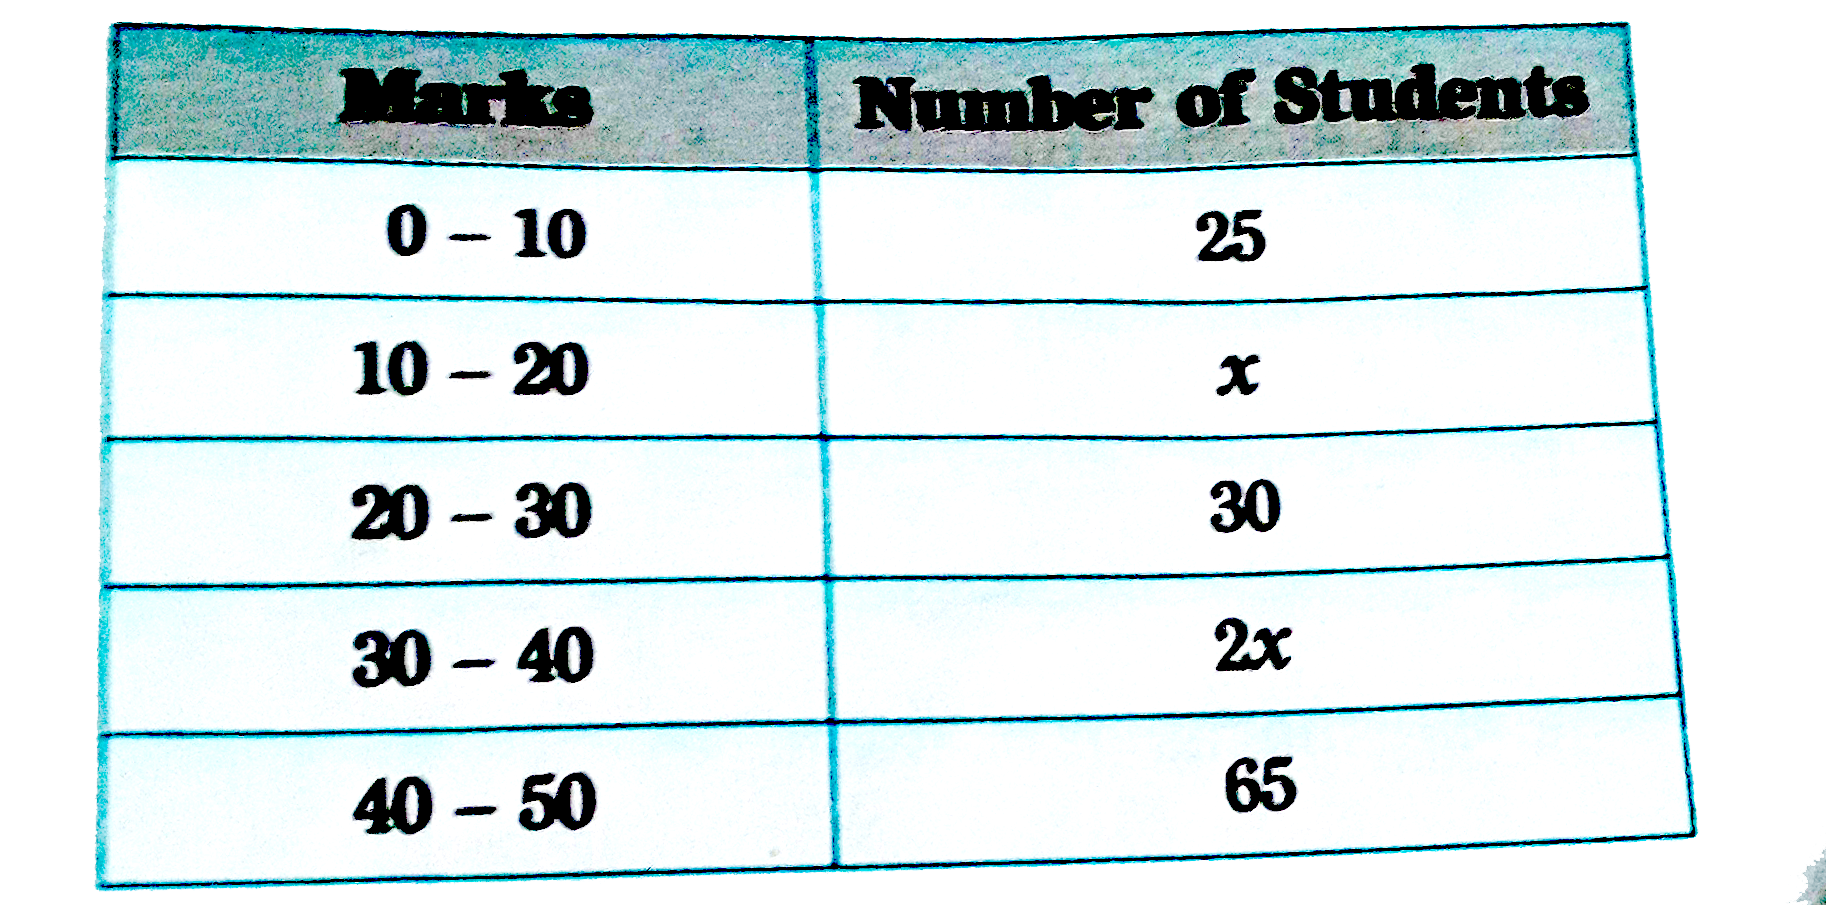
View SolutionThe following frequency distribution table shows marks obtained by 180 students in Mathematics examination :

Find the value of x.
Also draw a histogram representing the above informations.
View SolutionThe table below show the yield of jowar per acre. Show the data by histogram .

View SolutionThe table below shows number of students of students of a college corresponding to different range of marks in Statistics. Present the information in the form of a histogram.

View SolutionThe given table shows the number of tourists who visited Taj Mahal during different months. Month

Draw a bar graph to represent the above information by using appropriate scale.
View SolutionTime allotted for the preparation of an examination by some students is shown in the table. Draw a histogram to show the information.

View SolutionTime alloted for the preparation of an examination by some students is shown in the table. Draw a histogram to show the information.

View Solution

