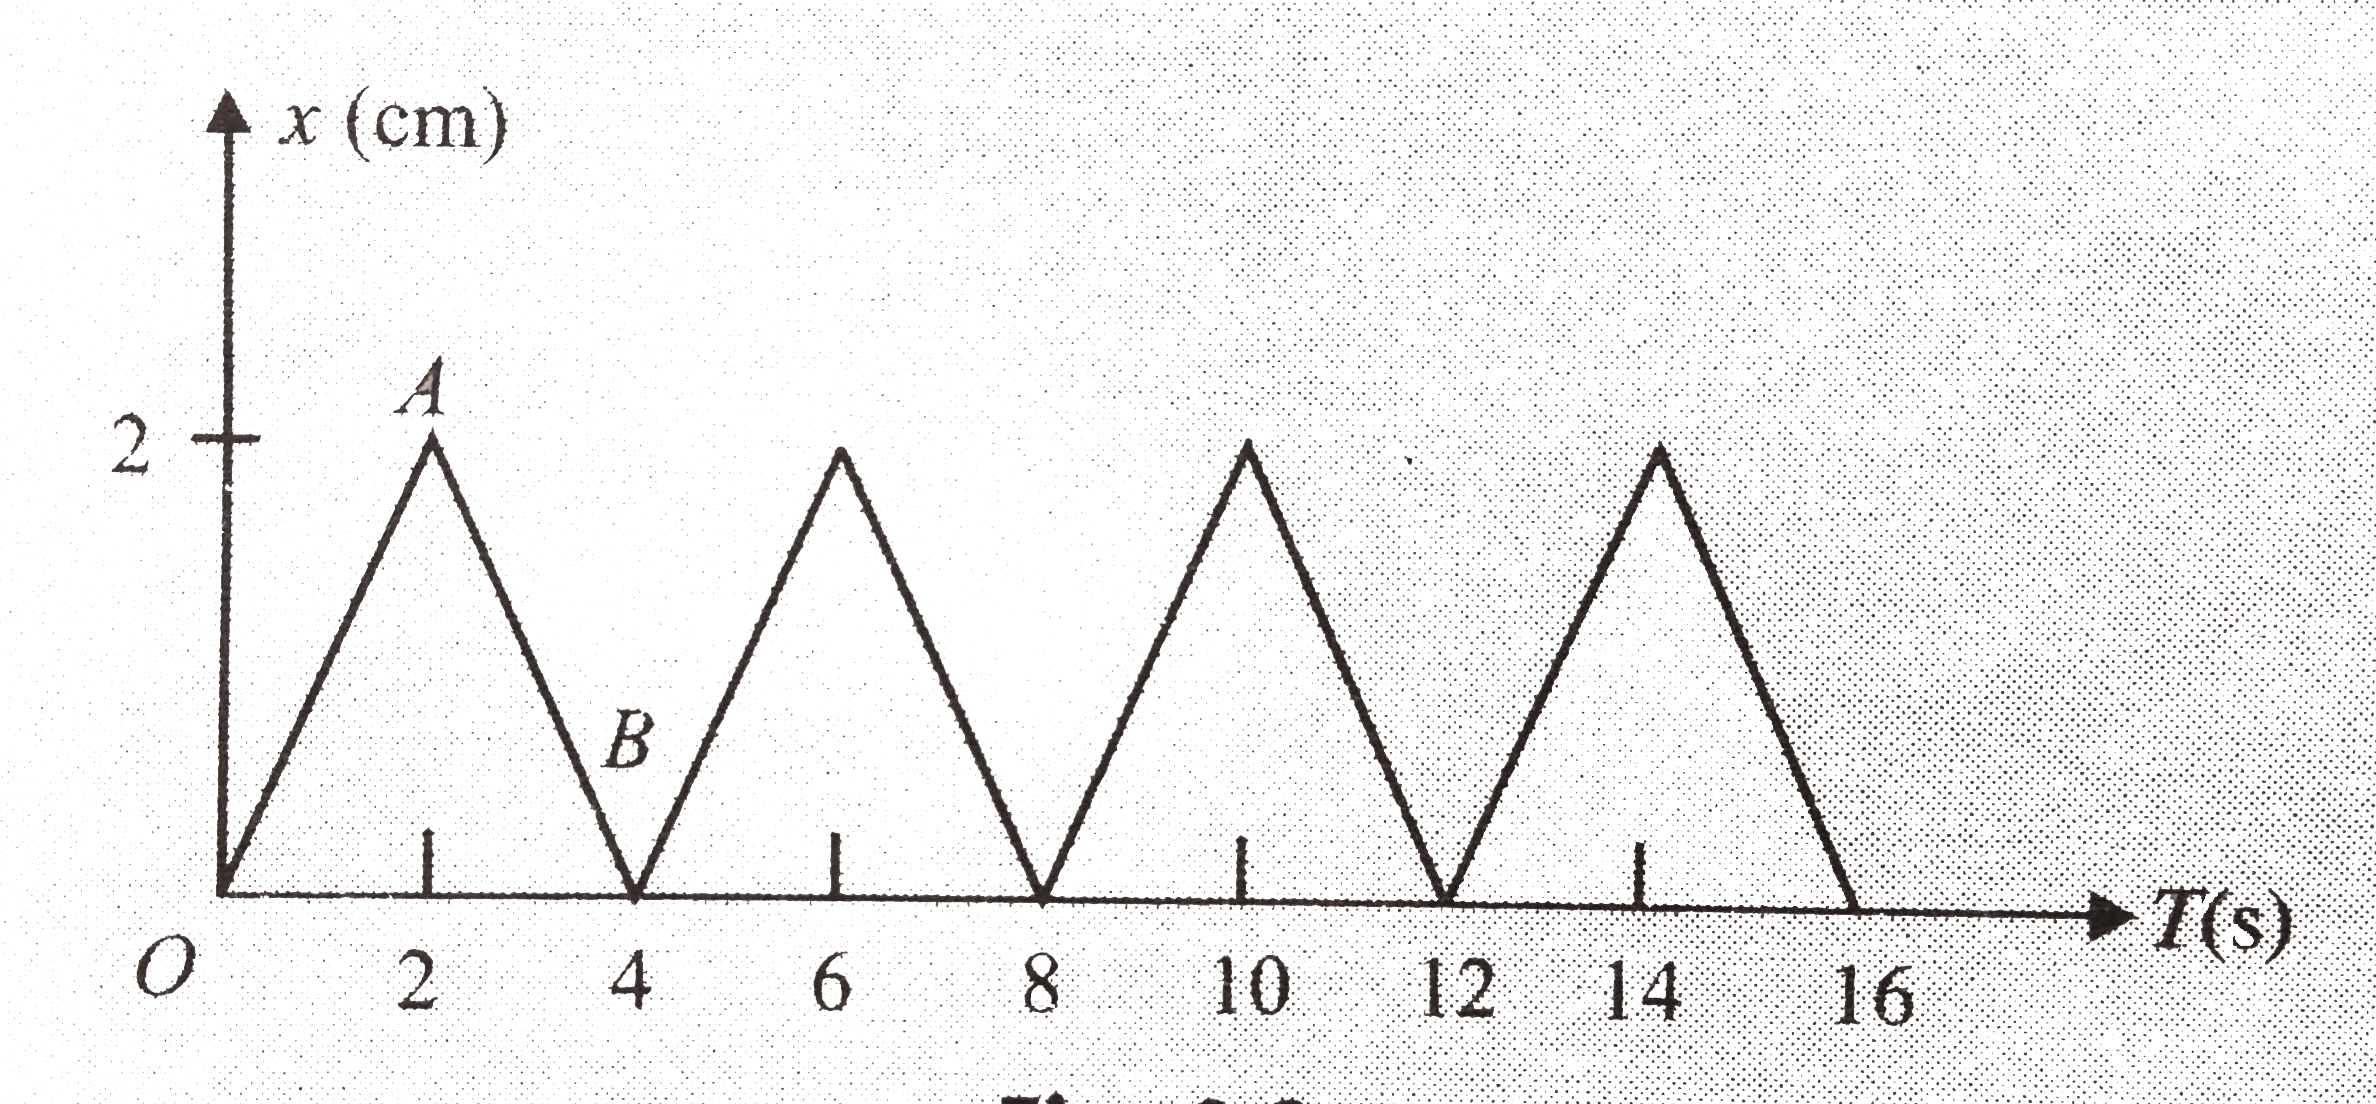
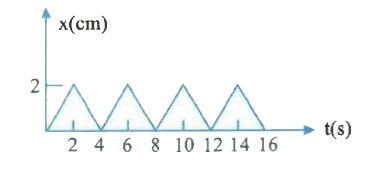
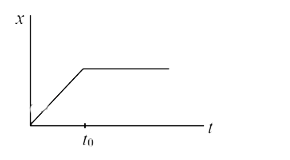
Figure shows the position-time graph of a particle of mass 0.04kg. Suggest a suitable physical context for this motion. What is the time between two consecutive impulses received by the particle? What is the magnitude of each impluse?
4sec,4×10−4kgm/s
2sec,8×10−4kgm/s
6sec,4×10−4kgm/s
8sec,8×10−4kgm/s
The correct Answer is:B
Area of F−t graph gives impulse
Topper's Solved these Questions
Similar Questions
Shows the position time graph of a particle of mass 0.04 kg Suggest a suitable physical context for this motion What is the time between two conscutive impulse recevived by the particle ? What is the magnitude of each impulse ?
View SolutionThe position-time graph of a particle of mass 0.1 kg is shown. The impulse at t = 2s is :
View Solution
Knowledge Check
The position-time graph of a body of mass 0.04kg is shown in the figure. The time between two consecutive impulses received by the body and the magnitude of each impulse is
 A4sec,4×10−4kgm/sB2sec,8×10−4kgm/sC6sec,4×10−4kgm/sD8sec,8×10−4kgm/s
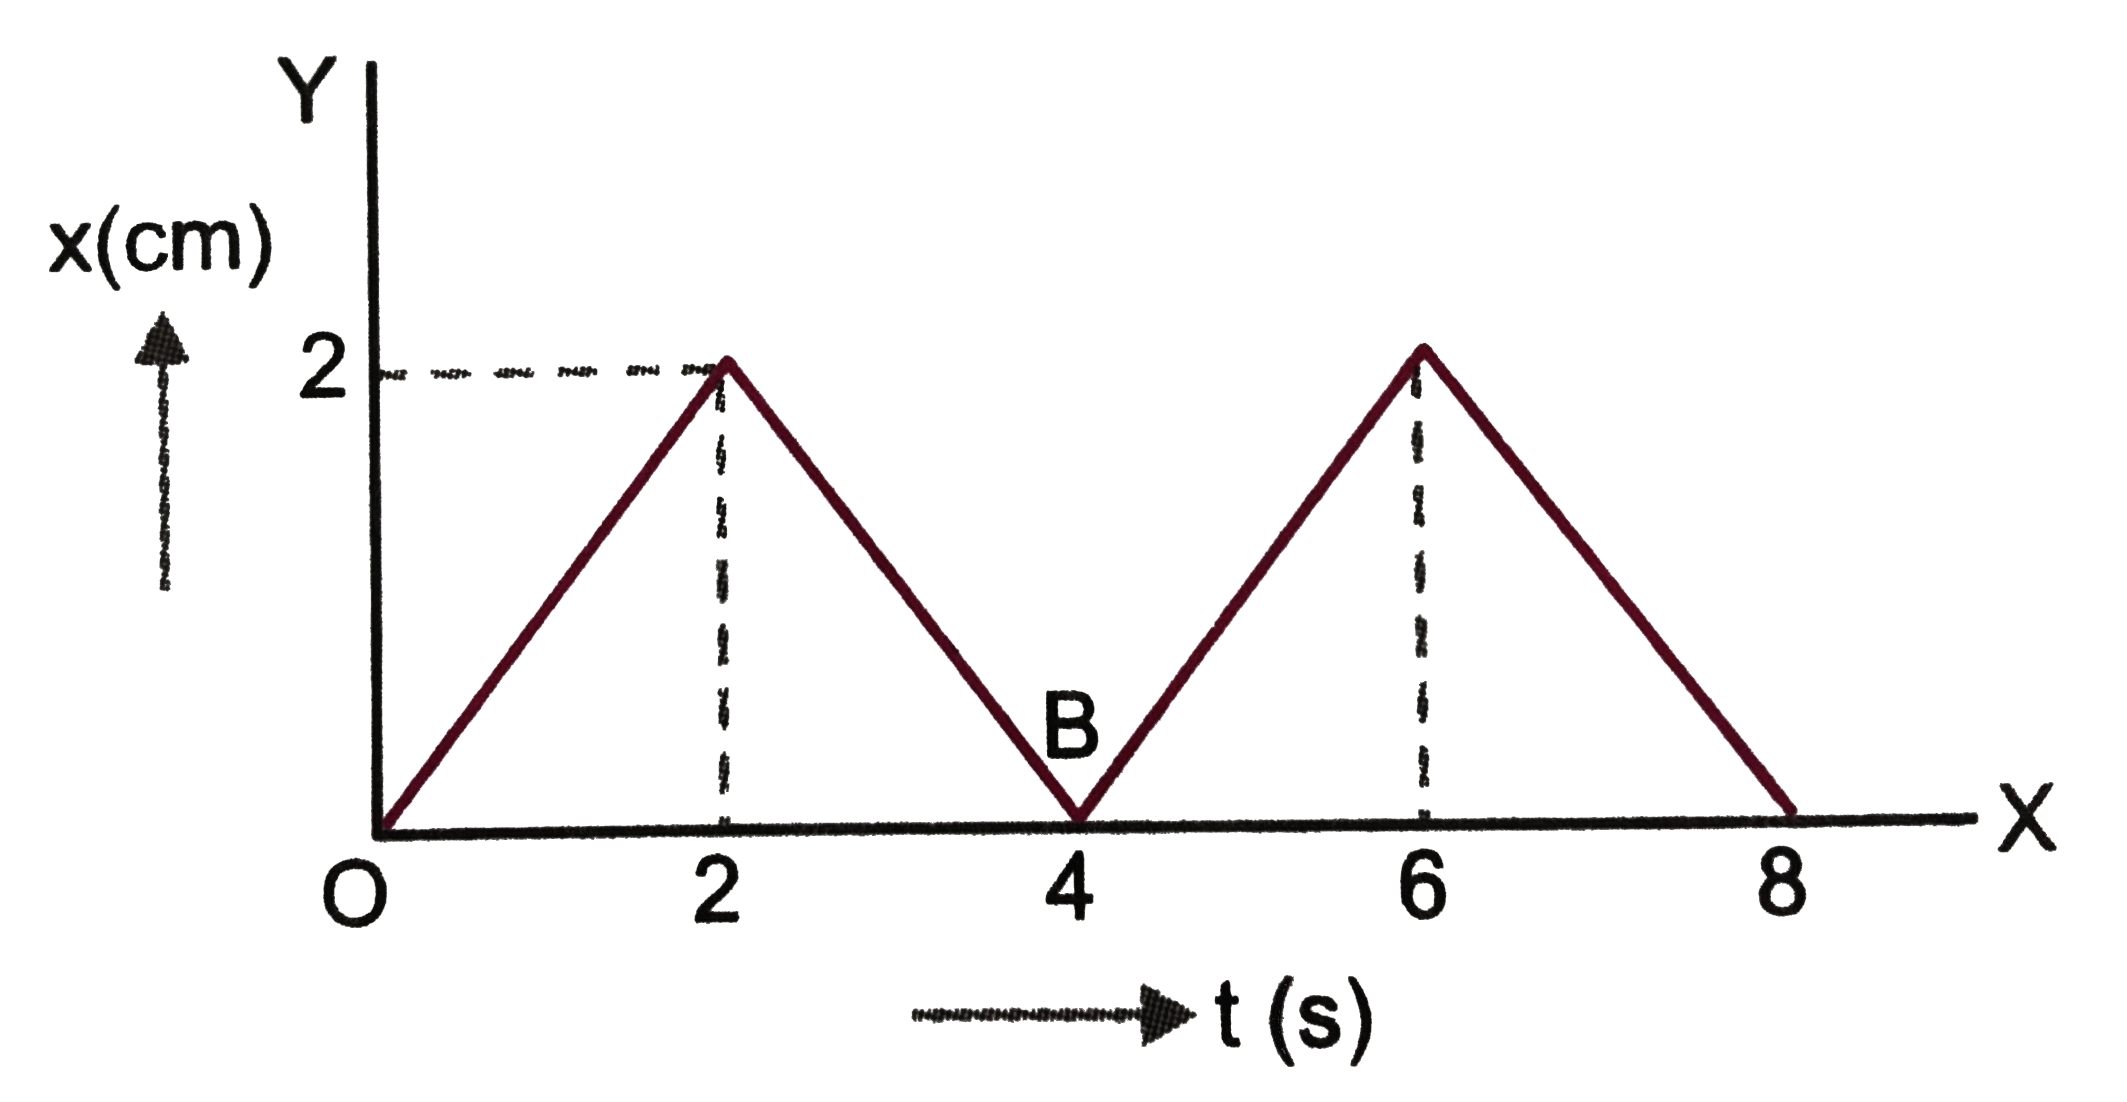
The position-time graph of a particle of mass 0.1 kg is shown. The impulse at t = 2s is :
 A0.2kgms−1B0.02kgms−1C0.1kgms−1D0.4kgms−1
In the figure given, the position-time graph of a particle of mass 0.1 kg is shown the impulse at t = 2s is
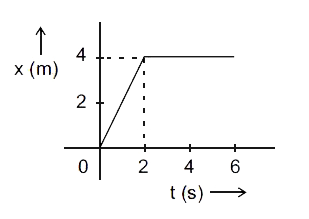 A0.2 kg m/sB−0.2 kg m/sC0.1 kg m/sD−0.4 kg m/s
In the figure, the position time graph of a particle of mass 0.1 kg is shown. The impulse at t=2 second is :
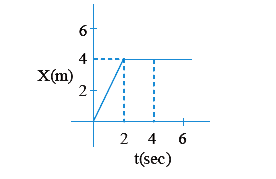
View SolutionIn the figure given below, the position-time graph of a particle of mass 0.1kg is shown. The impuslse at t=2 sec is
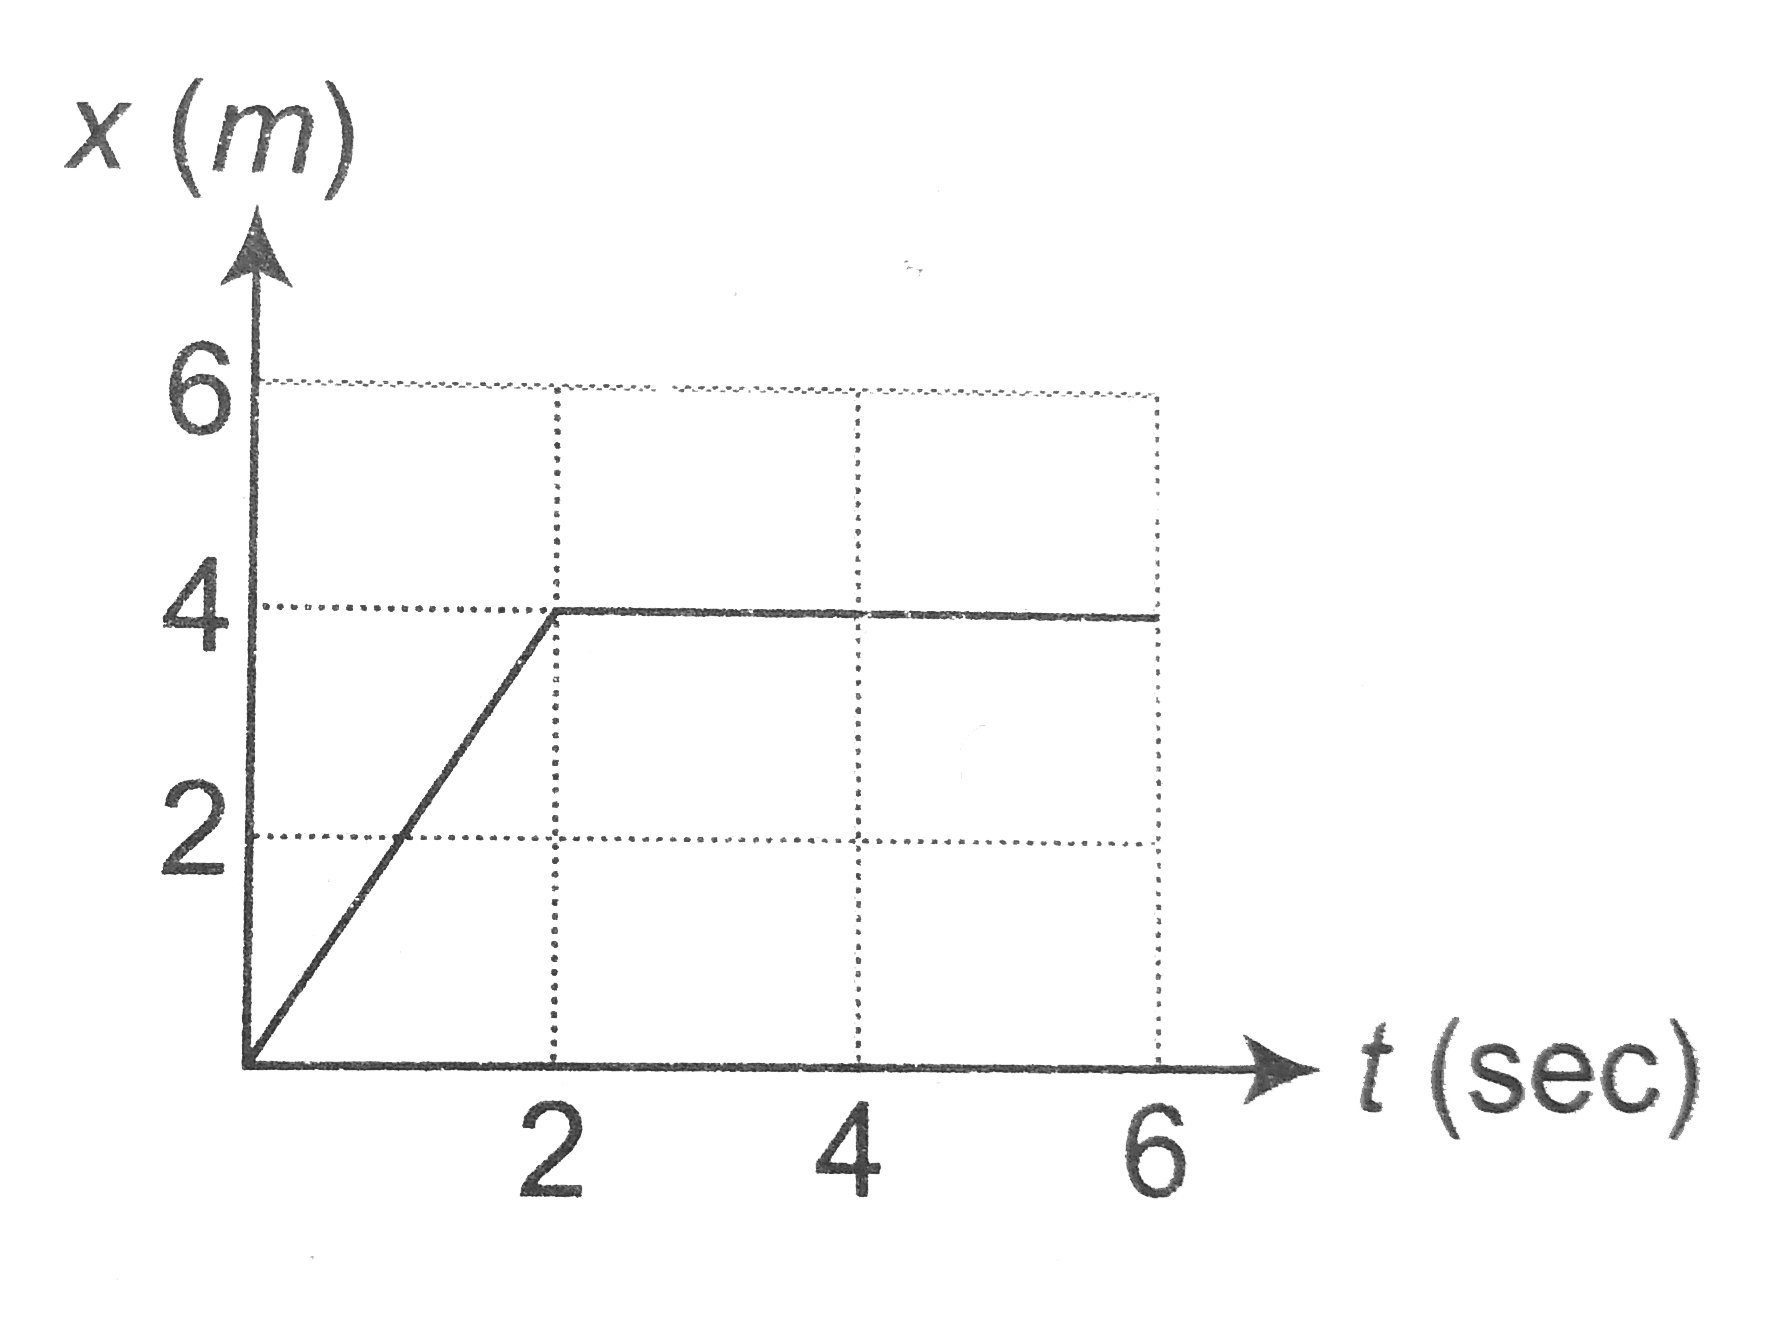
View SolutionIn the figure given below, the position time graph of a particle of mass 0.1kg is shown. The impulse at t=2 sec is
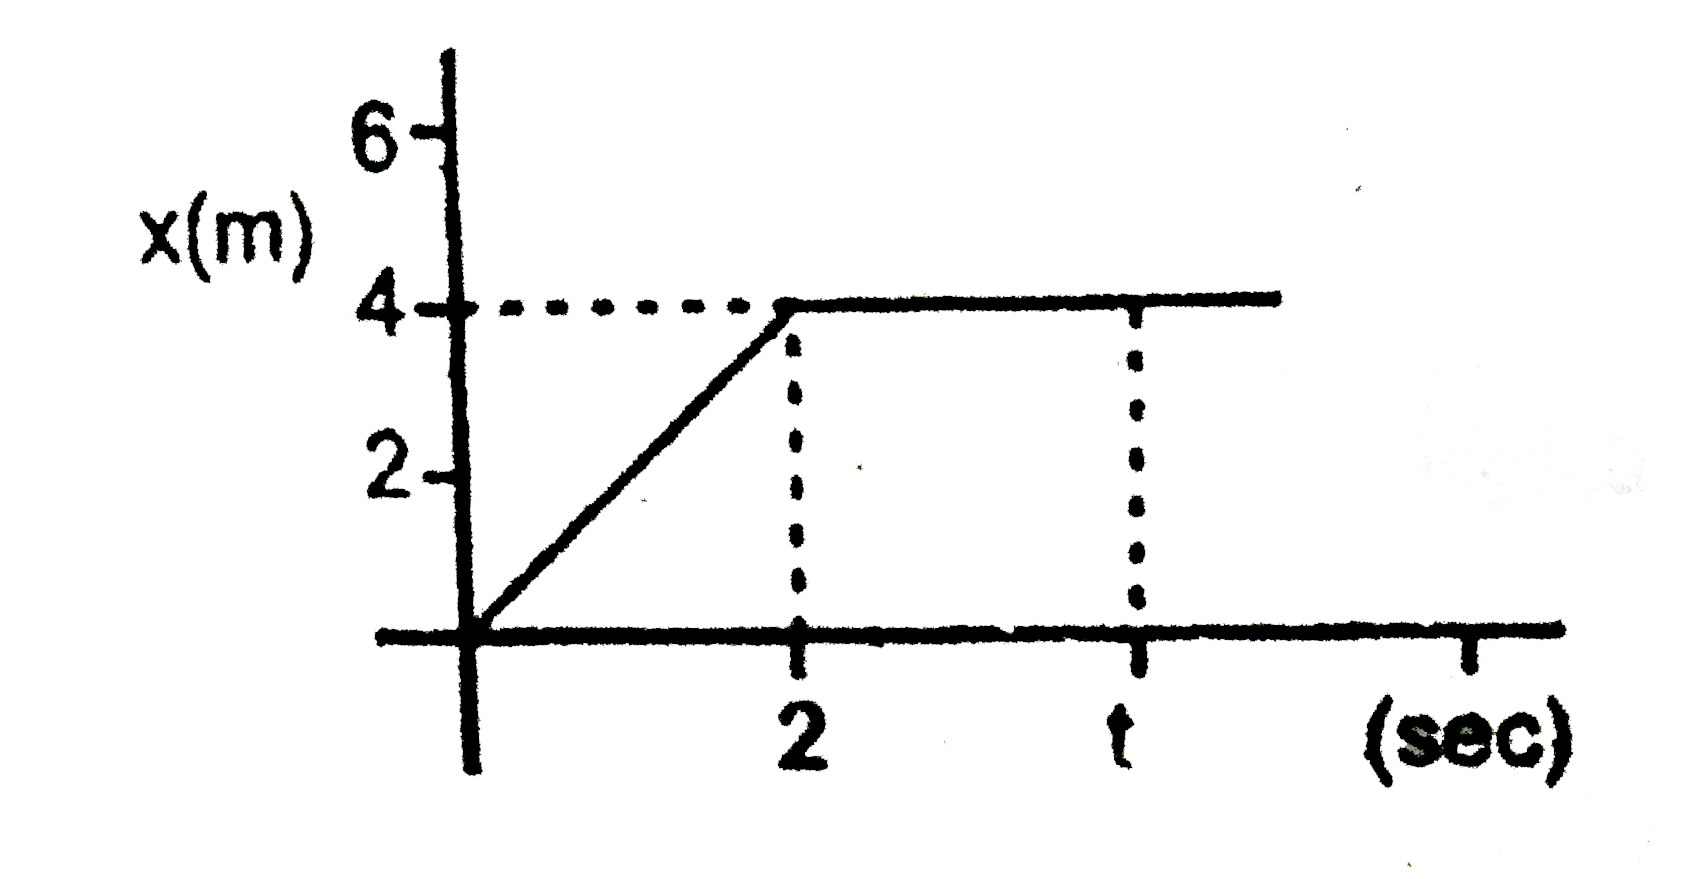
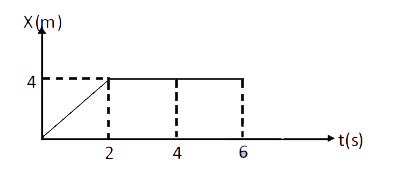
View SolutionFigure shows the position-time graph of a particle moving on the X--axis. Which of these option correctly describes the particle 's motion?
View SolutionFigure shows the position time graph of a particle of mass 5kg. The force acting on the particle for 0<t<4s and 8s<t<12s respectively are,

View Solution
