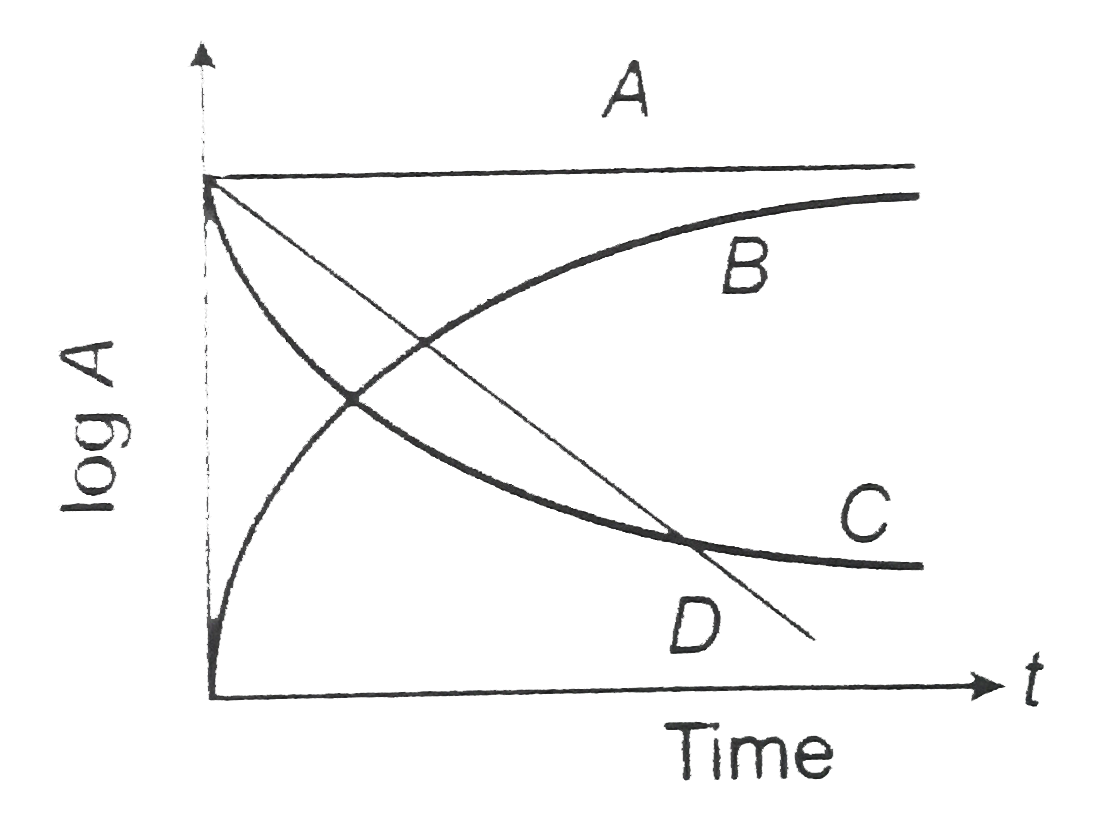
At time t=0, some radioactive gas is injected into a sealed vessel. At time T, some more of the same gas is injected into the same vessel. Which one of the following graphs best represents the variation of the logarithm of the activity A of the gas with time t?
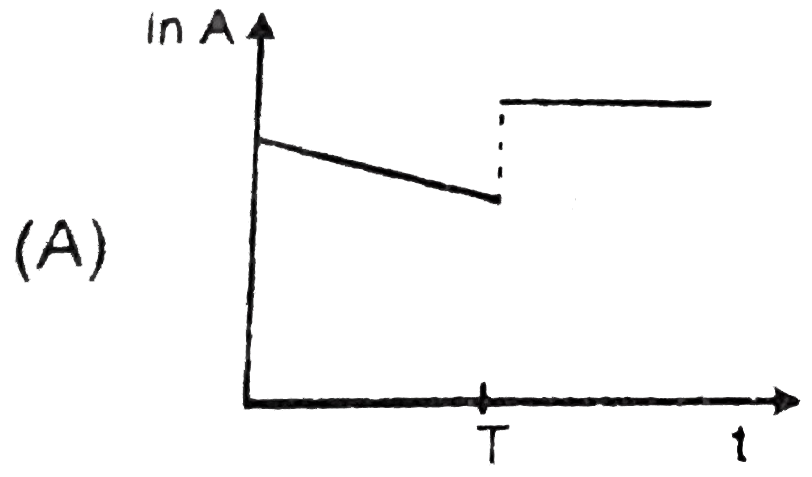
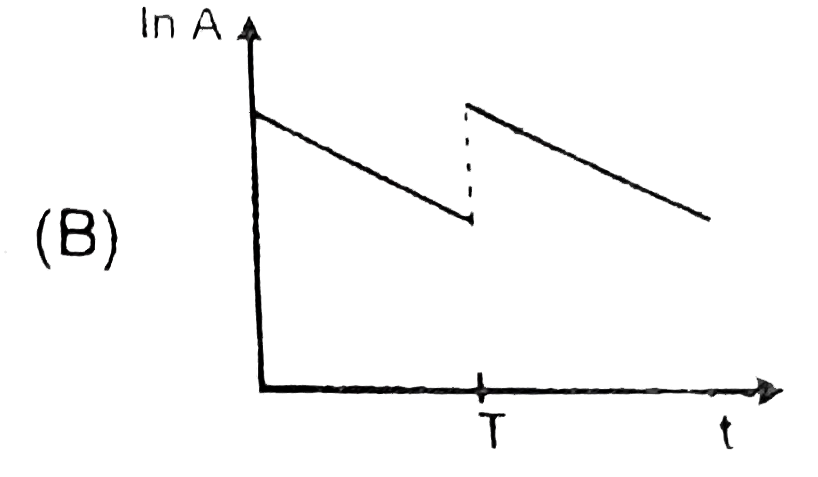
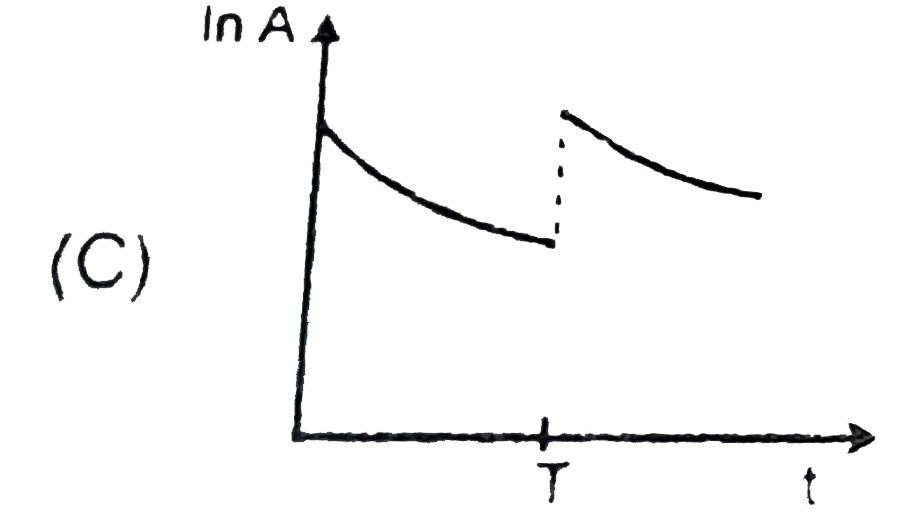
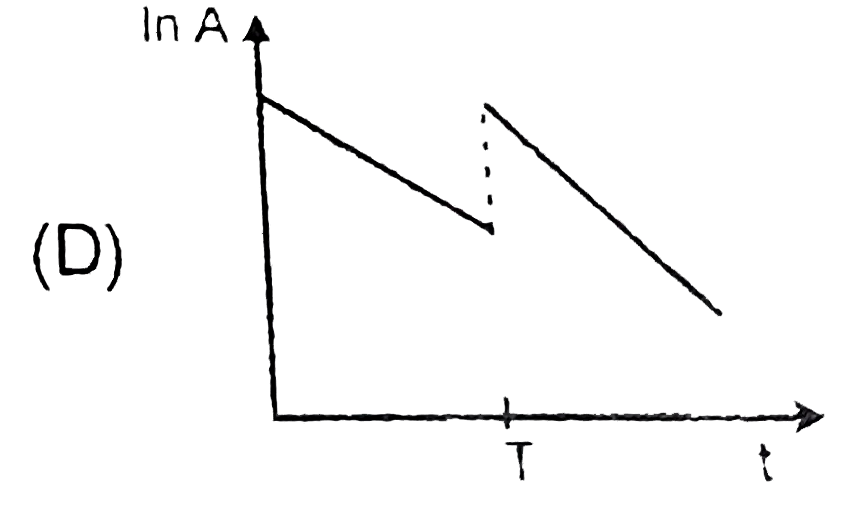
The correct Answer is:B
A−A01e−λt
lnA−lnA0−λt
ln A versus t is a linearly decreasing graph with slope depending to λ As λ does not change, slope is charge remains same.
Topper's Solved these Questions
- BOOK - RESONANCECHAPTER - DAILY PRACTICE PROBLEMEXERCISE - DPP No.329videos
DAILY PRACTICE PROBLEM
- BOOK - RESONANCECHAPTER - DAILY PRACTICE PROBLEMEXERCISE - DPP No.3320videos
DAILY PRACTICE PROBLEM
- BOOK - RESONANCECHAPTER - DAILY PRACTICE PROBLEMEXERCISE - DPP No.309videos
DAILY PRACTICE PROBLEM
- BOOK - RESONANCECHAPTER - CURRENT ELECTRICITYEXERCISE - High Level Problems (HIP)21videos
CURRENT ELECTRICITY
- BOOK - RESONANCECHAPTER - ELECTRO MAGNETIC WAVESEXERCISE - Exercise 327videos
ELECTRO MAGNETIC WAVES
Similar Questions
A body is acted upon by a constant force fromtime t=0 to a time t=T after which it does not experience any force. Which of the following graphs best represents the variation of the velocity of the body with time ?
View SolutionThe graph which represents the correct variation of logarithm of activity (log A) versus time, in figure is.
 .View Solution
Knowledge Check
- Question 1 - Select One
At time t=0, some radioactive gas is injected into a sealed vessel. At time T, some more of the same gas is injected into the same vessel. Which one of the following graphs best represents the variation of the logarithm of the activity A of the gas with time t?
A B
B C
C D
D
- Question 2 - Select One
Which of the following graphs represents the variation of activity (A) of a radioactive substance with time (t).
A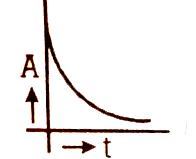 B
B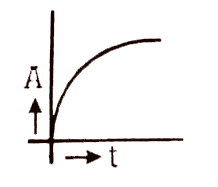 C
C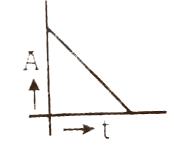 D
D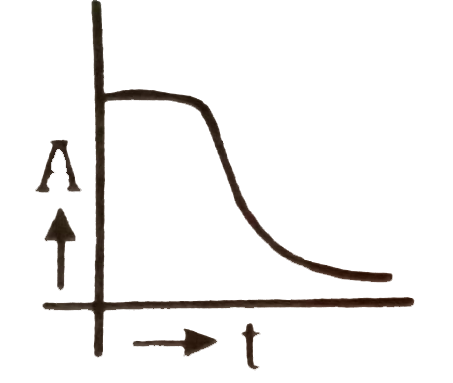
- Question 3 - Select One
The graph shown the variation with times t of the velocity v of an object . Which one of the following graphs best represents the variation of acceleration a of the object with time t?
 A
A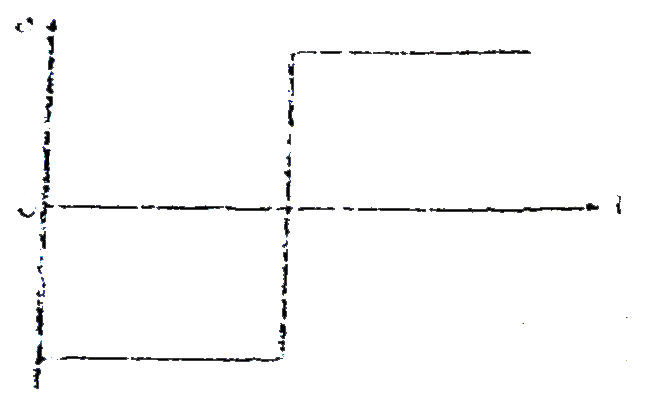 B
B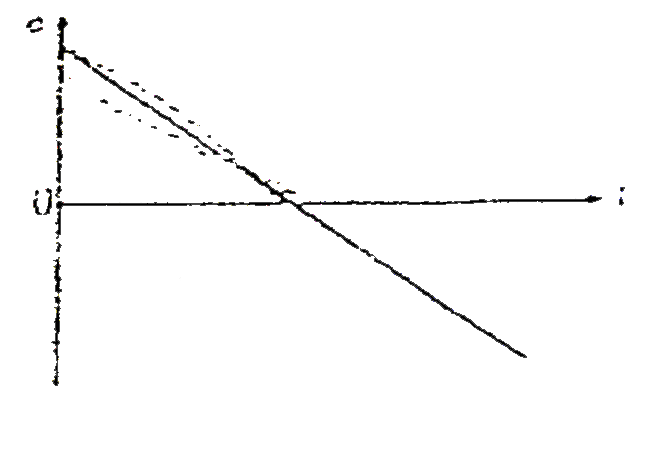 C
C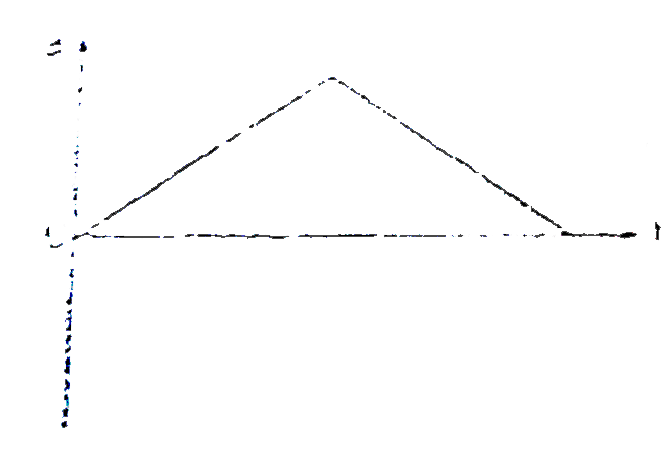 D
D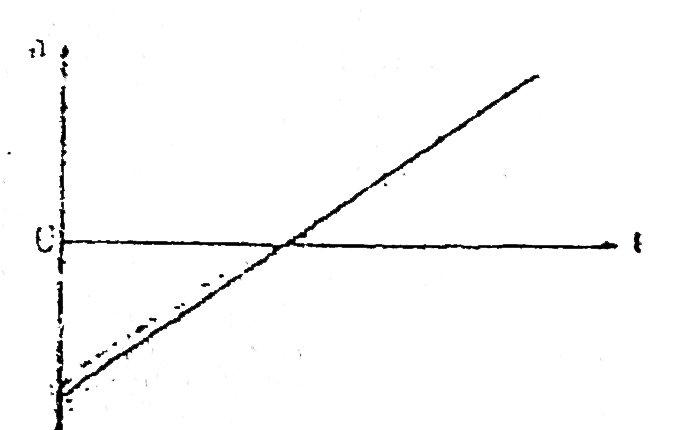
Which of the following x-t graphs represents the distance-time variation of a body released from the top of a buiding?
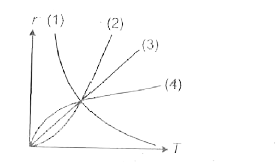
View SolutionWhich graph best represents the variation of radius r of a circular orbit of a satellite against its time priod T ?
 View Solution
At a constant pressure, of the following graphs that one which represents the variation of the density of an ideal gas with the absolute temperature T, is
View SolutionThe rate of decay (R) of nuclei in a radioactive sample is plotted against time (t). Which of the following best represents the resulting curve ?
View SolutionThe rate of decay (R) of nuclei in a radioactive sample is plotted against time (t). Which of the following best represents the resulting curve ?
View Solution

