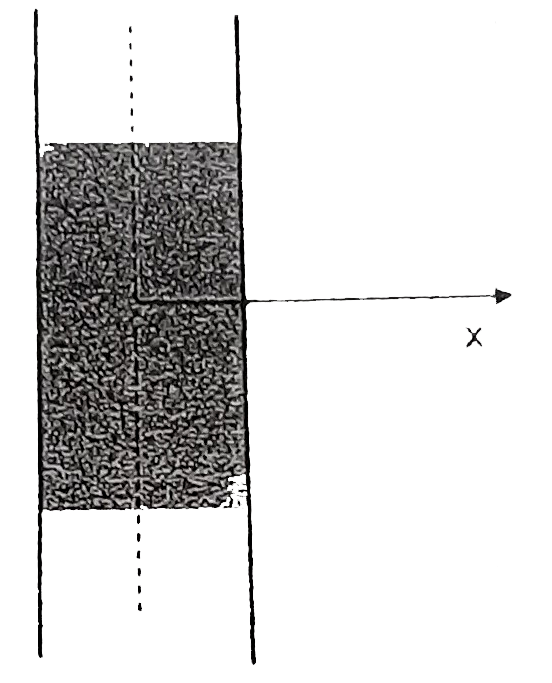
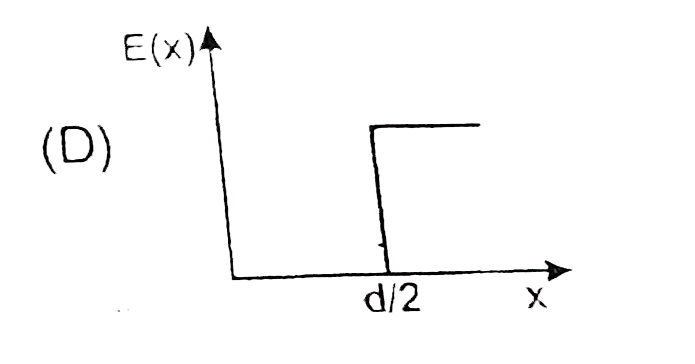
An infinite non-conducting plate of charge has thickness d and contains uniform charge distribution fo charge density, which one of the following graphs represents the variation of electric field E(x) with x. (here x is the distance from central plane of non-conducting plate)
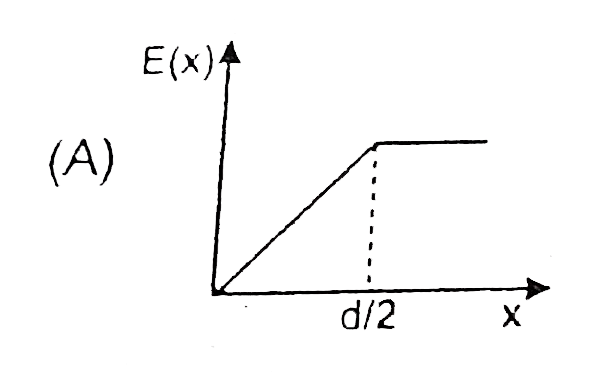
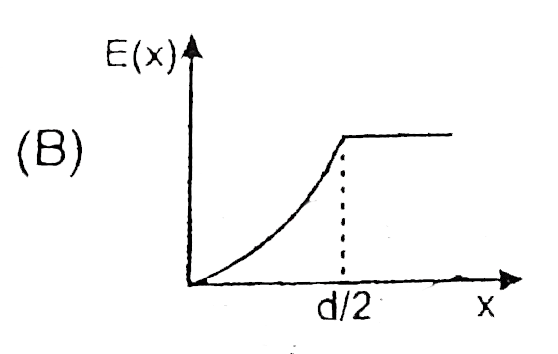
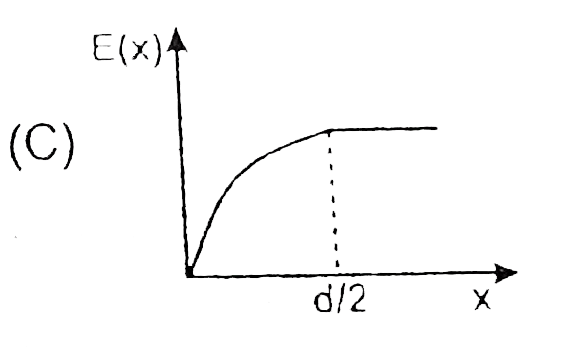
Step by step video & image solution for An infinite non-conducting plate of charge has thickness d and contains uniform charge distribution fo charge density, which one of the following graphs represents the variation of electric field E(x) with x. (here x is the distance from central plane of non-conducting plate) by Physics experts to help you in doubts & scoring excellent marks in Class 12 exams.
Updated on:21/07/2023Topper's Solved these Questions
- TEST PAPERSBOOK - RESONANCECHAPTER - TEST PAPERSEXERCISE - PT-01
30 Videos
- TEST PAPERSBOOK - RESONANCECHAPTER - TEST PAPERSEXERCISE - Pt-02
30 Videos
- TEST PAPERSBOOK - RESONANCECHAPTER - TEST PAPERSEXERCISE - PART - II PHYSICS
107 Videos
- SIMPLE HARMONIC MOTION BOOK - RESONANCECHAPTER - SIMPLE HARMONIC MOTION EXERCISE - Advanced Level Problems
13 Videos
- TEST SERIESBOOK - RESONANCECHAPTER - TEST SERIESEXERCISE - PHYSICS
127 Videos
Similar Questions
Which one of the following graphs represents the variation of electric field with distance r from the centre of a charged spherical conductor of radius R?
View SolutionA nonconducting sheet of large surface area and thickness d contains uniform charge distribution of density ρ. Find the electric field at a point P inside the plate, at a distance x from the central plane. Draw a qualitative graph of E against x for 0<x<<d.
View Solution
Knowledge Check
An isolated non-conducting solid sphere of radius R is given an electric charge. The charge is uniformly distributed in the volume of sphere. The graph which shows the correct variation of magnitude of electric field with distance from the centre of the sphere is
A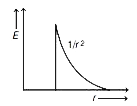 B
B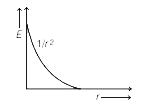 C
C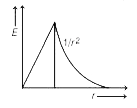 D
D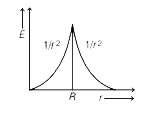
Consider a uniform spherical volume charge distribution of radius R. Which of the following graphs correctly represents the magnitude of the electric field E as a distance r from the center of the sphere ?
A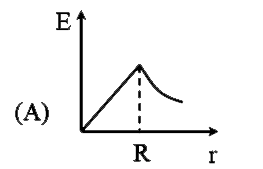 B
B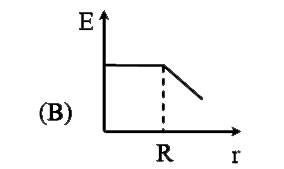 C
C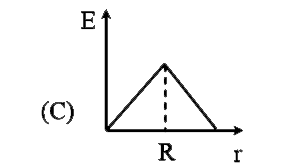 D
D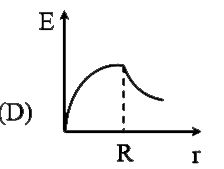
For a uniformly charged non conducting sphere of radius R which of following shows a correct graph between the electric field intensity and the distance from the centre of sphere –
A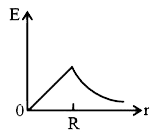 B
B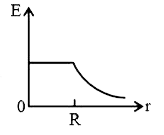 C
C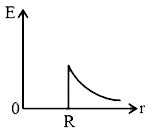 D
D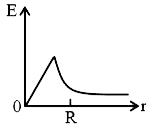
If x is measured from the centre of uniformly charged non-conducting sphere and a is radius of sphere the graph which best represents the variation of electric field (E) with x is E o a E
View SolutionA nonconducting sheet of large surface area and thickness d contains uniform charge distribution of density ρ. Find the electric field at a point P inside the plate, at a distance x from the central plane. Draw a qualitative graph of E against x for 0<x<<d.
View SolutionA hollow charged sphere of radius R has a constant surface charge density o. Of the following graphs the one, which shows the variation of the electric field strength E with distance X from the centre of the sphere is (A) E I=R x (B) E 1
View SolutionAn isolated non-conducting solid sphere of radius R is given an electric charge. The charge is uniformly distributed in the volume of sphere. The graph which shows the correct variation of magnitude of electric field with distance from the centre of the sphere is
View SolutionAn infinitely large non-conducting sheet of thickness t and uniform volume charge density ρ is given in which left half og the sheet contains charge density ρ and right half contains charge density. Find the electric field at the symmetry plane of this sheet
View Solution
