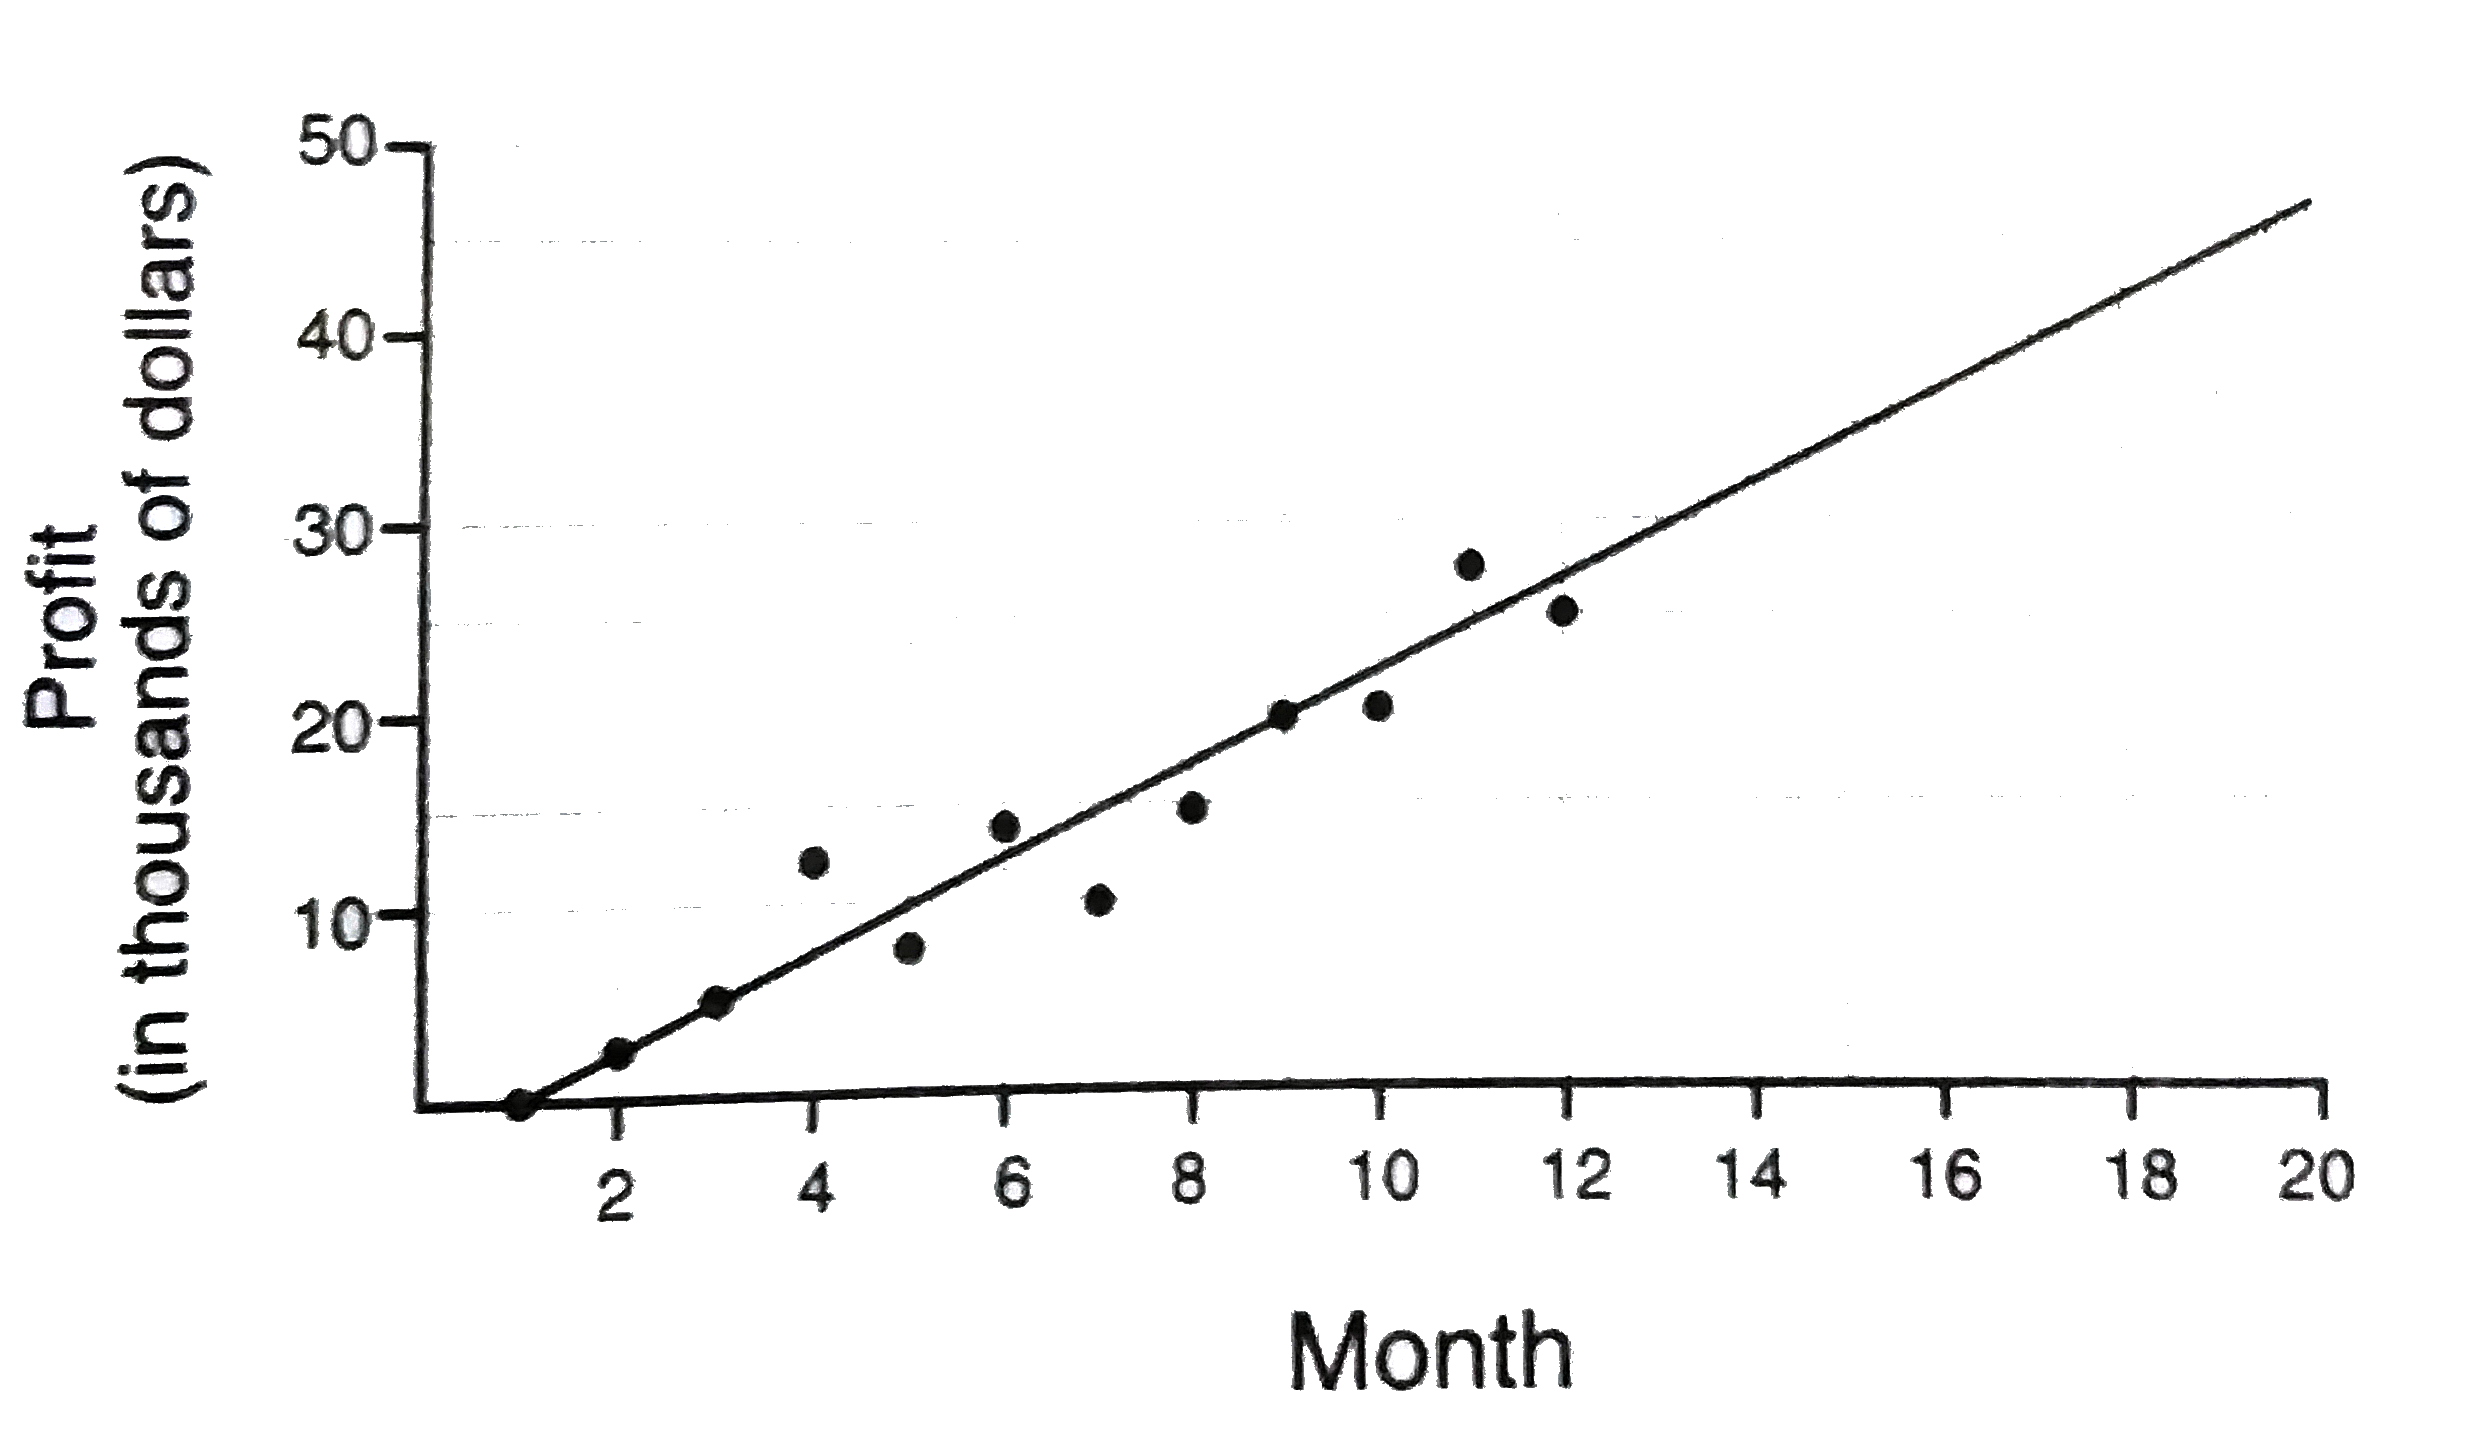
The scatterplot above shows the profit, by month, for a new company for the first year of operation. A line of best fit is also shown. Using this line, by what dollar amount did the profit in the 8th month exceed the profit in the 13th month?
$5,000
$7,750
$12,500
$15,000
The correct Answer is:C
Step by step video, text & image solution for The scatterplot above shows the profit, by month, for a new company for the first year of operation. A line of best fit is also shown. Using this line, by what dollar amount did the profit in the 8th month exceed the profit in the 13th month? by Maths experts to help you in doubts & scoring excellent marks in Class 12 exams.
Topper's Solved these Questions
- BOOK - ENGLISH SATCHAPTER - PROBLEM SOLVING AND DATA ANALYSISEXERCISE - Grib-In40videos
PROBLEM SOLVING AND DATA ANALYSIS
- BOOK - ENGLISH SATCHAPTER - PROBLEM SOLVING AND DATA ANALYSISEXERCISE - Grib-In40videos
PROBLEM SOLVING AND DATA ANALYSIS
- BOOK - ENGLISH SATCHAPTER - PROBLEM SOLVING AND DATA ANALYSISEXERCISE - EXERICSE80videos
PROBLEM SOLVING AND DATA ANALYSIS
- BOOK - ENGLISH SATCHAPTER - PROBLEMS IN CONTEXT EXERCISE - PRACTICE TEST10videos
PROBLEMS IN CONTEXT
Similar Questions
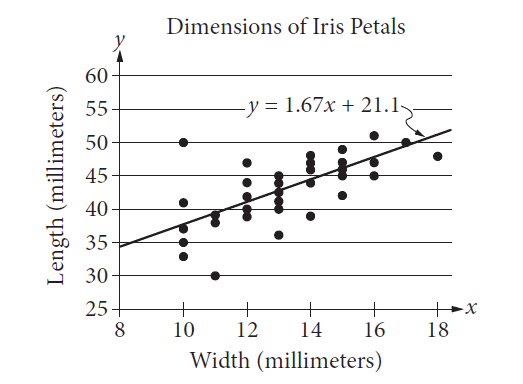
The scatterplot above shows data collected on the lengths and widths of Iris setosa petals. A line of best fit for the data is also shown. Based on the line of best fit, if the width of an Iris setosa petal is 19 millimeters, what is the predicted length, in millimeters, of the petal?View Solution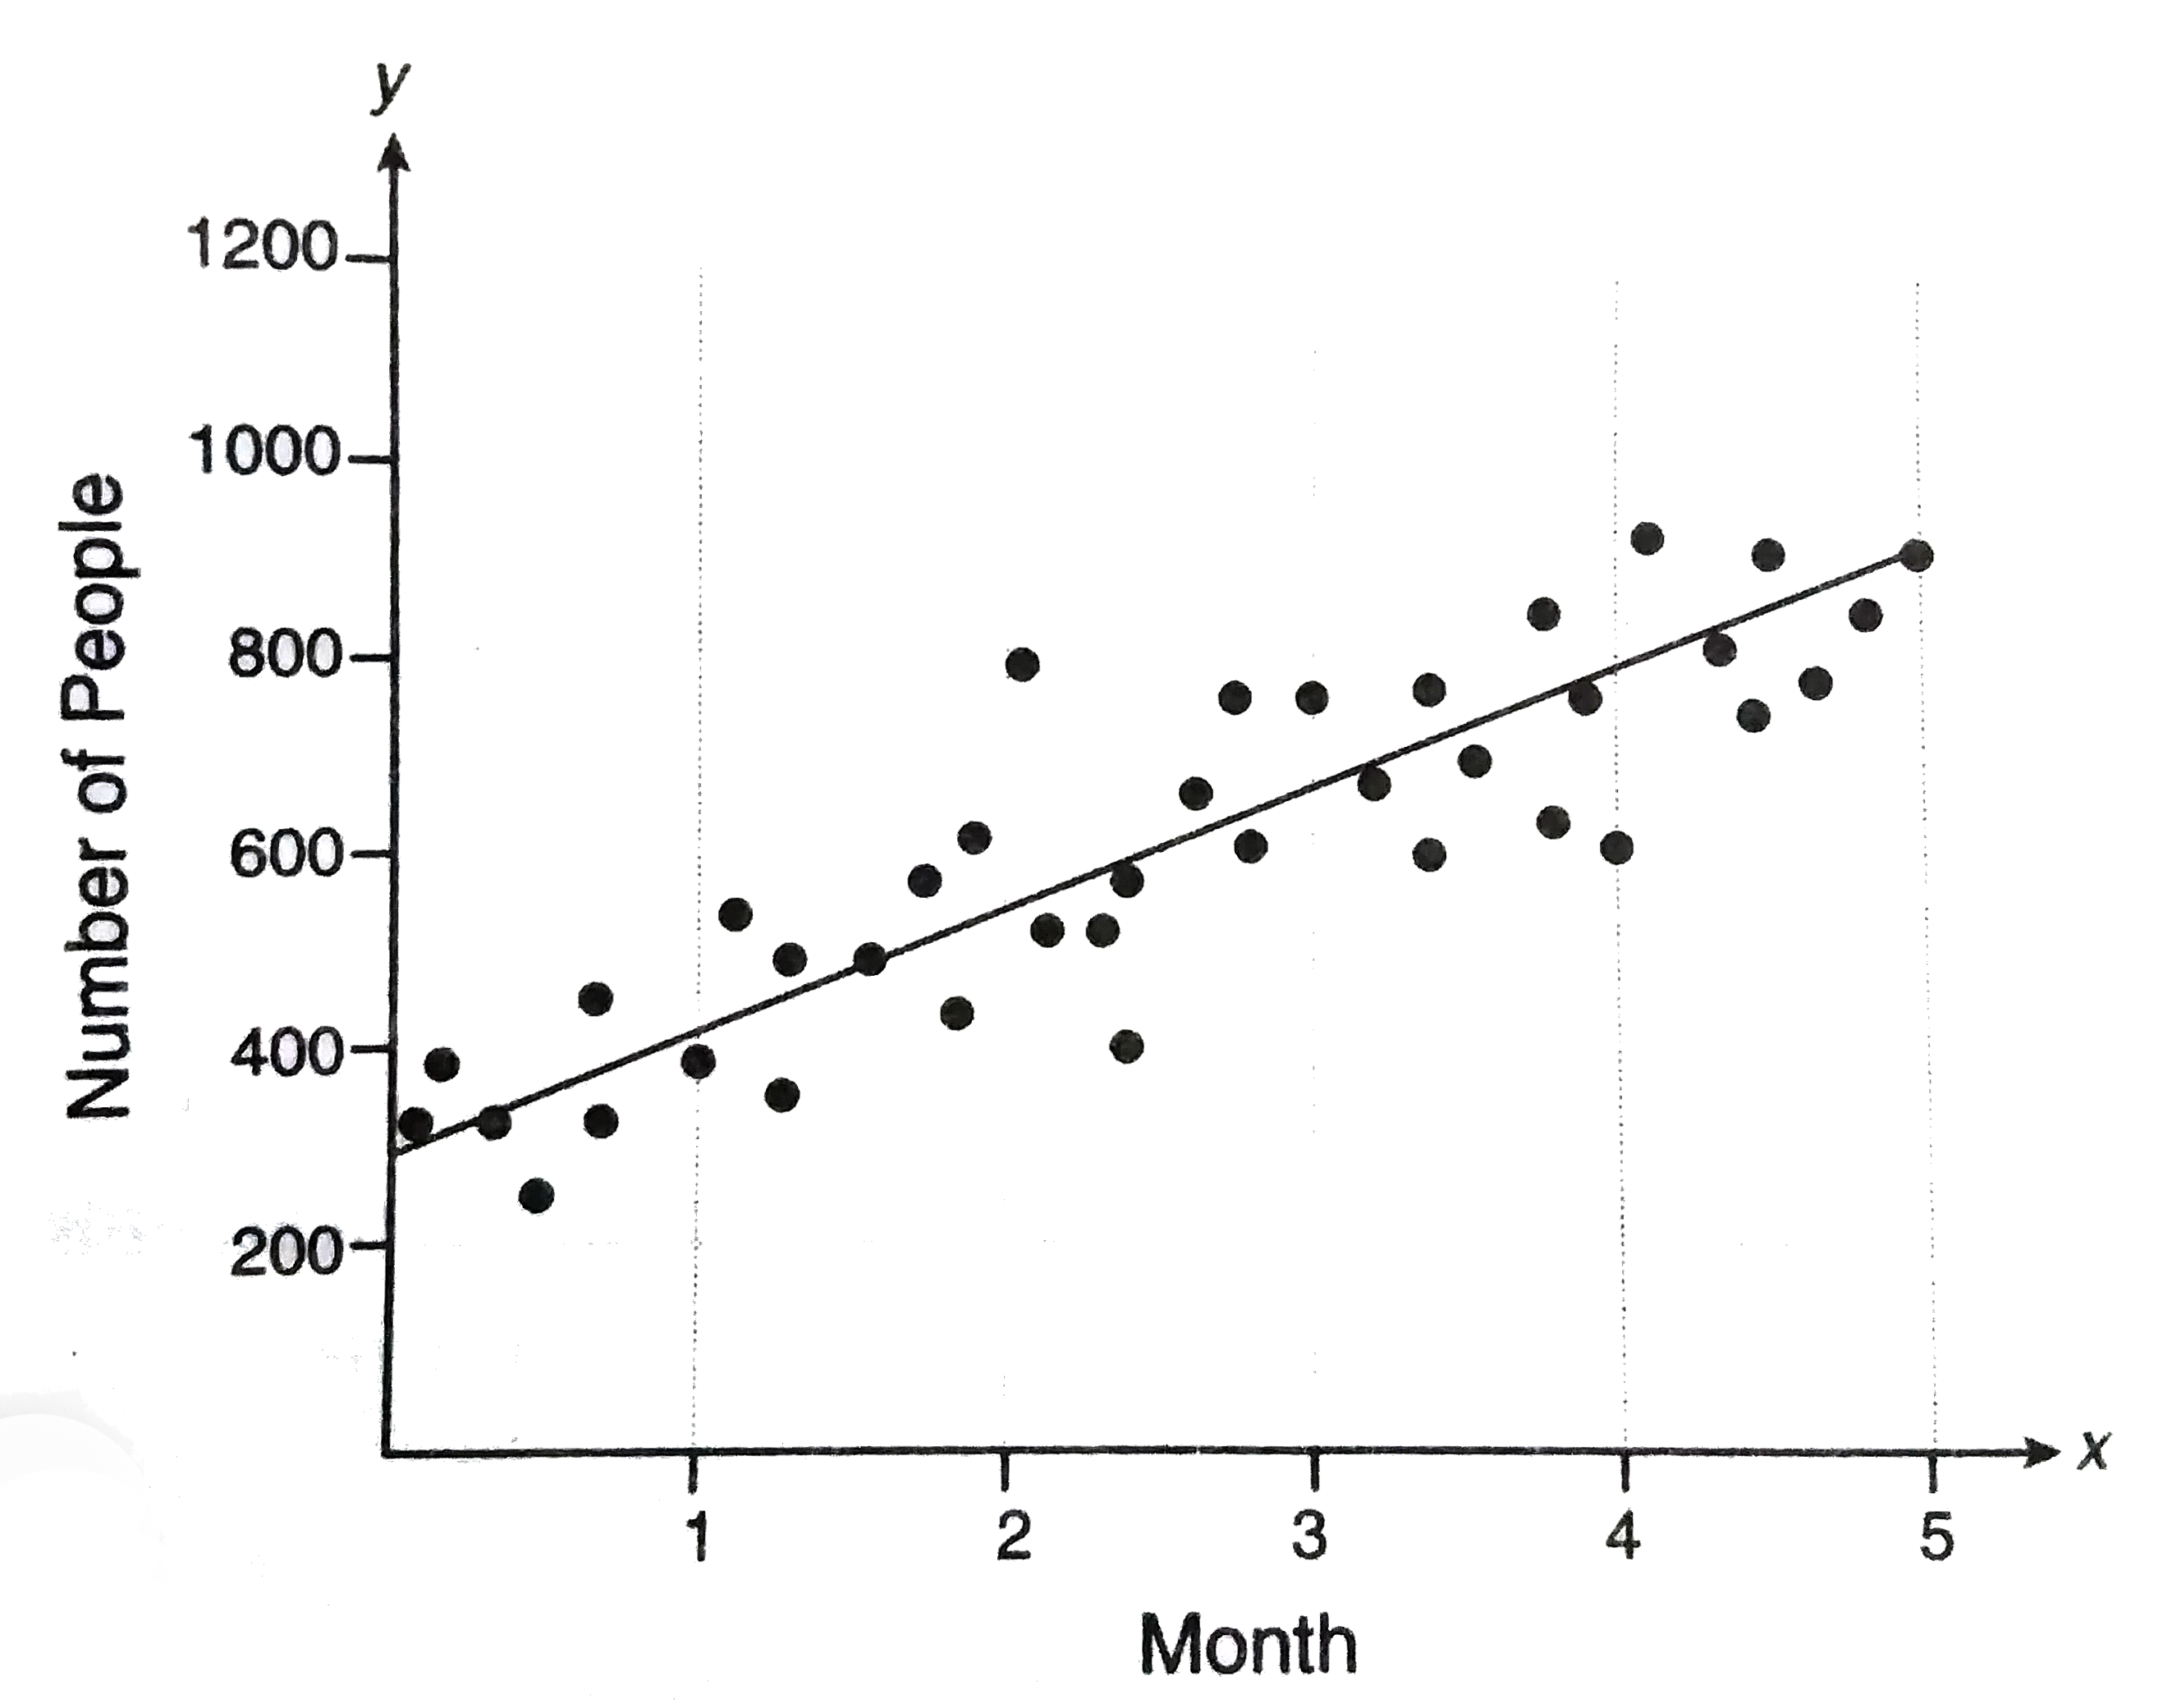
Question 5-7 refer to the scatterplot above.
A new fitness class was started at several fitness clubs owned by the same company. The scatterplot shows the total number of people attending the class during the first five months in which the class was offered. The line of best fit is drawn.
Q. At the beginning of which month did the actual number of people attending the class differ by the greatest amount from the number predicted by the line of best fit?View Solution
Knowledge Check
- Question 1 - Select One
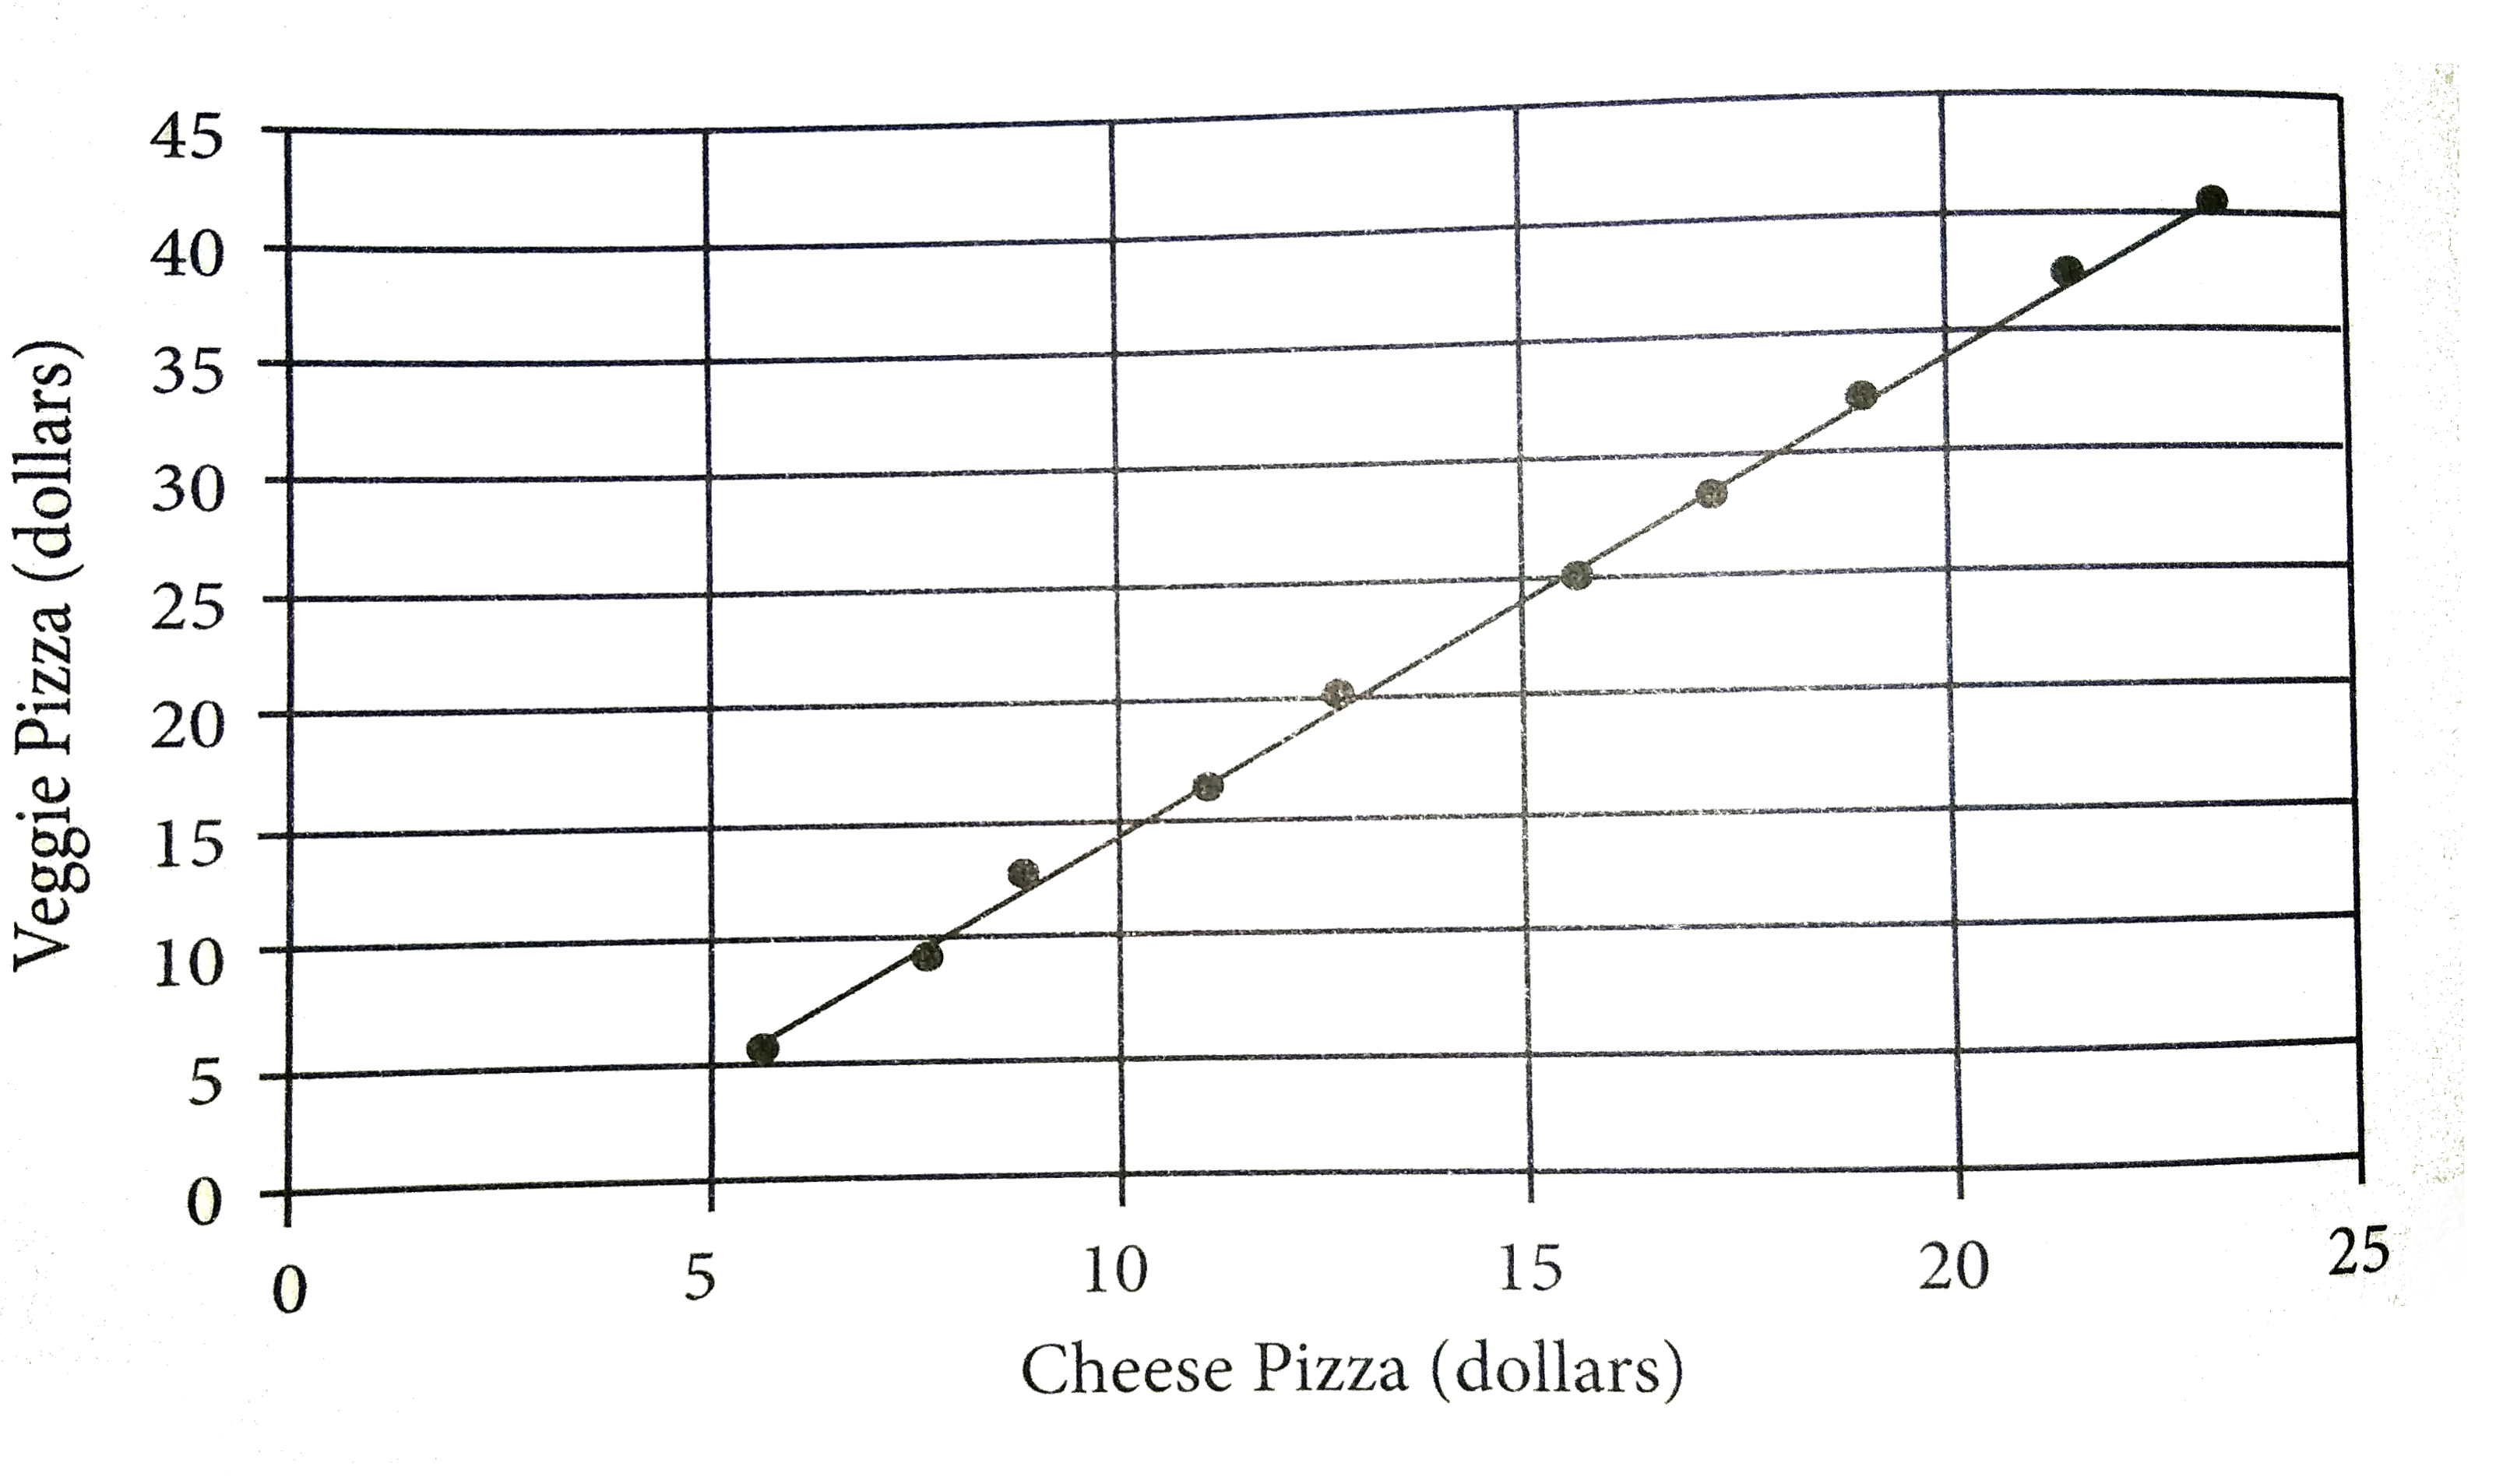
The scatterplot above shows the price, in dollars, for both cheese pizza and a veggie pizza for ten different pizzerias. The line of best fit is also shown. According to the line of best fit, which of the following is closer to the predicted increase in the price of a veggie pizza, in dollars, for every 1 dollar increase in the price of a cheese pizza?A1.5B2.0C2.5D3.0 - Question 2 - Select One
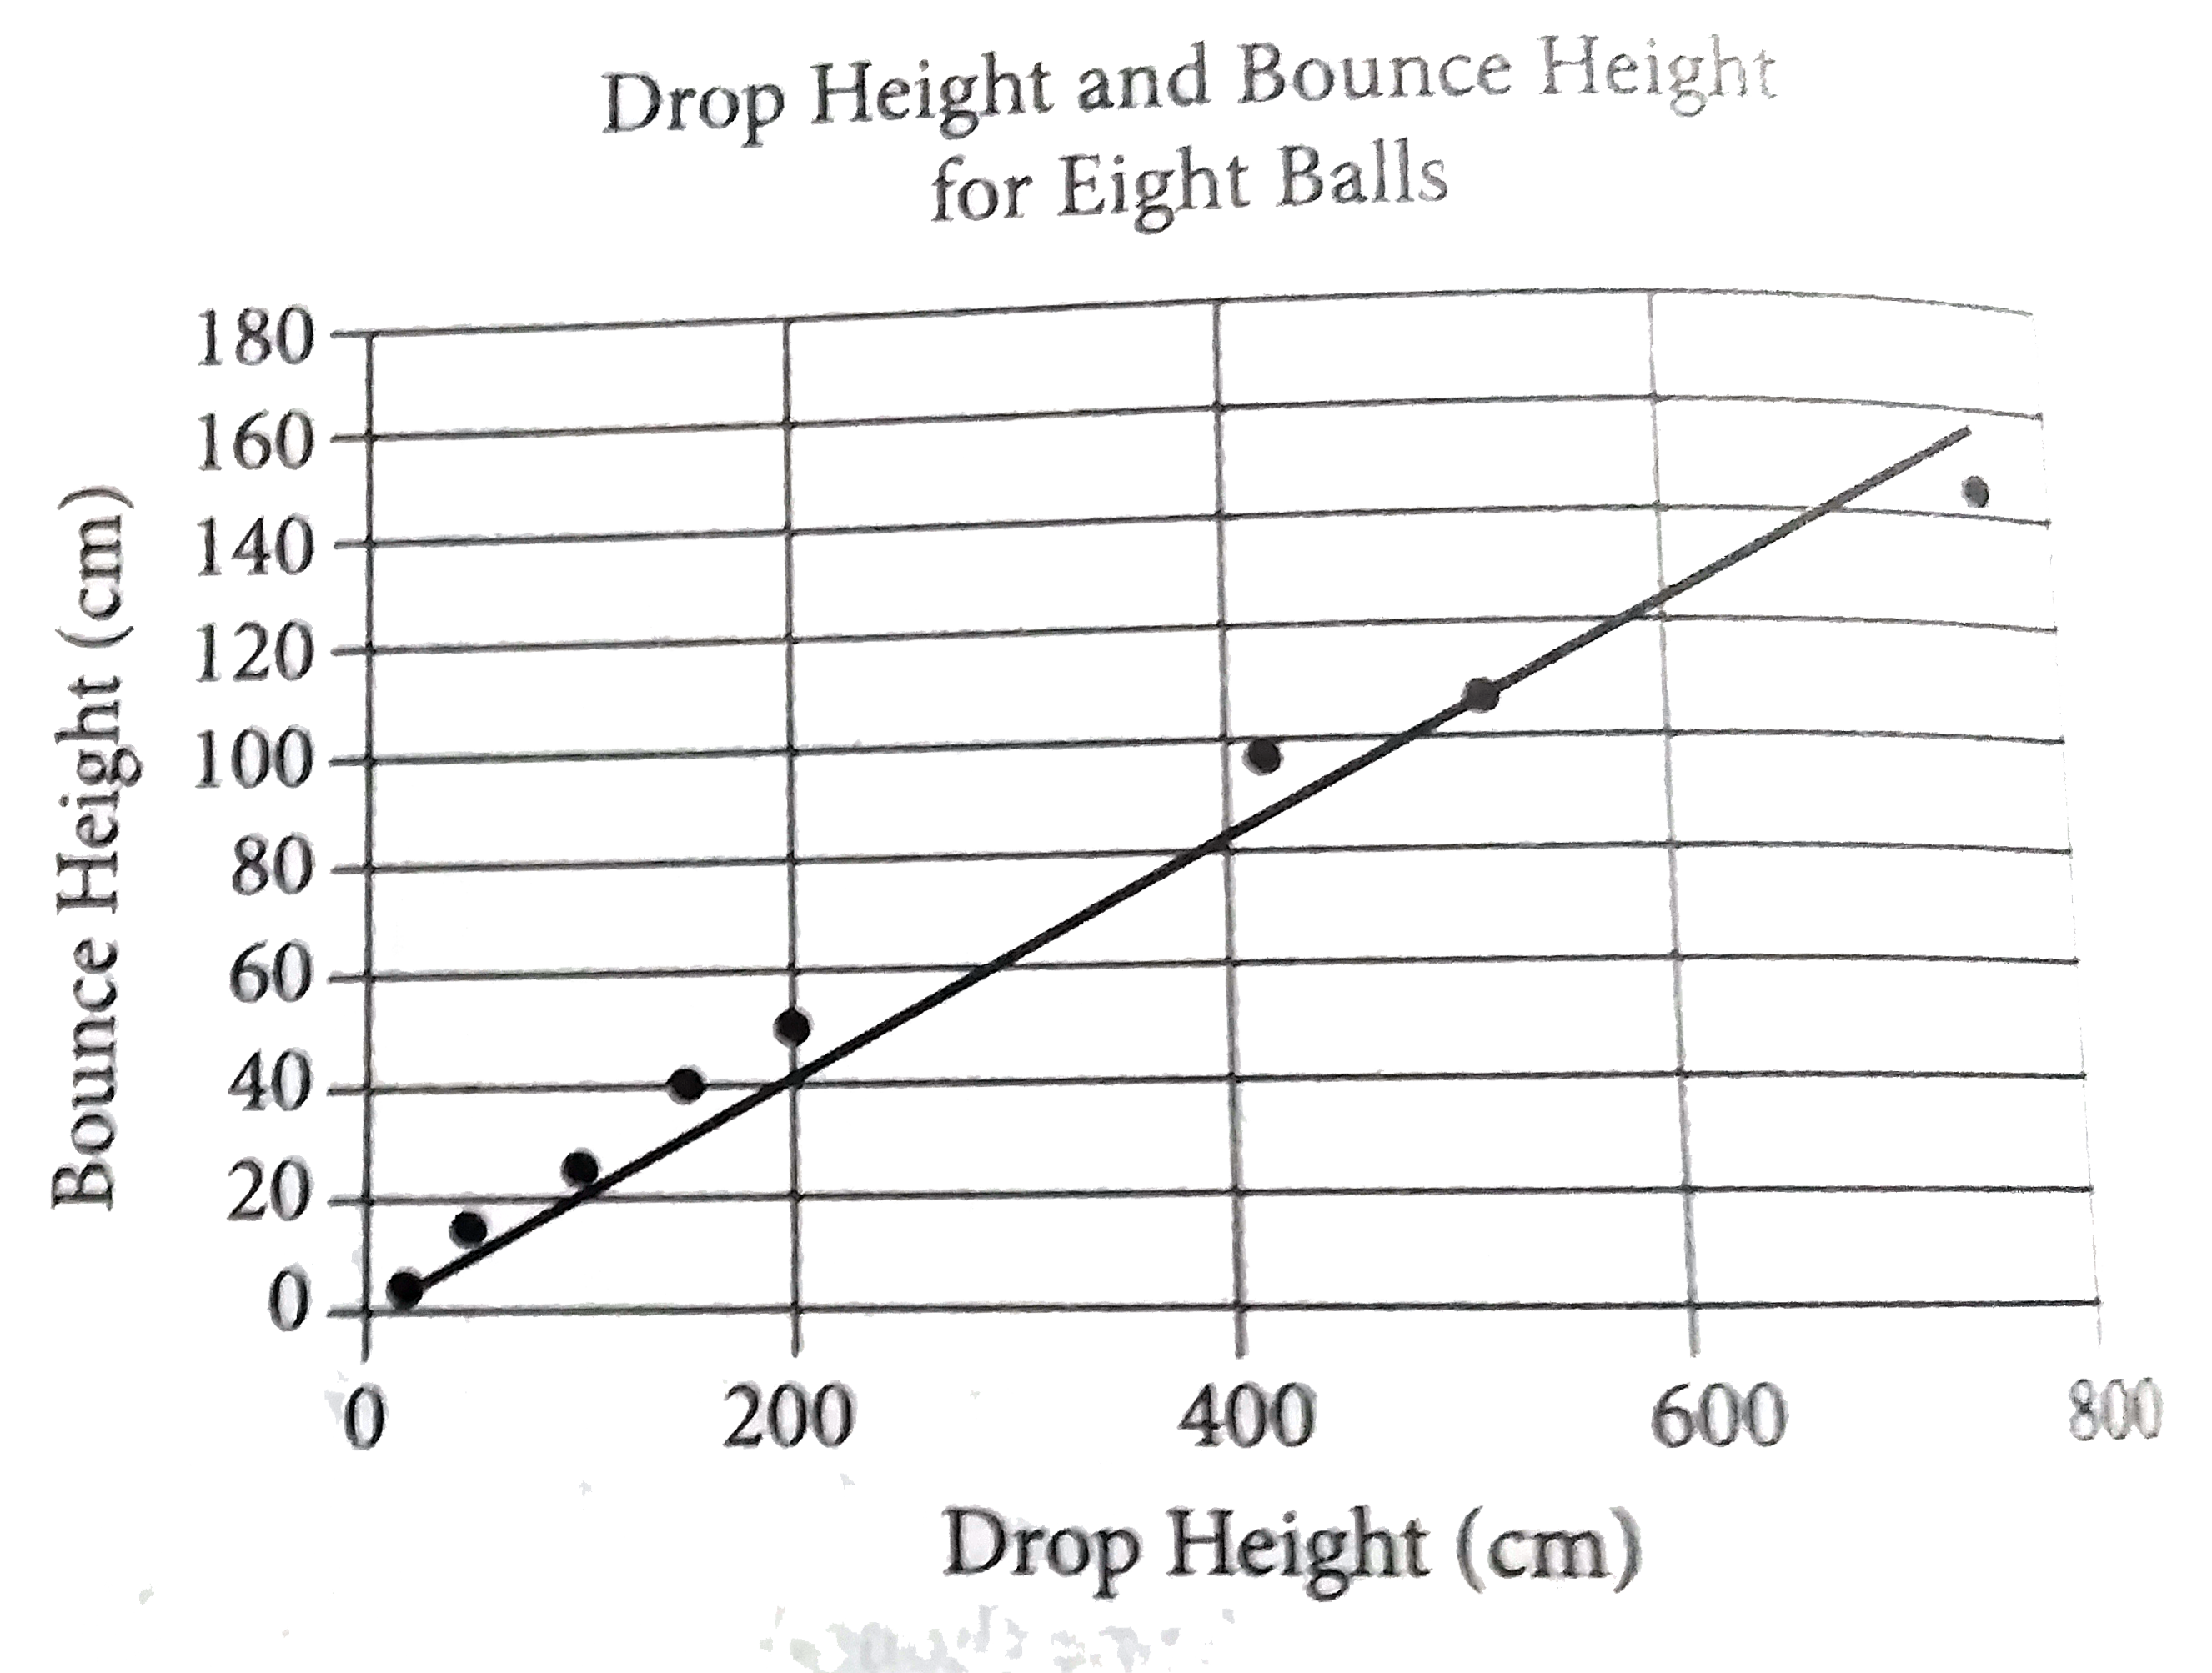
The scatterplot above shows the height in centimeters for both the drop and bounce of eight different balls of the same type. The line of best fit for the data is also shown. According to the lines of best fit, which of the following is closest to the predicted increase in bounce height, in centimeters, for every increase of 100 centimeters in drop height?A25B20C15D10 - Question 3 - Select One
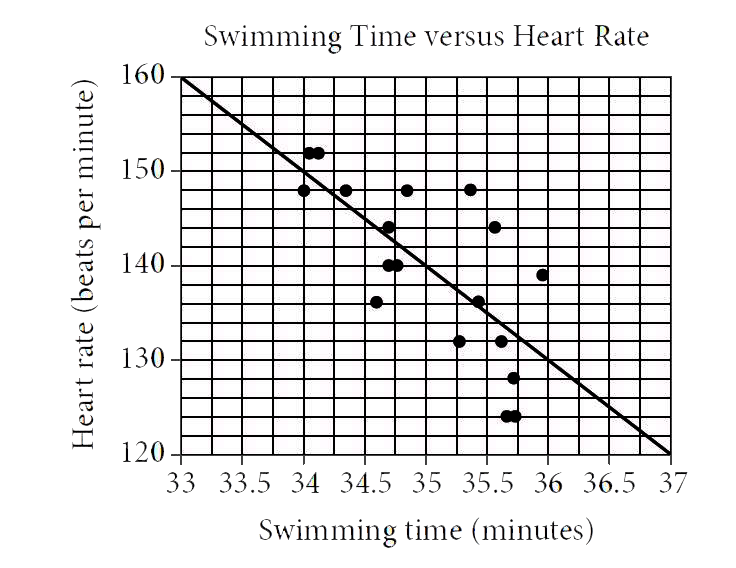
Michael swam 2,000 yards on each of eighteen days. The scatterplot above shows his swim time for and corresponding heart rate after each swim. The line of best fit for the data is also shown. For the swim that took 34 minutes, Michael’s actual heart rate was about how many beats per minute less than the rate predicted by the line of best fit?A1B2C3D4
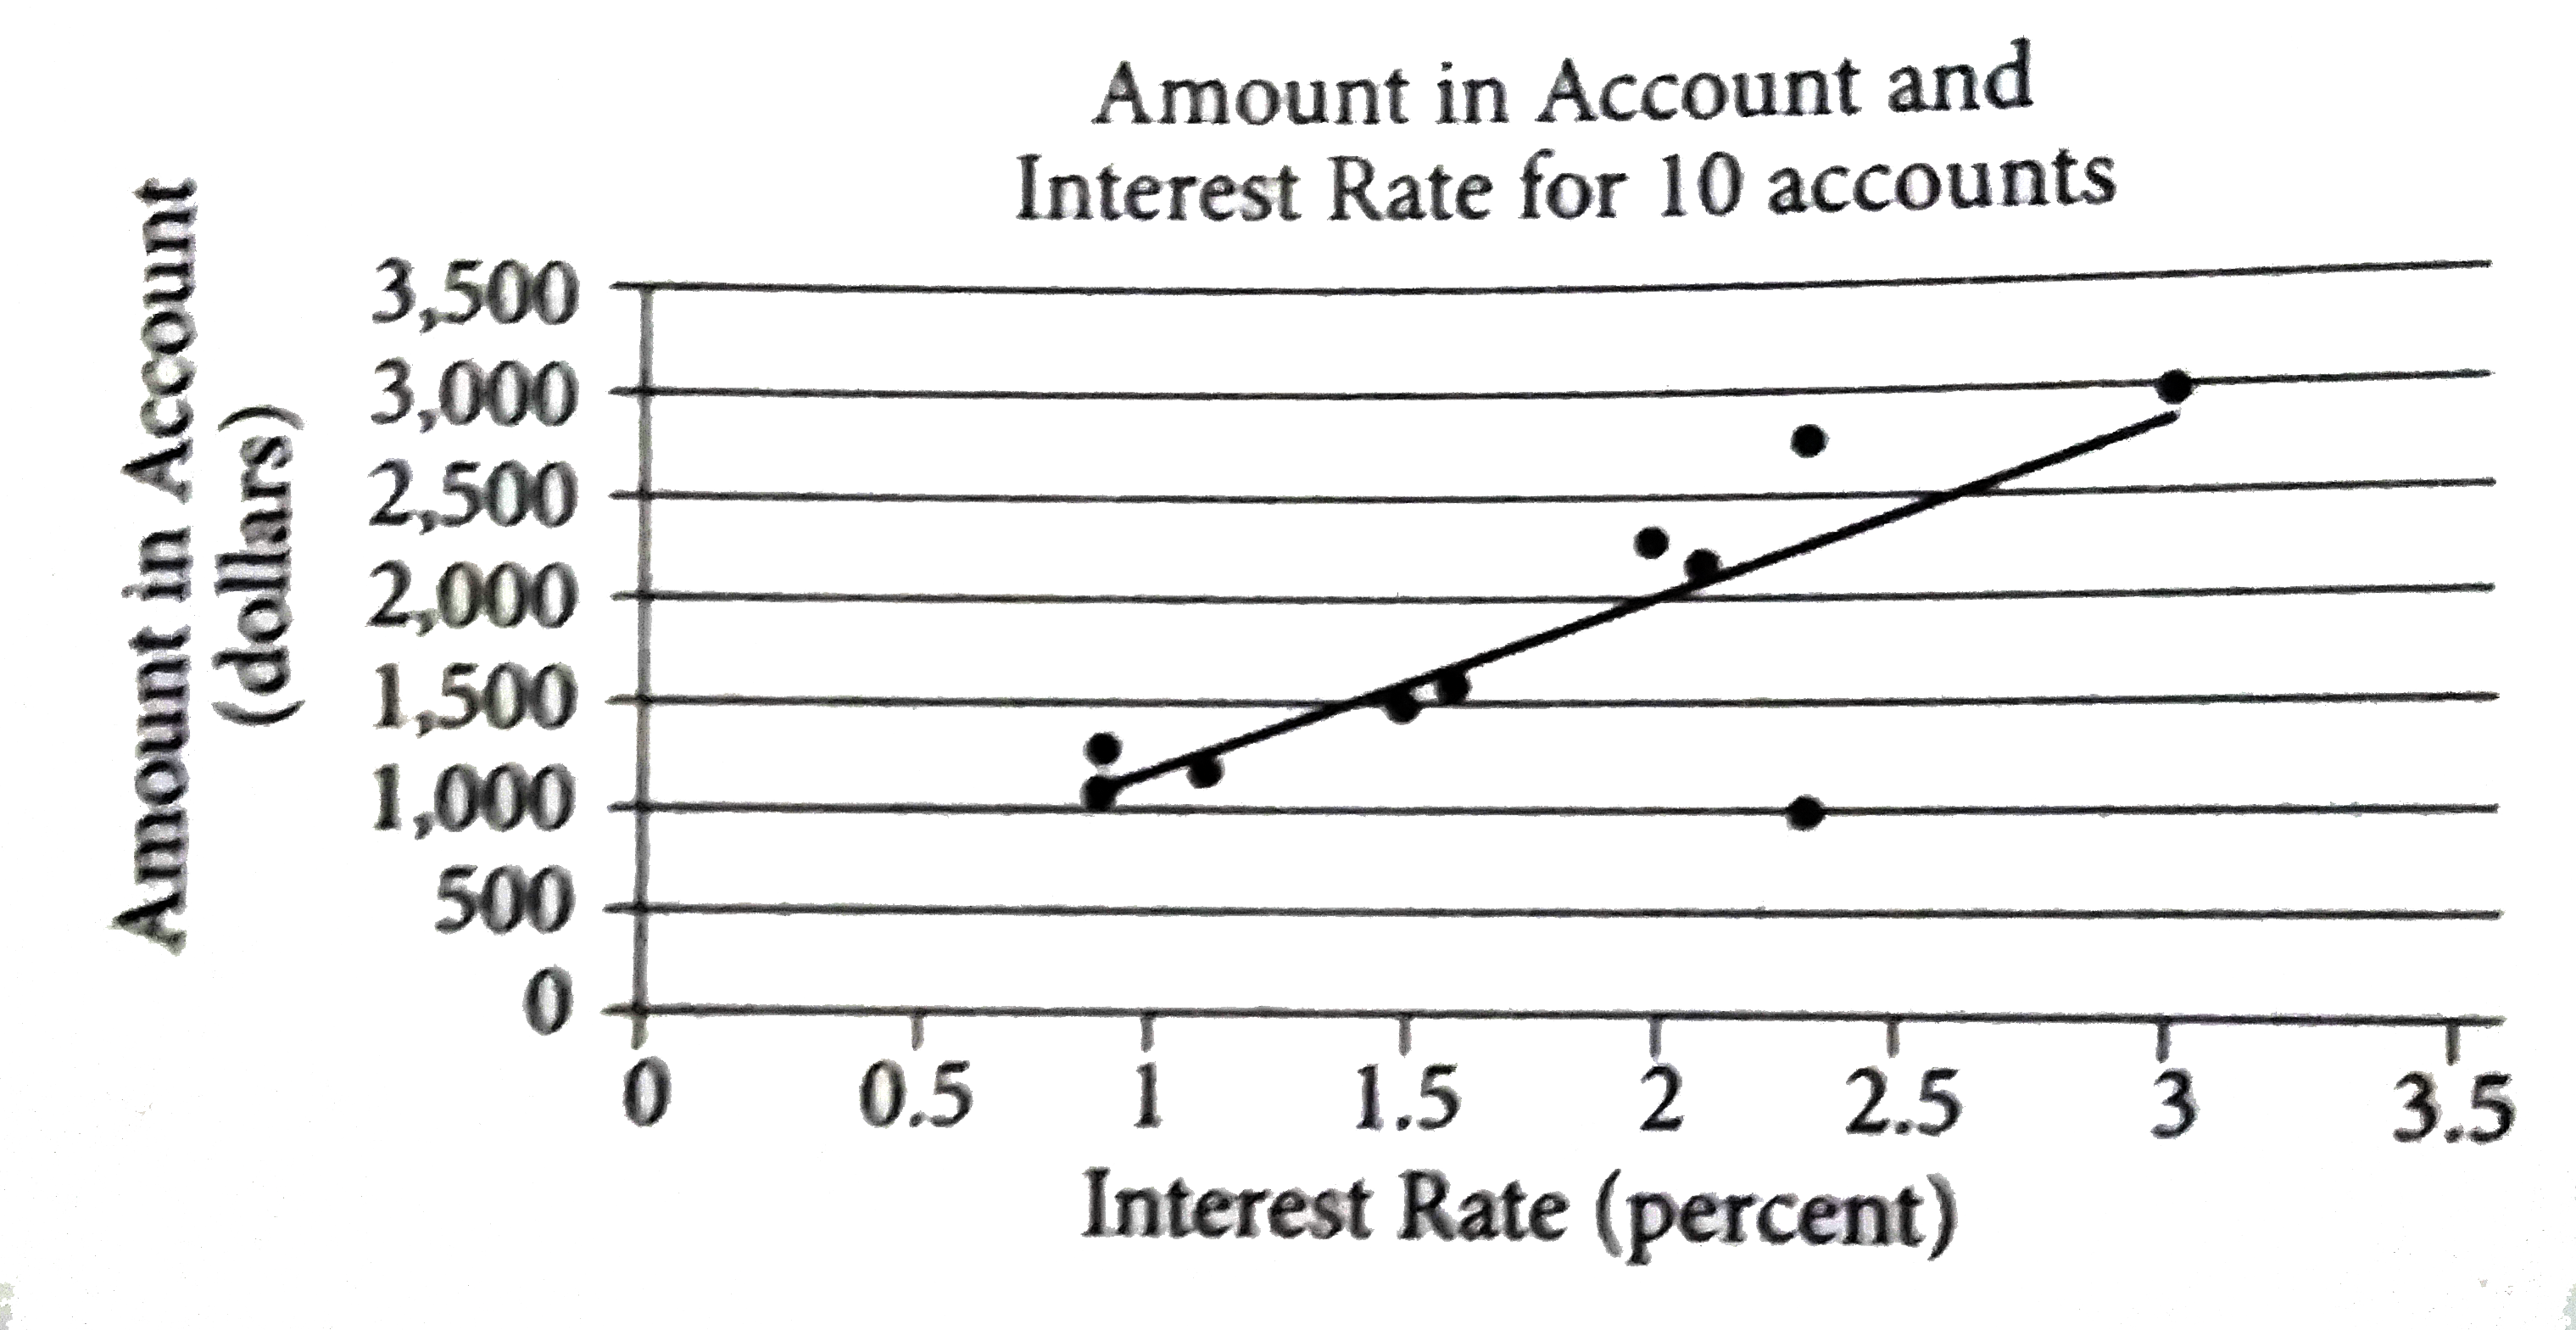
The scatterplot above shows data for ten accounts opened by a company , along with the line of best fit. For the account that contains the least amount of money, which of the following is closest to the difference of the actual amount and the amount predicted by the line of best fit?View SolutionA new fitness class was started at a chain of fitness clubs owned by the same company. The scatter plot above shows the total number of people attending the class during the first 5 months in which the class was offered. The line of best fit is drawn. If n is the number of the month, which of the following functions could represent the equation of the graph's line of best fit?
View Solution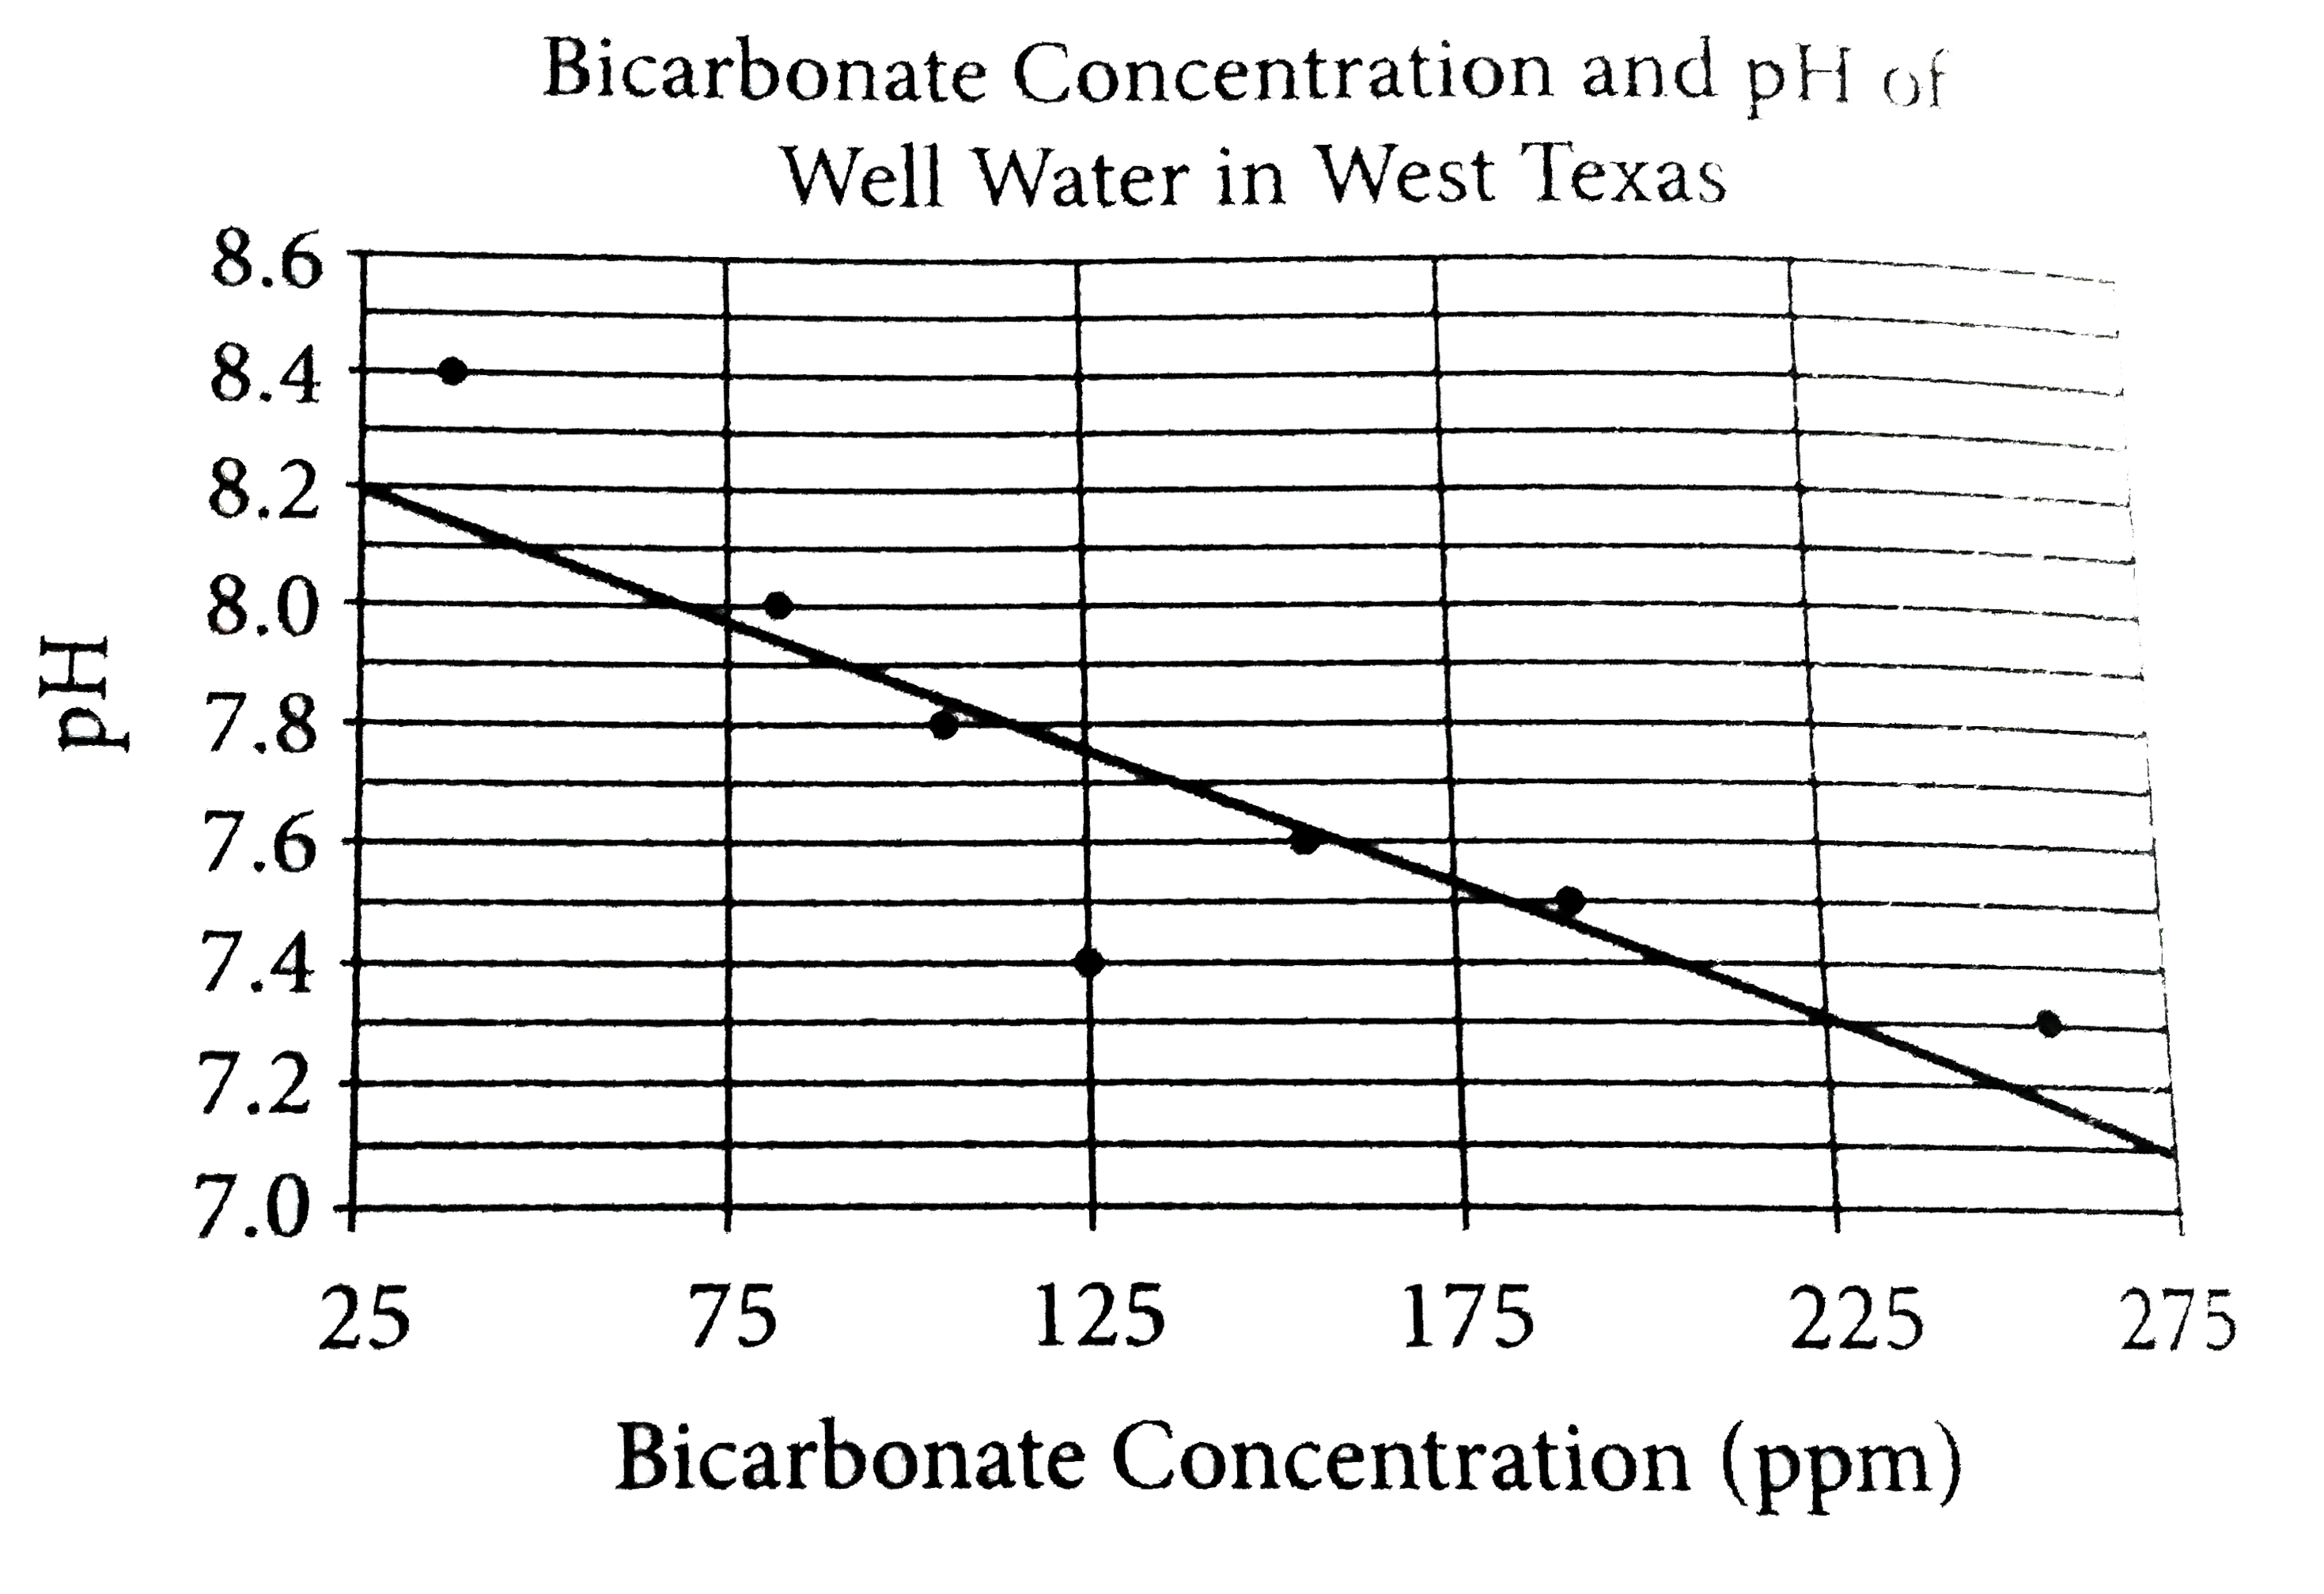
The scatterplot above shows the pH of seven well water samples in West Texas with respect to the bicarbonate concentration in ppm(parts per million). The line of best fit is also shown.
According to the scatterplot, which of the following statements about the relationship between a well's pH and its bicarbonate concentration is true?View SolutionThe relative housing cost for a US city is defined to be the ratio average housing cost for the citynational average housing cost expressed as a percent.
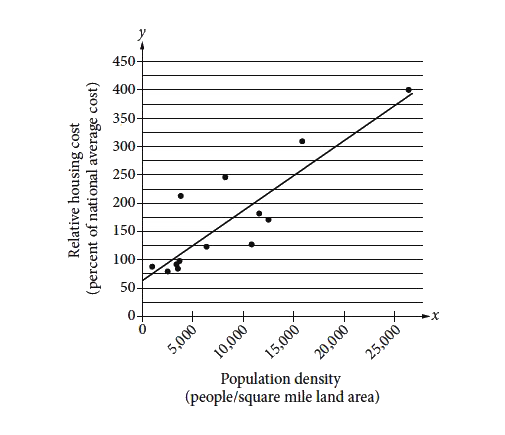
The scatterplot above shows the relative housing cost and the population density for several large US cities in the year 2005. The line of best fit is also shown and has equation y = 0.0125x + 61. Which of the following best explains how the number 61 in the equation relates to the scatterplot?View Solution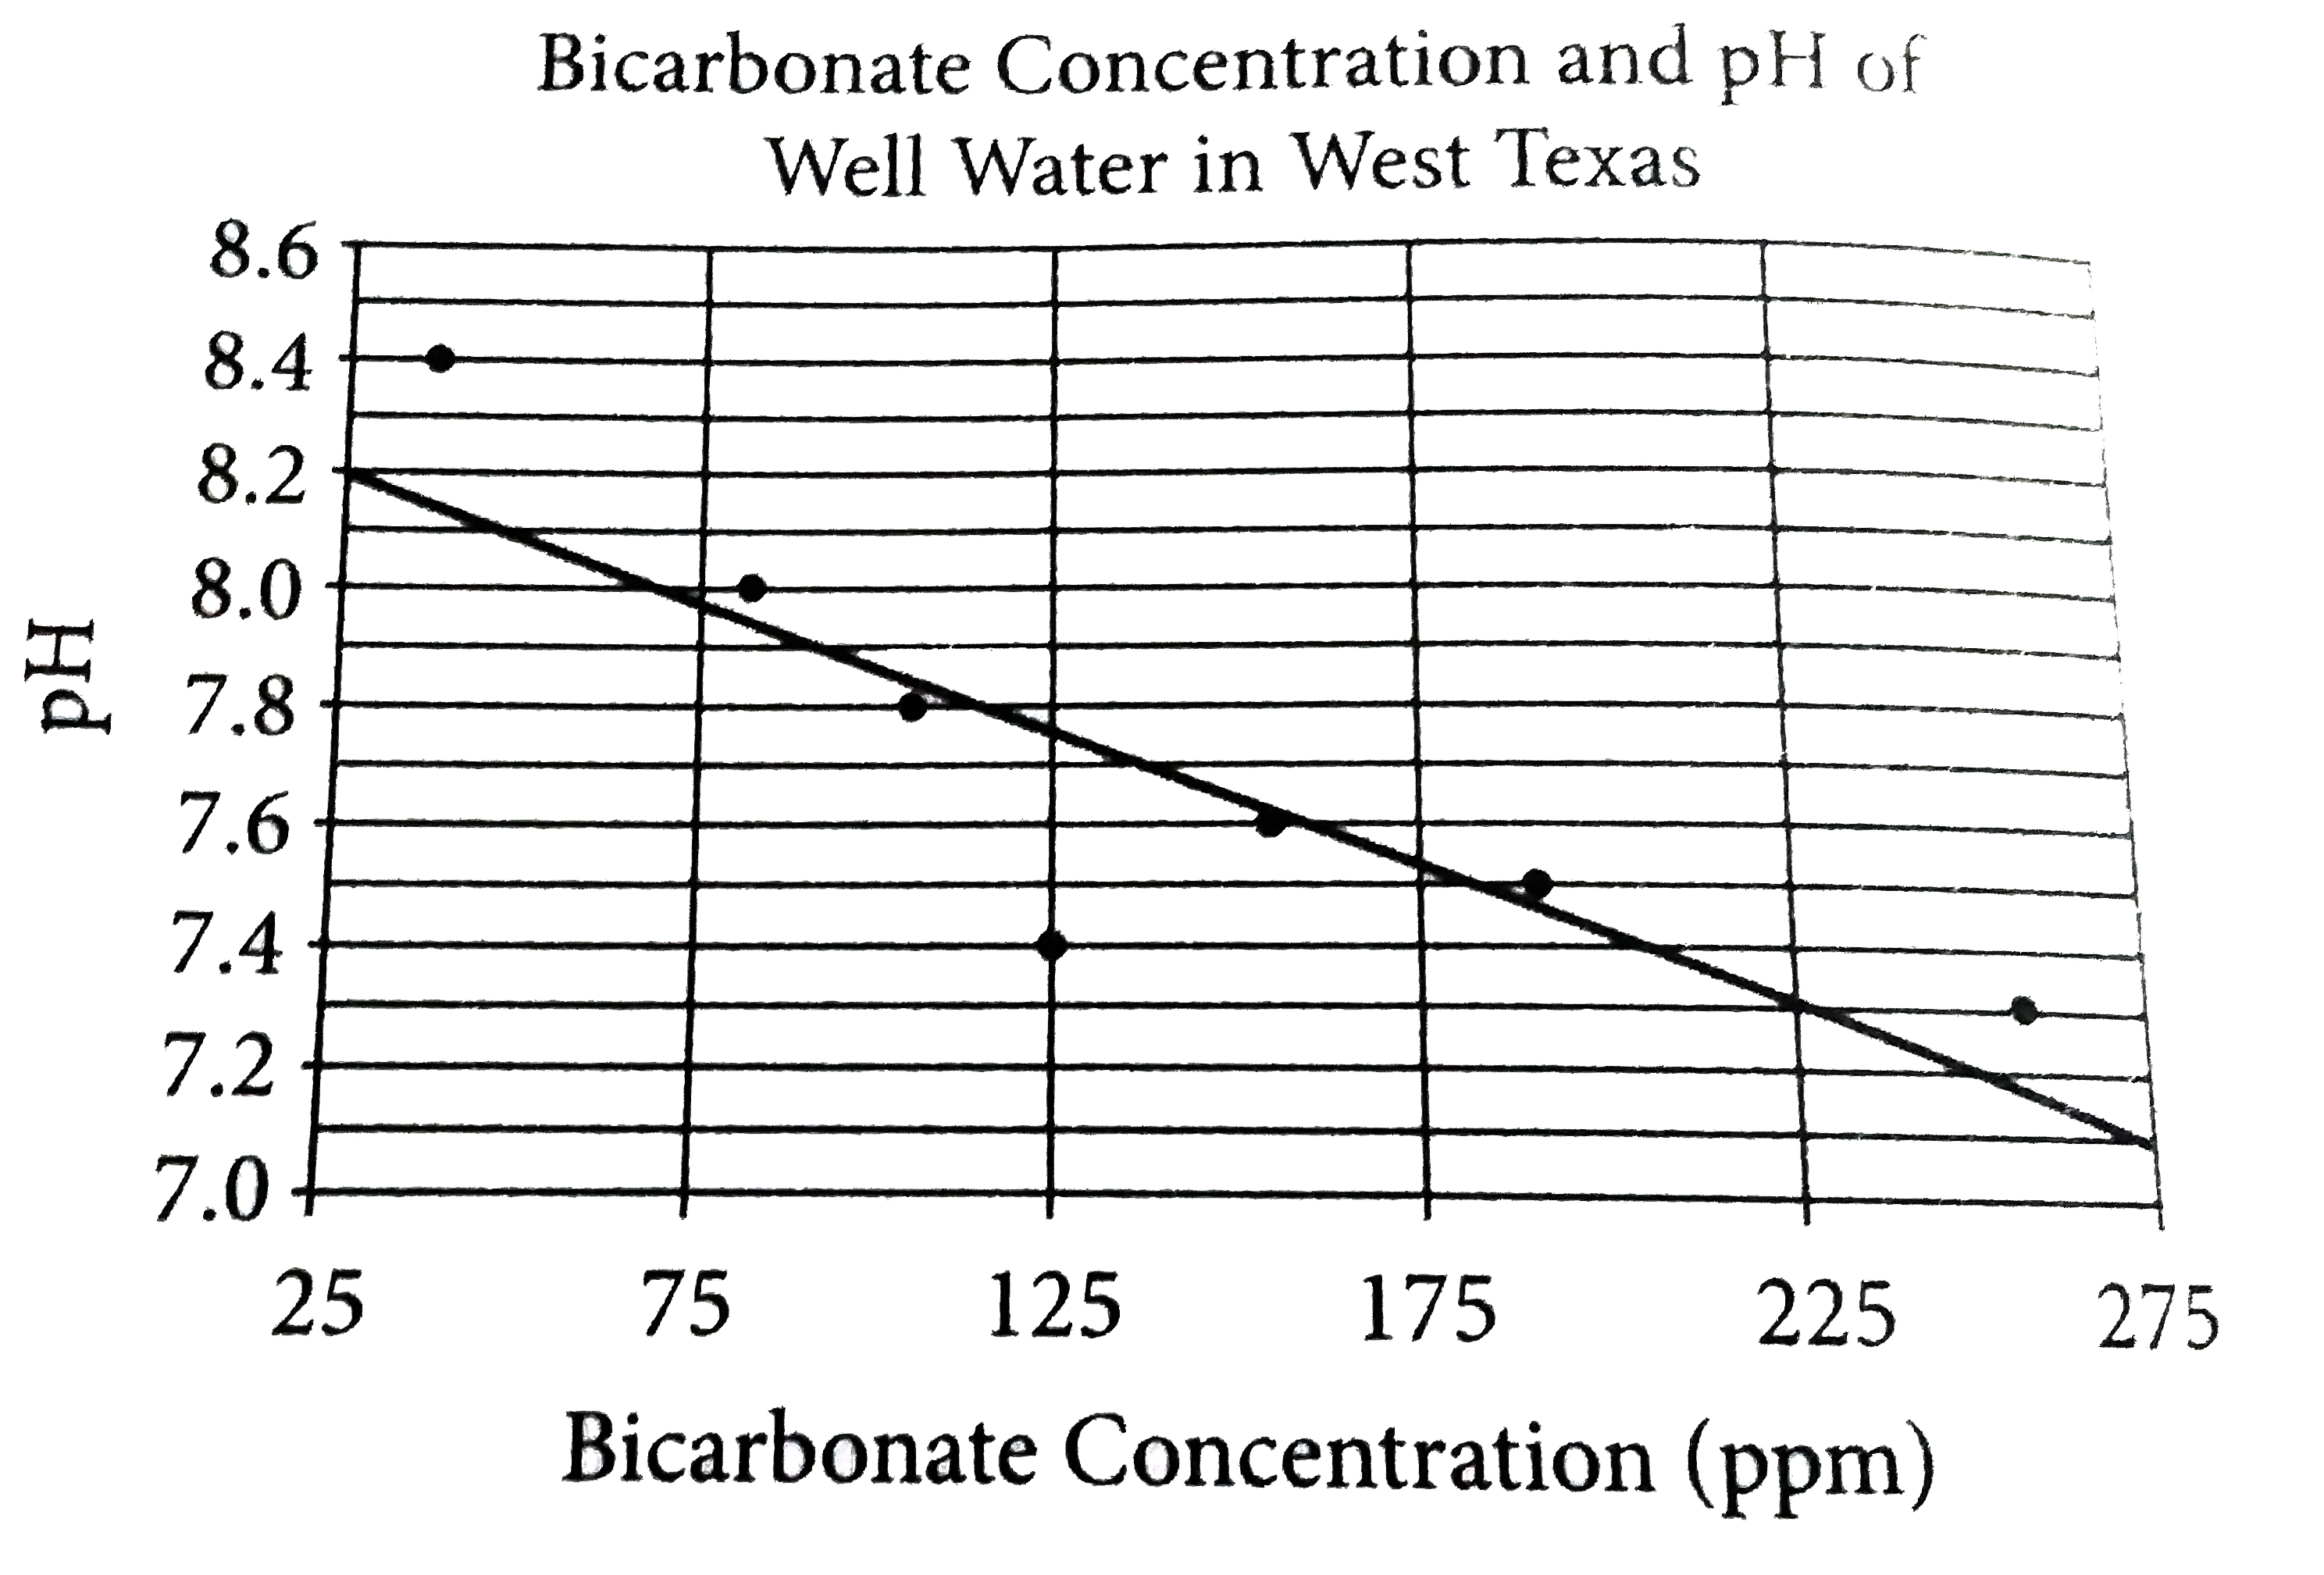
The scatterplot above shows the pH of seven well water samples in West Texas with respect to the bicarbonate concentration in ppm(parts per million). The line of best fit is also shown.
A new well is discovered in West Texas with a bicarbonate concentration of 225 ppm. According to the line of best fit, which of the following best approximates the pH of the well water?View Solution

