(i) A sound source emitting sound at a single frequency moves with constant speed along x-axis as shown in figure (a). A and B are two stationary observers. The three plots shown in figure (b) indicate the pressure function P(x) of the sound wave as recorded by the observer A, by B, and by another observer C who is at rest in the frame of the source. Which plot (marked as 1, 2 and 3) correspond to which observer?

(ii) Each of the two figures is rough illustration of the resulting waveform (y versus t ) due to overlapping of two waves. The four component waves have frequencies of 300 Hz, 200 Hz, 204 Hz and an unknown frequency f=300+Δf. Is Δf higher than or less than 4Hz?

The correct Answer is:(i) A-1 B-2 C-3
(ii) Less than 4 Hz
Step by step video, text & image solution for (i) A sound source emitting sound at a single frequency moves with constant speed along x-axis as shown in figure (a). A and B are two stationary observers. The three plots shown in figure (b) indicate the pressure function P(x) of the sound wave as recorded by the observer A, by B, and by another observer C who is at rest in the frame of the source. Which plot (marked as 1, 2 and 3) correspond to which observer? (ii) Each of the two figures is rough illustration of the resulting waveform (y versus t ) due to overlapping of two waves. The four component waves have frequencies of 300 Hz, 200 Hz, 204 Hz and an unknown frequency f=300+Deltaf. Is Deltaf higher than or less than 4 Hz? by Physics experts to help you in doubts & scoring excellent marks in Class 11 exams.
Topper's Solved these Questions
Similar Questions
A source of sound is travelling towards a stationary observer. The frequency of sound heard by the observer is 25% more than the actual frequency. If the speed of sound is v, that of the source is
View SolutionWhen a source of sound is in motion towards a stationary observer, the effect observed is
View Solution
Knowledge Check
- Question 1 - Select One
A sound source, emitting sound of constant frequency, moves with a constant speed and crosses a stationary observer. The frequency (n) of sound heard by the observer is plotted against time (t). Which of the following graphs represents the correct variation :-
A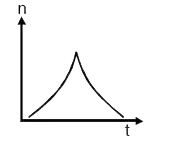 B
B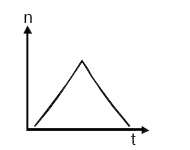 C
C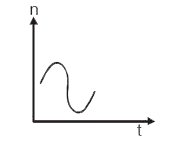 D
D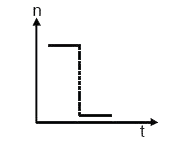
- Question 2 - Select One
A sound source, emitting sound of constant frequency, moves with a constant speed and crosses a stationary observer. The frequency (n) of sound heard by the observer is plotted against time (t). Which of the following graphs represents the correct variation :-
A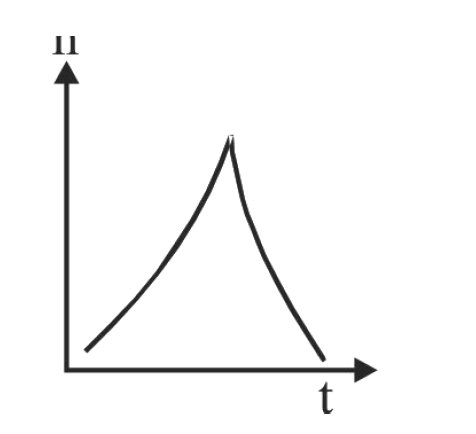 B
B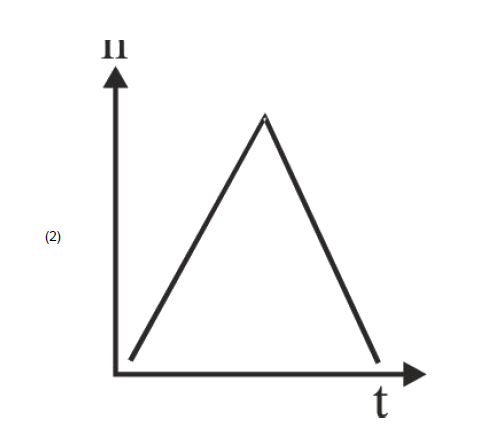 C
C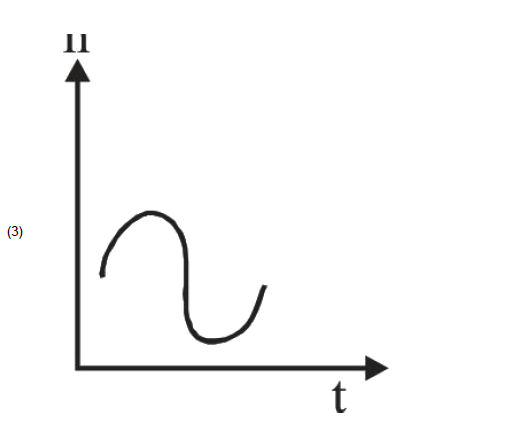 D
D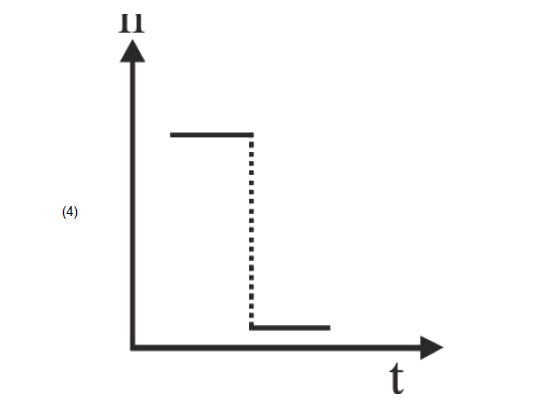
- Question 3 - Select One
When a source of sound moves towards a stationary observer the pitch of sound will appear to
AincreaseBbecome zeroCdecreaseDremain the same
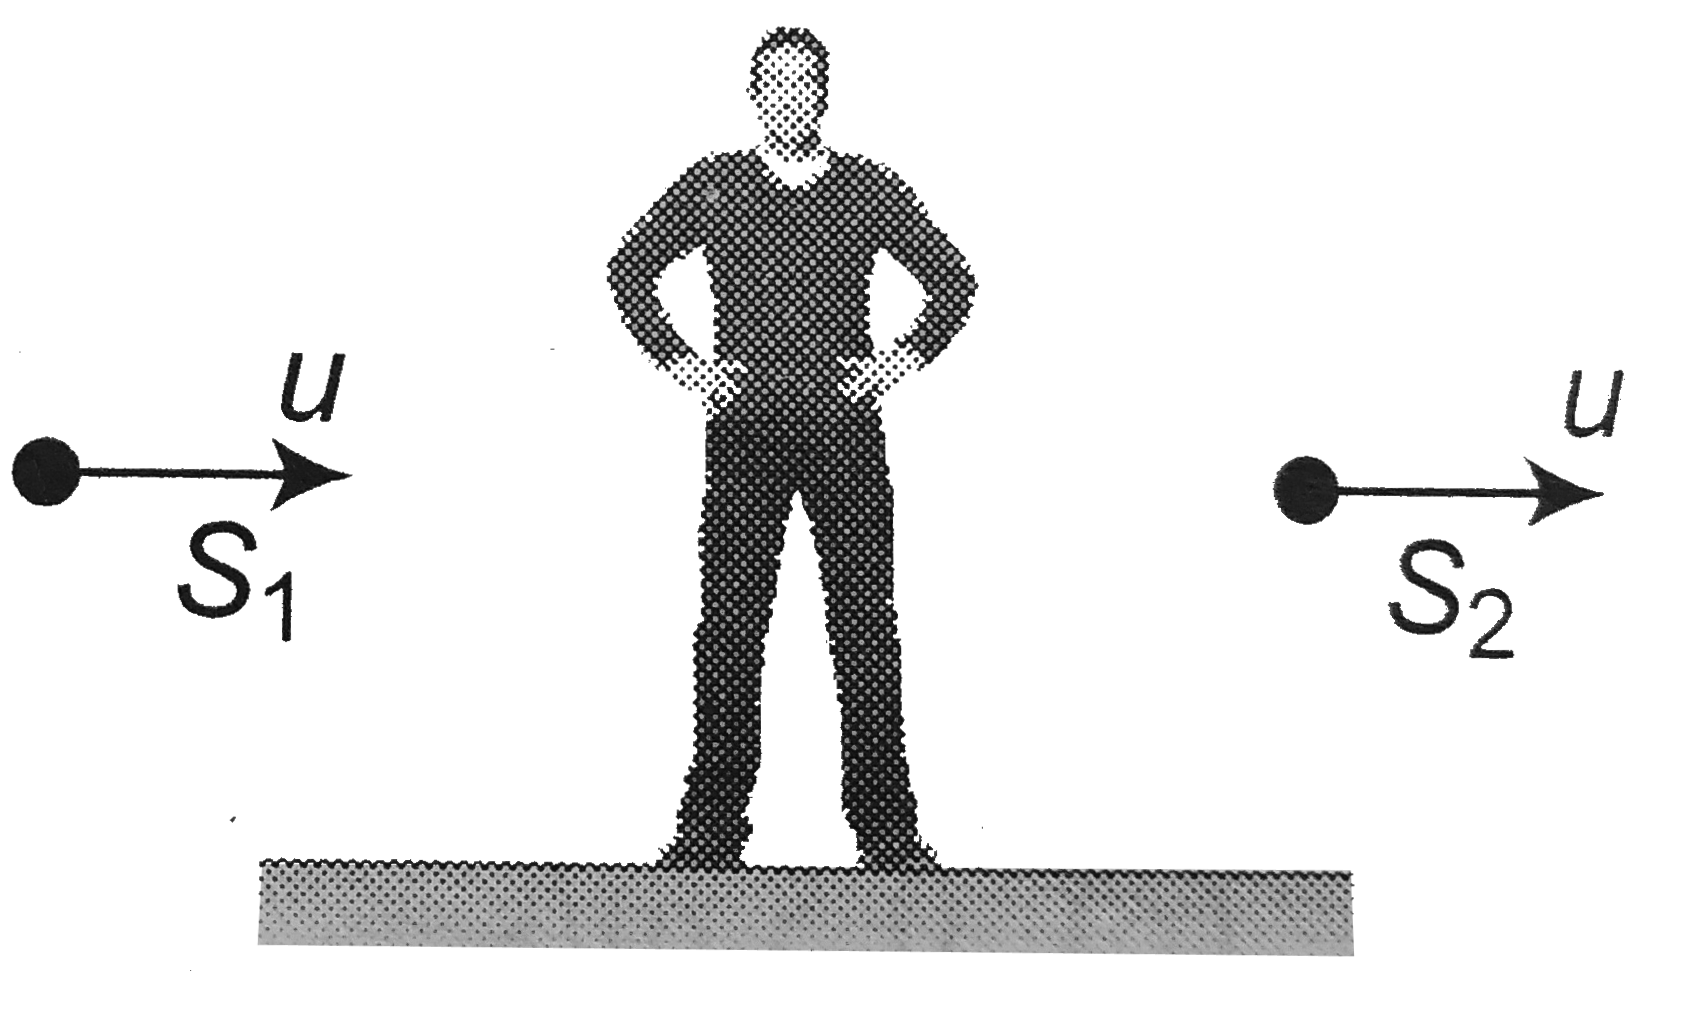
Two sources S1 and S2 of same frequency f emits sound. The sources are moving as shown with speed u each. A stationary observer hears that sound. The beat frequency is (v=velocity sound)View SolutionAn observer is moving towards the stationary source of sound, then
View SolutionIf a source of frequency n moving with velocity v crosses a stationary observer, then the change in the frequency of sound heard by the observer will be (velocity of sound = V)
View SolutionA train whistling at constant frequency is moving towards a station at a constant speed v. The train goes past a stationary observer on the station. The frequency v of the sound as heard by the observer is plotted as a function of time t. Identify the expected curve.
View SolutionA source of sound moves towards an observer
View Solution

