A graph plotted between Pdvsd (where p is osmotic pressure of solution of a solute of mol. Wt. m and d is its density temperature T. Pick out the correct statements about the plots :
[Pd]d→0=STm
The intercept of the plot STm
The intercept of the plot =[Pd]d→0
[Pd]d→0 is independent of temperature
The correct Answer is:A, B, C
P=MST
P=nV×ST
P=wV×M×ST
Pd=STM
Topper's Solved these Questions
- SOLUTIONSBOOK - RESONANCECHAPTER - SOLUTIONSEXERCISE - EXERCISE-2(PART-4)
4 Videos
- SOLUTIONSBOOK - RESONANCECHAPTER - SOLUTIONSEXERCISE - EXERCISE-3(PART-1)
14 Videos
- SOLUTIONSBOOK - RESONANCECHAPTER - SOLUTIONSEXERCISE - EXERCISE-2(PART-1)
25 Videos
- SOLUTION AND COLLIGATIVE PROPERTIESBOOK - RESONANCECHAPTER - SOLUTION AND COLLIGATIVE PROPERTIESEXERCISE - PHYSICAL CHEMITRY (SOLUTION & COLLIGATIVE PROPERTIES)
52 Videos
- STEREOISOMERISMBOOK - RESONANCECHAPTER - STEREOISOMERISMEXERCISE - EXERCISE (PART III : PRACTICE TEST-2 (IIT-JEE (ADVANCED PATTERN))
22 Videos
Similar Questions
Knowledge Check
A graph between Pdvsd (where, P is osmotic pressure of solution of a solute of mol. Wt. m and d is
(wt. of solutevolume of solution) at temperature T). Pick the correct statement about the plots :A[pd]d→θ=STmBThe intercept of the plot =STmCThe intercept of the plot =[pd]d→θD[pd]d→θ is independent of temperatureIf P, V, and d are the pressure, Volumne and density of a given mass of gas at constant temperature, choose the correct option.
Apα1dBpαdCpα1vDBoth a and c
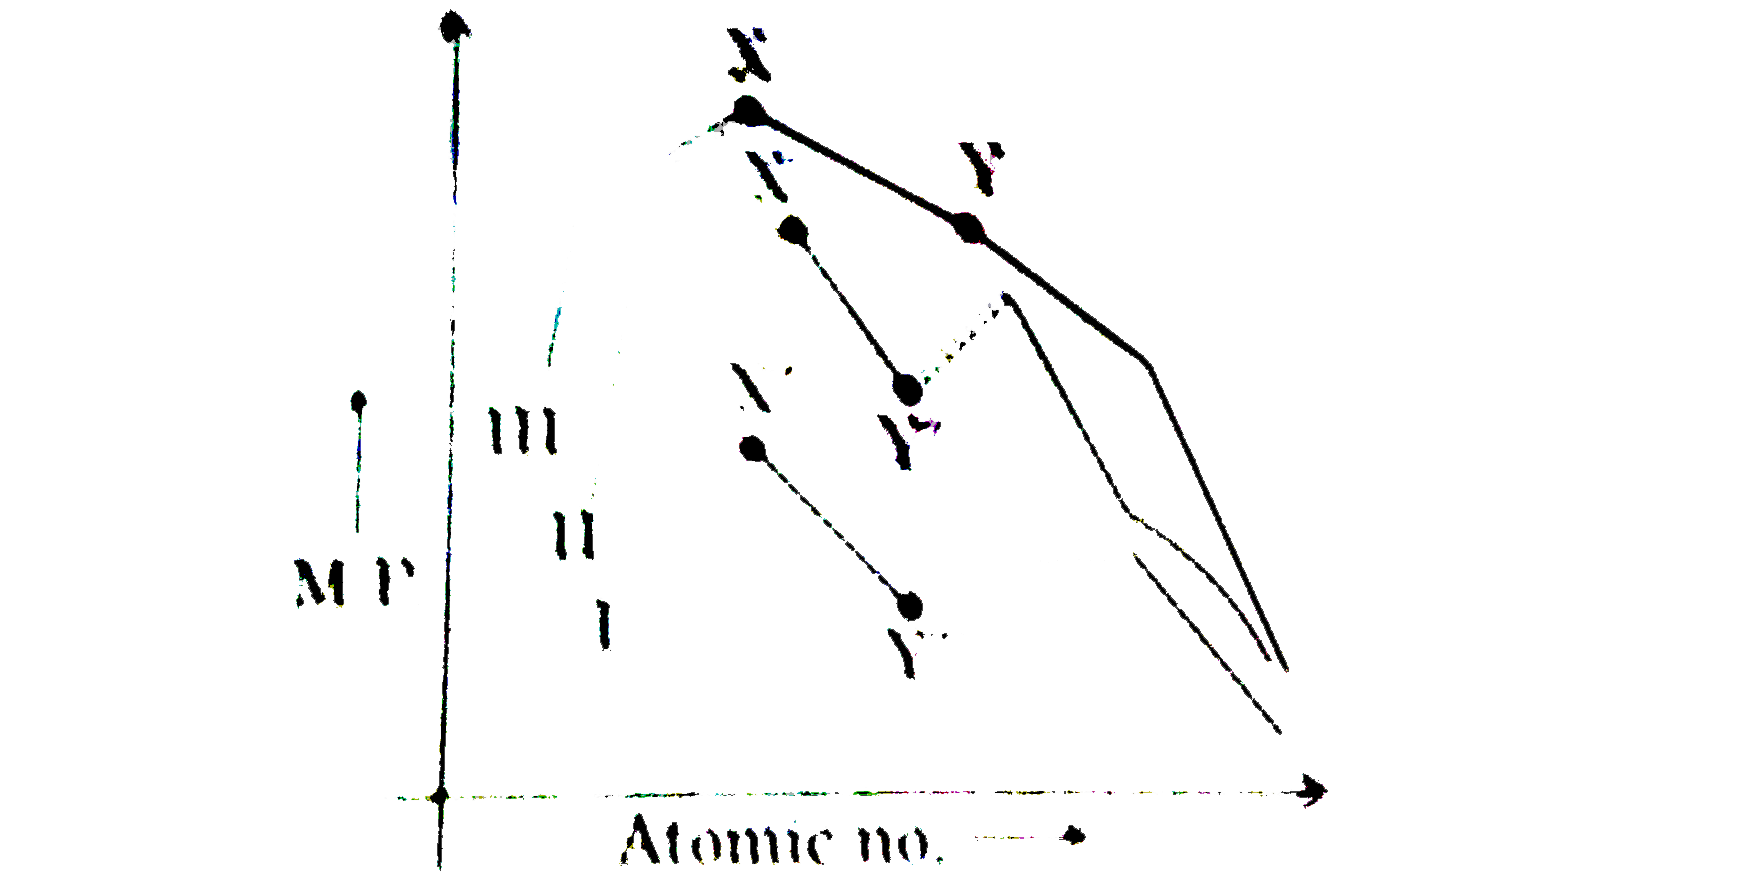
Refer to the graph for trends in M.P. of transition elements of 3d,4d and 5d series.
Q. Choose the correct statement(s).AIII refers to 3rd transition series of periodic table.BX corresponds to tungstenCY" corresponds to manganese.Dall of the above.
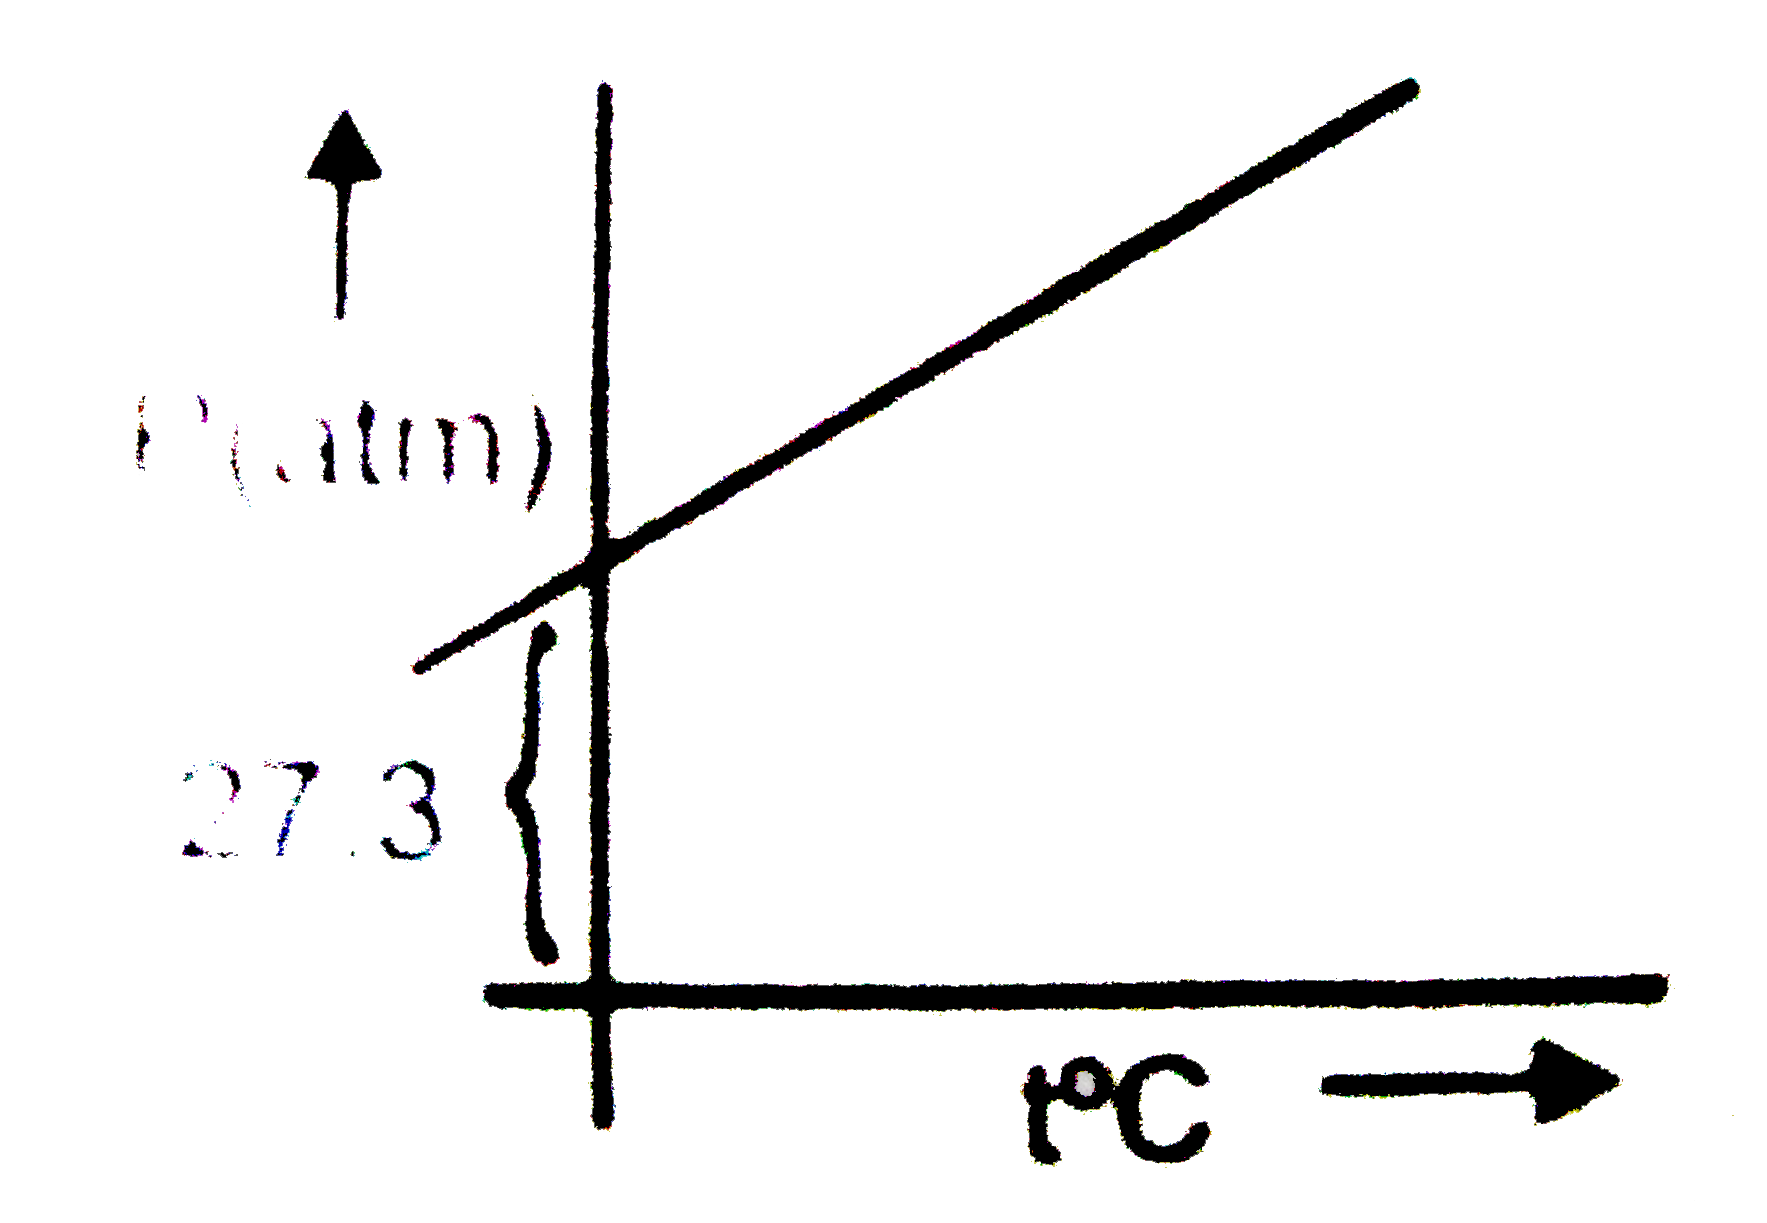
A graph is plotted between p (atm) vs t∘C for 10 mol of an ideal gas as follows:
Then slope of curve and volume of container (L) respectively, are:

View SolutionA graph is plotted between p (atm) vs t∘C for 10 mol of an ideal gas as follows:
Then slope of curve and volume of container (L) respectively, are:

View SolutionIf a graph is plotted between log V and log T for 2 moles of a gas of constant pressure of 0.0821 atm, then which of the following statements are correct?
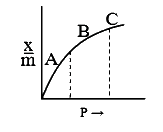
View SolutionA graph is plotted between extent of adsorption vs pressure (P) at constant temperature, the Frendlich equation at points A, B, C respectively are:

View SolutionAt a certain temperature, the value of the slope of the plot of osmotic pressure (π) against concentration (C in mol L−1) of a certain polymer solution is 291R. The temperature at which osmotic pressure is measured is (R is gas constant)
View Solution

