In the graph plotted between vapour pressure (V.P.) and temperature (T),
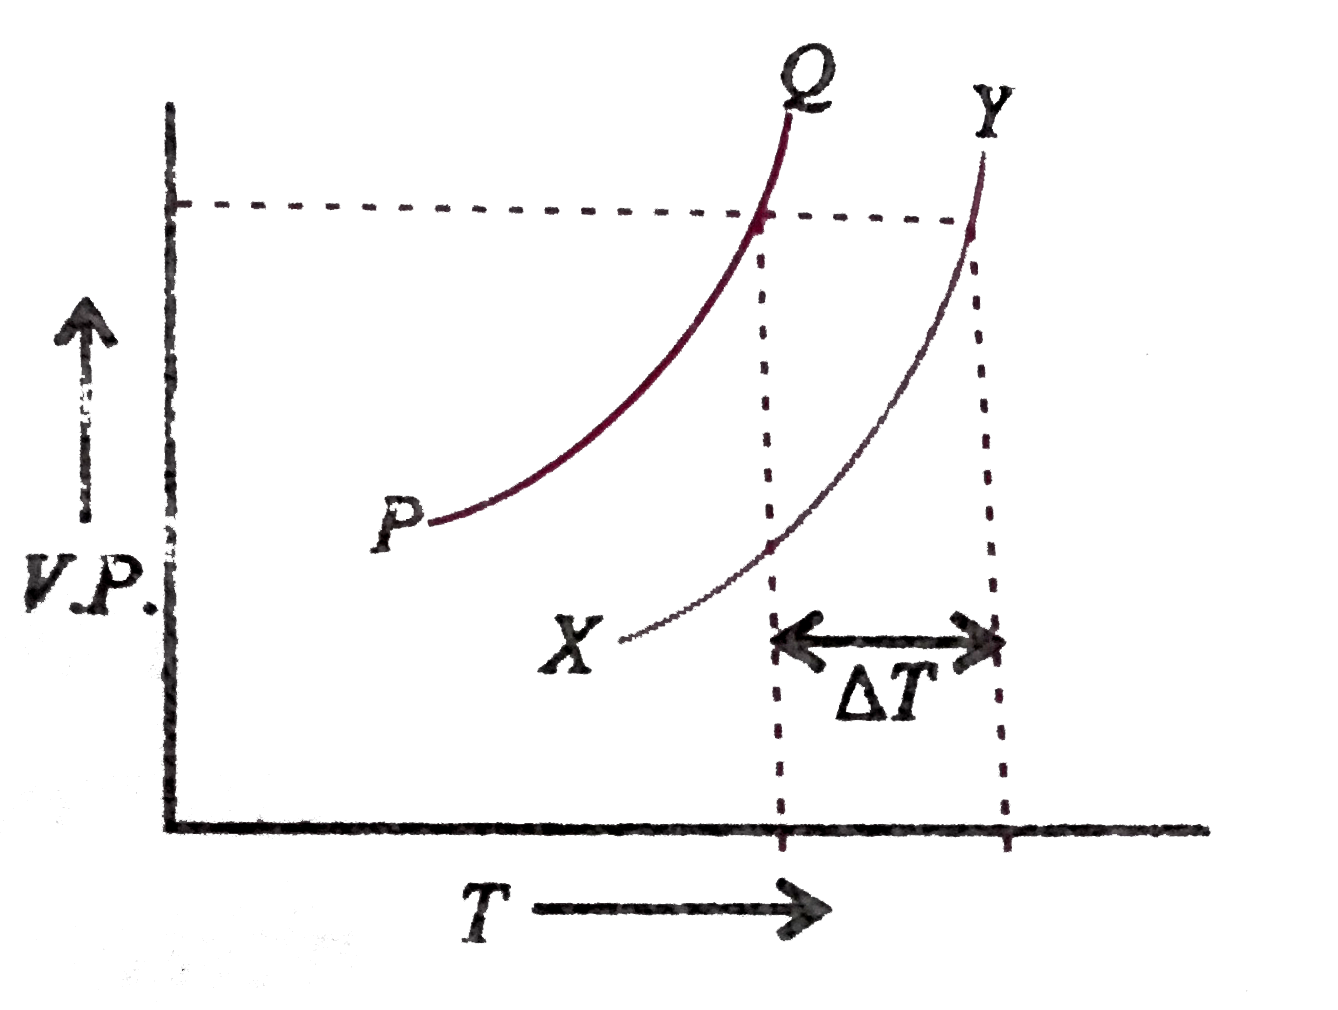
PQ is the curve for solvent , XY is the curve of solution and ΔT is depression in freezing point
PQ is the curve for solution. XY is the curve for solvent and ΔT is elevation is boiling point
PQ is the curve for solvent, XY is the curve for solution and ΔT is molal elevation in boiling point
PQ is the curve for solvent, XY is the curve for solution and ΔT is elevation in boiling point
The correct Answer is:D
PQ corresponds to increase in vapour pressure of solvent with temperature and XY corresponds to increase in vapour pressure of solution with temperature . ΔT is the elevation in boiling point of a solution.
Topper's Solved these Questions
- BOOK - NCERT FINGERTPS ENGLISHCHAPTER - SOLUTIONS EXERCISE - Abnormal Molar Masses16videos
SOLUTIONS
- BOOK - NCERT FINGERTPS ENGLISHCHAPTER - SOLUTIONS EXERCISE - Higher Order Thinking Skills10videos
SOLUTIONS
- BOOK - NCERT FINGERTPS ENGLISHCHAPTER - SOLUTIONS EXERCISE - Ideal And Non-Ideal Solutions13videos
SOLUTIONS
- BOOK - NCERT FINGERTPS ENGLISHCHAPTER - PRACTICE PAPER -3EXERCISE - Practice Paper 350videos
PRACTICE PAPER -3
- BOOK - NCERT FINGERTPS ENGLISHCHAPTER - SURFACE CHEMISTRYEXERCISE - Assertion And Reason15videos
SURFACE CHEMISTRY
Similar Questions
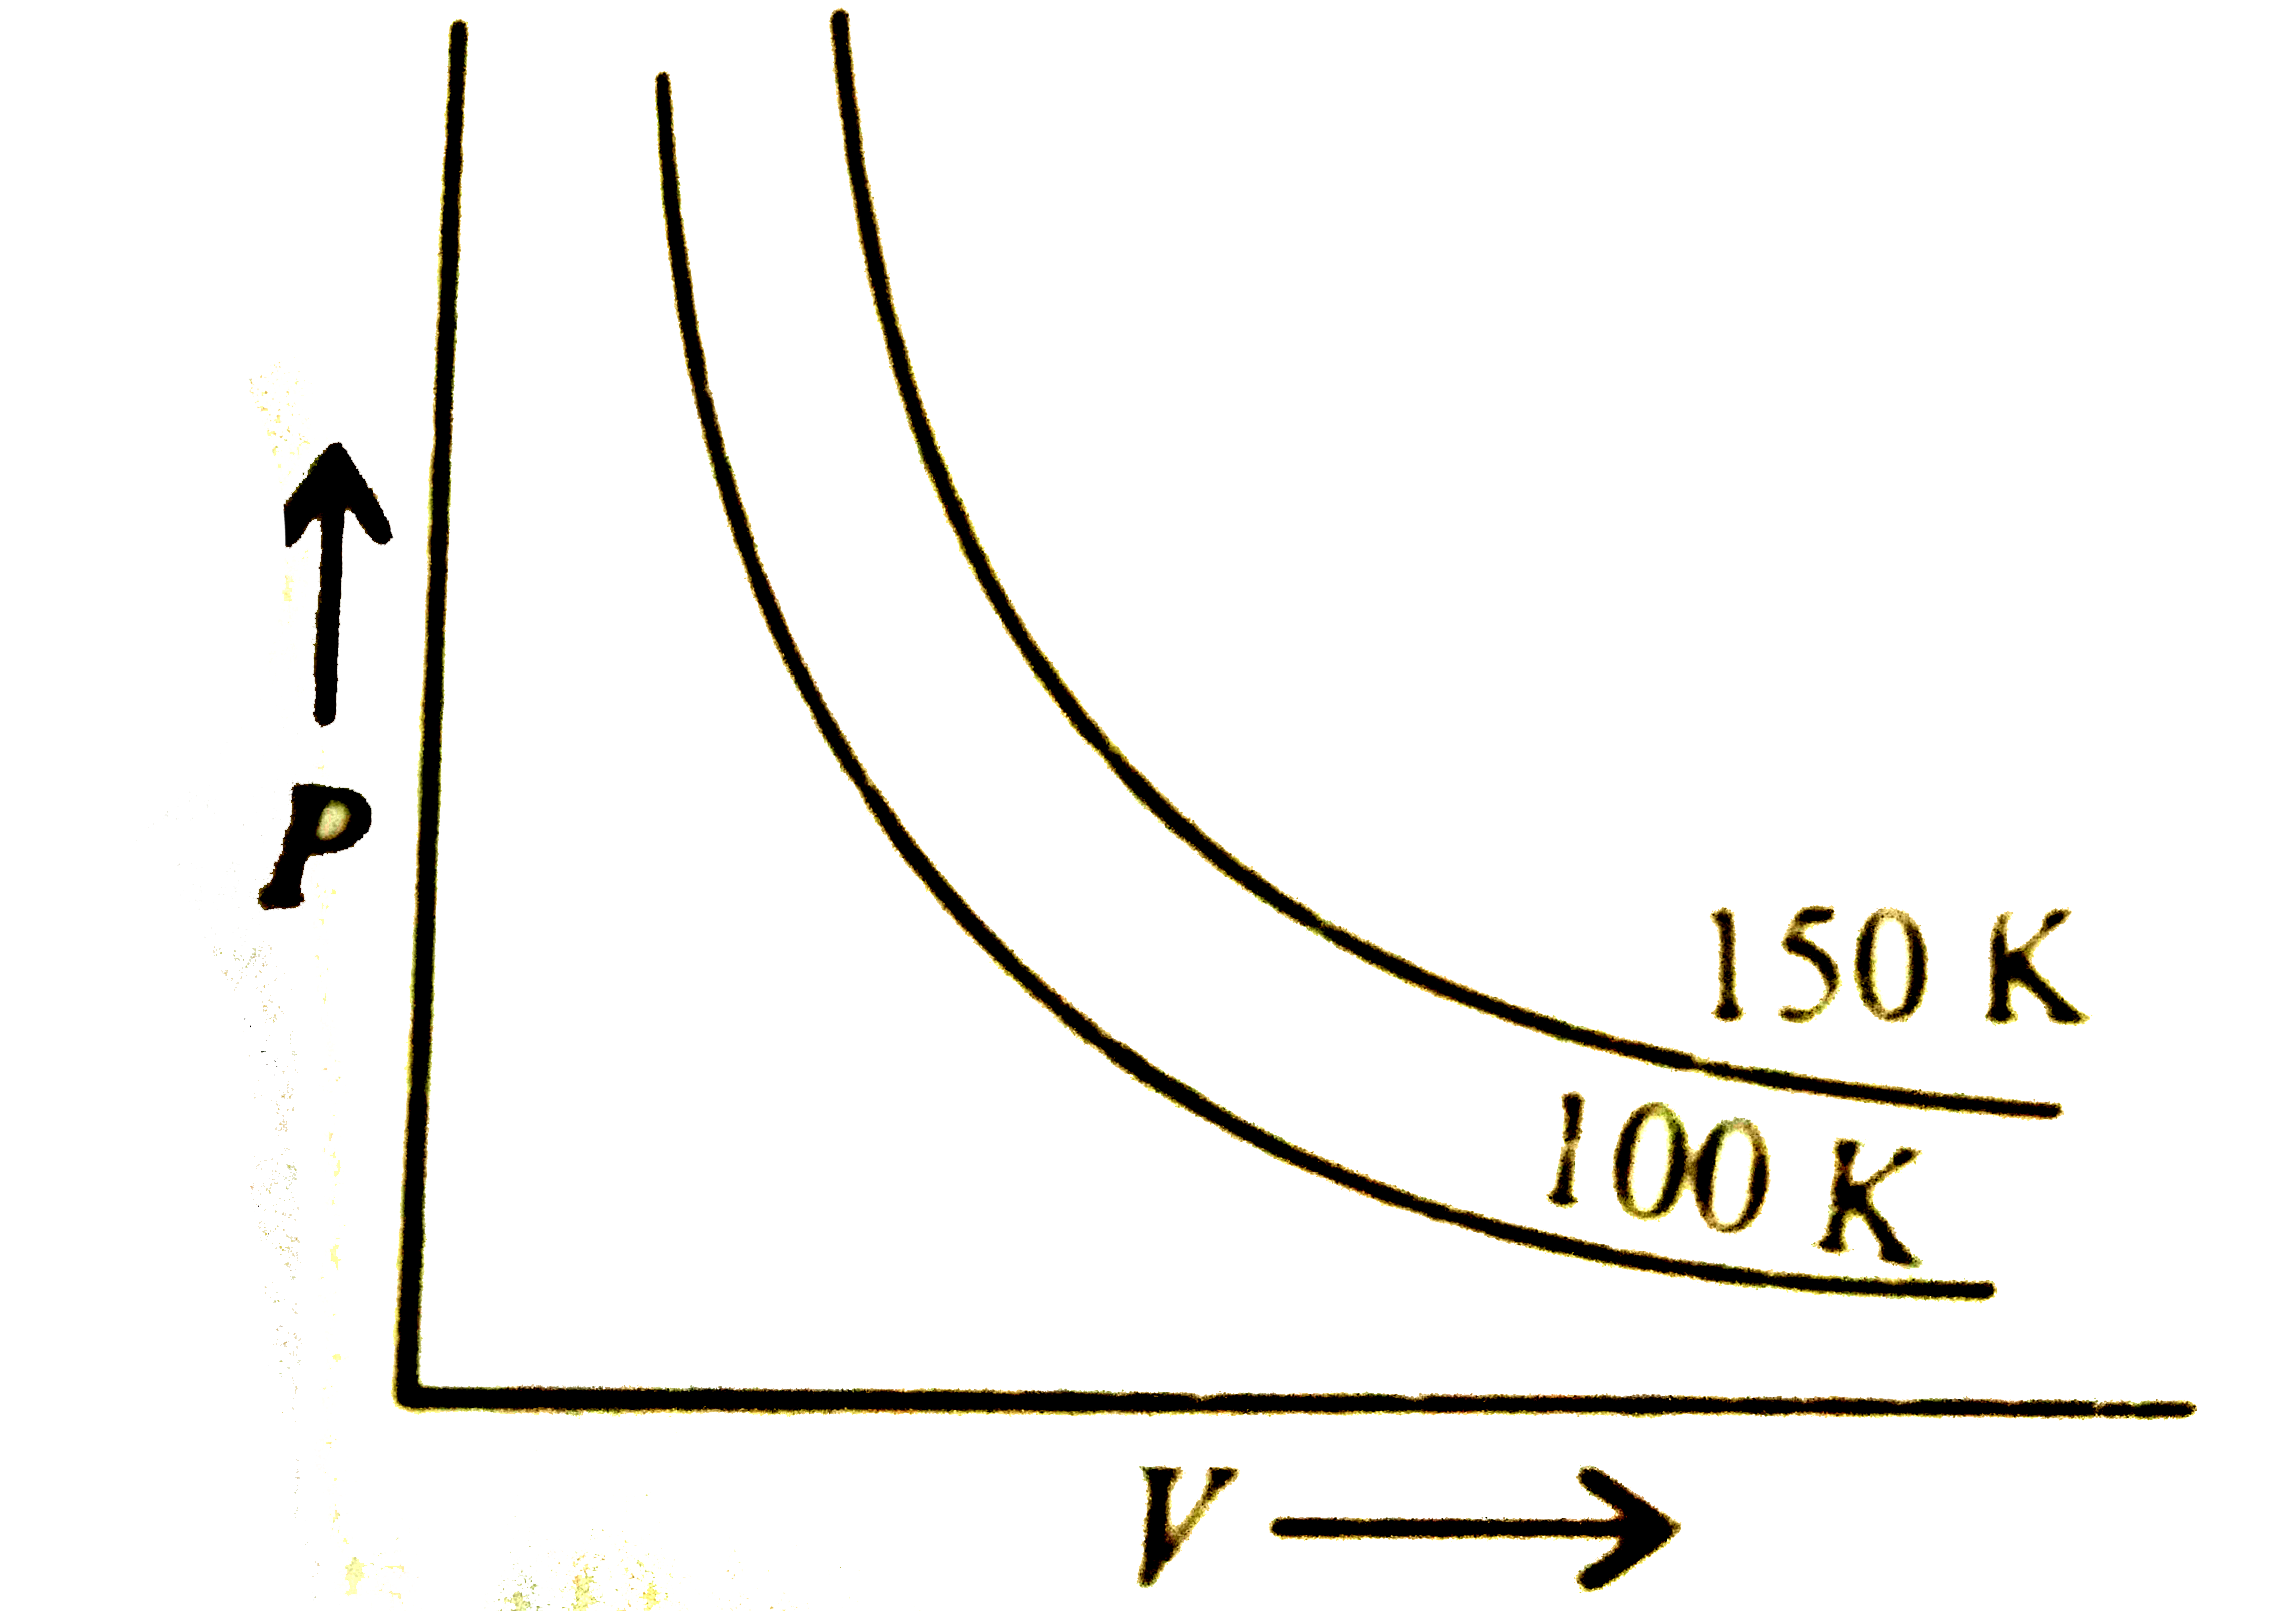
A graph is plotted between pressure and volume at different temperatures . On the basis of the graph what changes will you observe in the volume if
(i) the pressure is increased at constant temperature .
(ii) the temperature is decreased at constant pressure .
 View Solution
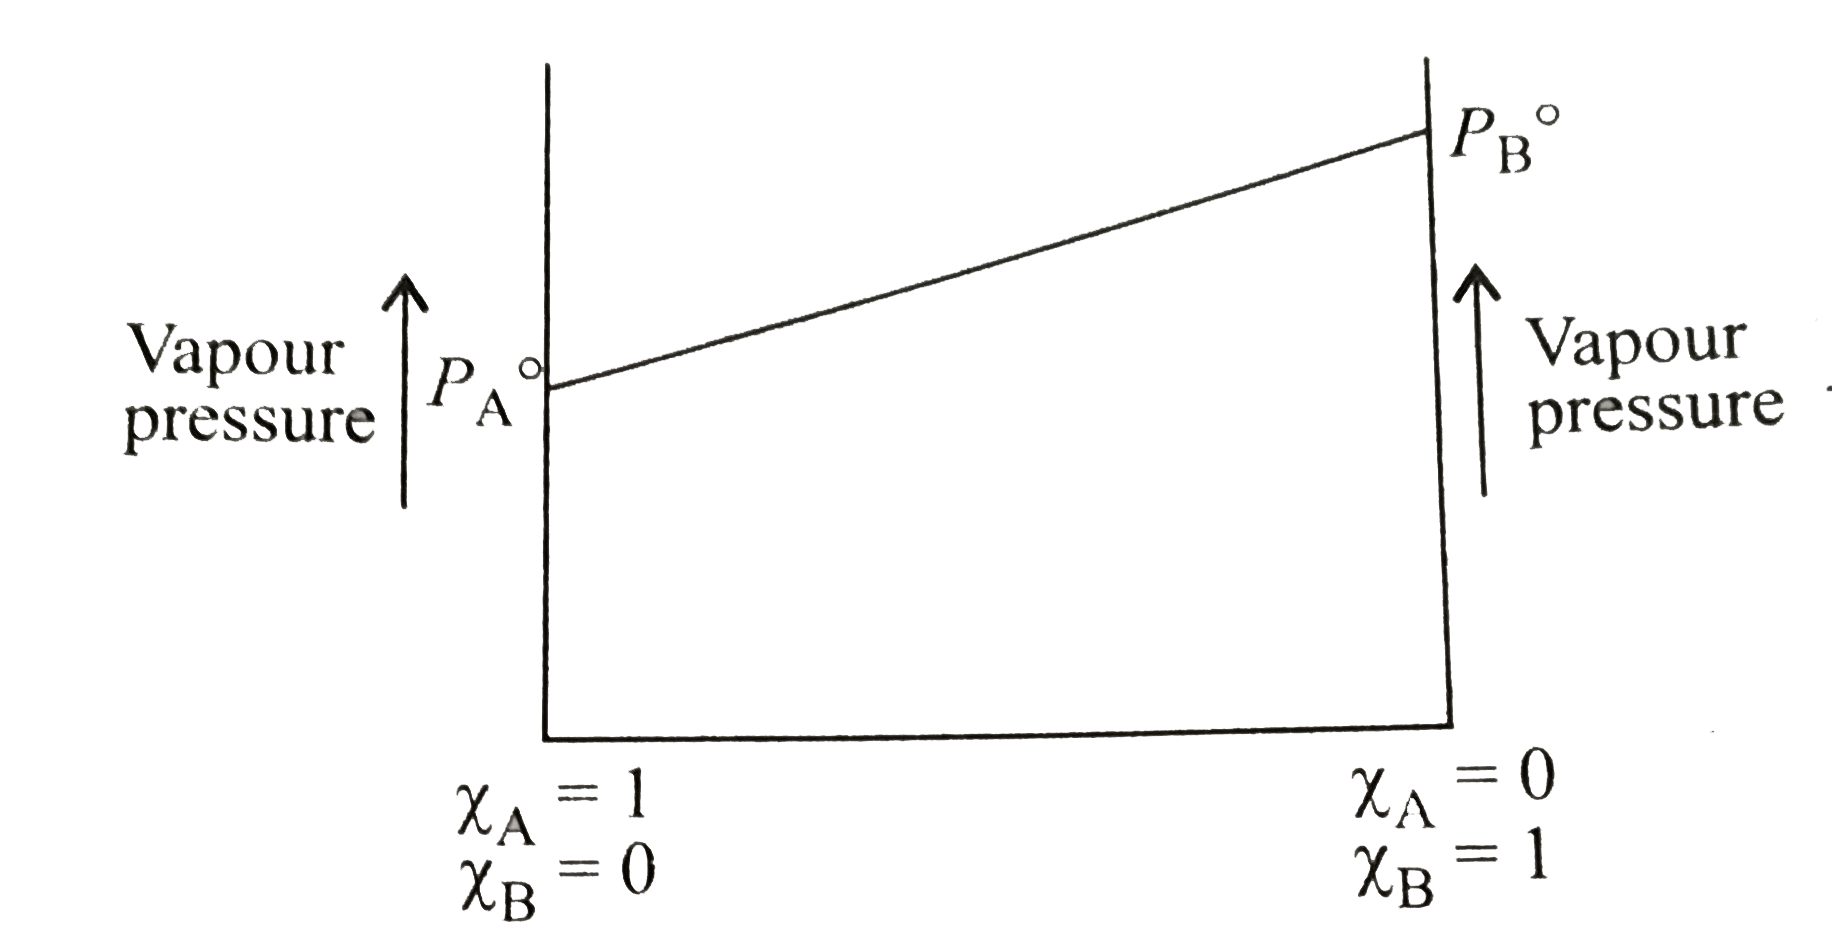
The following is a graph plotted between the vapour pressure of two volatile liquids against their respective mole fractions. Which of the following statements is/are correct?
 View Solution
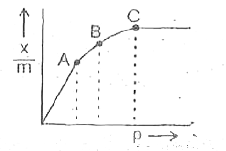
The graph plotted against adsorption versus pressure P at constant temperature, the Freundich equation at A, B, C respectively are (if n > 1)
 View Solution
A graph between vapour pressure and temperature of few liquids is given below . Study the graph and answer the following :
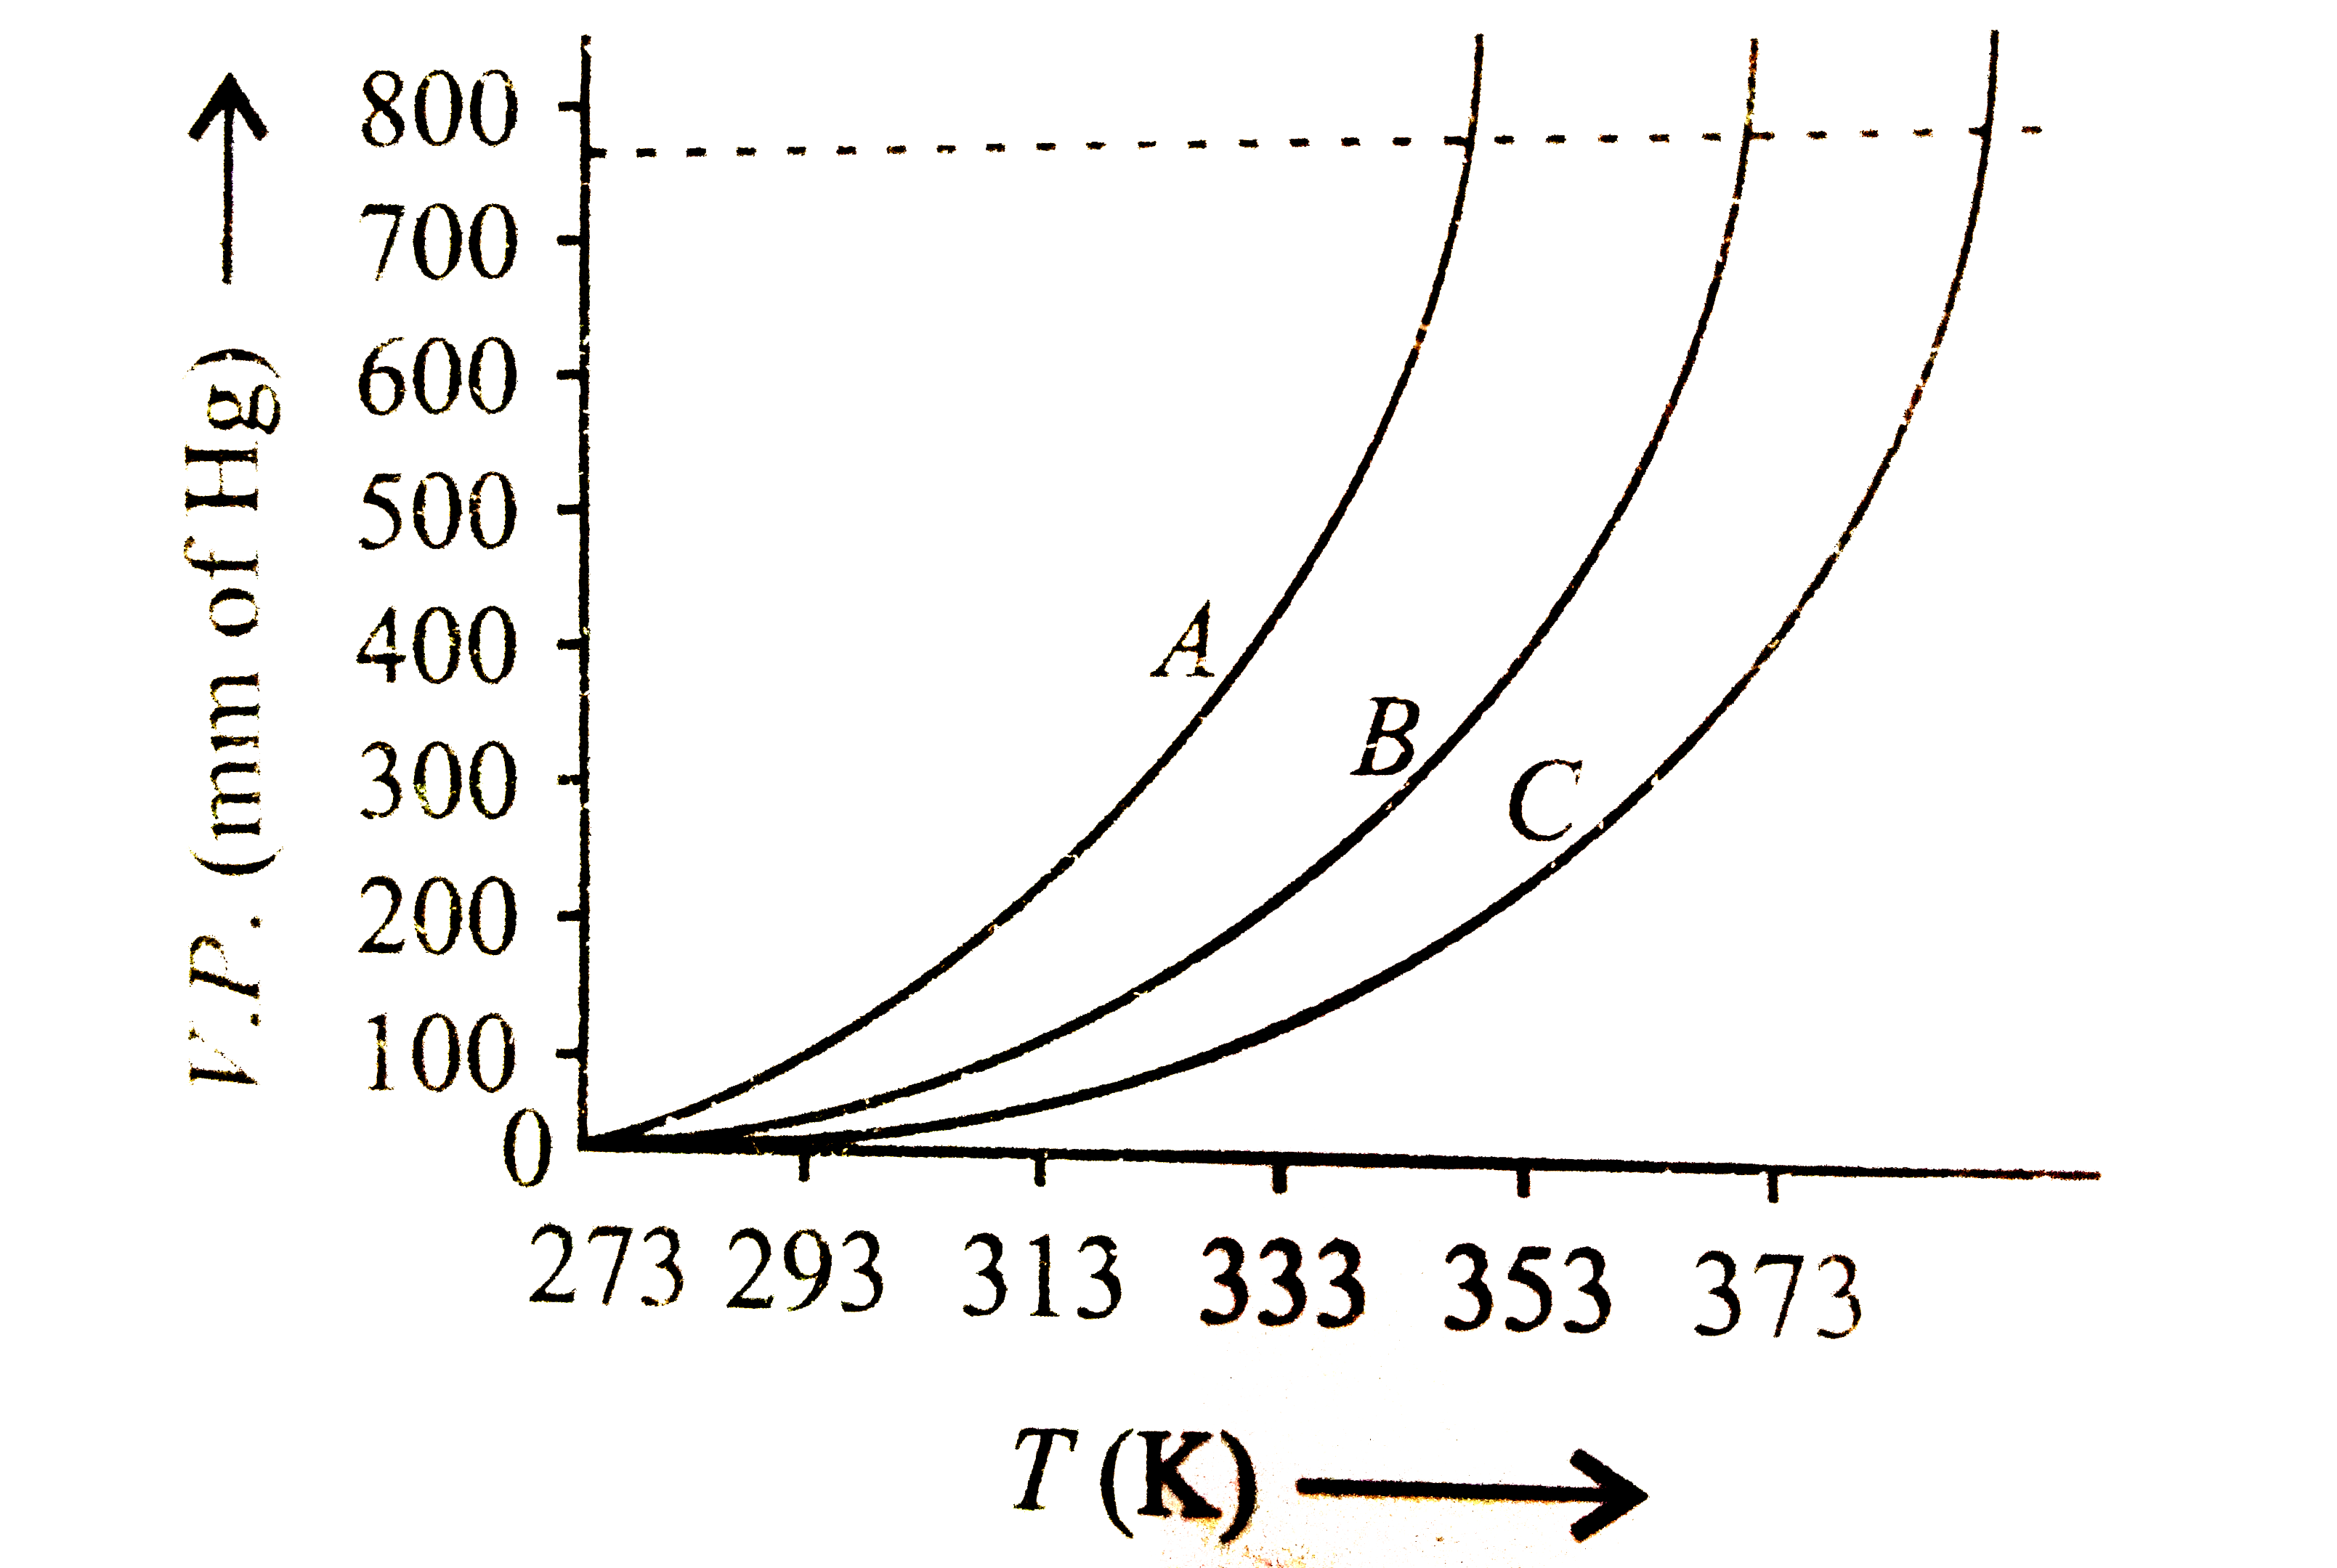
Which of the following statements is true ?View SolutionThe behaviour of ideal gas is goverened by various gas laws which are described by mathematical statements as given below:
(i) PV=k (constant) at constant n and T
(ii) V/T=k2 (constant) at constant n and P
(iii) V/n=k3 (constant) at constant T and P
(iv) PV=nRT
(v) P/T=k4 (constant) at constant n and V
Answer the following
If we plot a graph between volume (L) and temperature (−273.15∘C) by studying their variation for 2.0g of certain ideal gas at 1¯ pressure, the graph obtained is a straight line which isView SolutionThe given graph shows the vapour pressure - temperature curves for some liquids
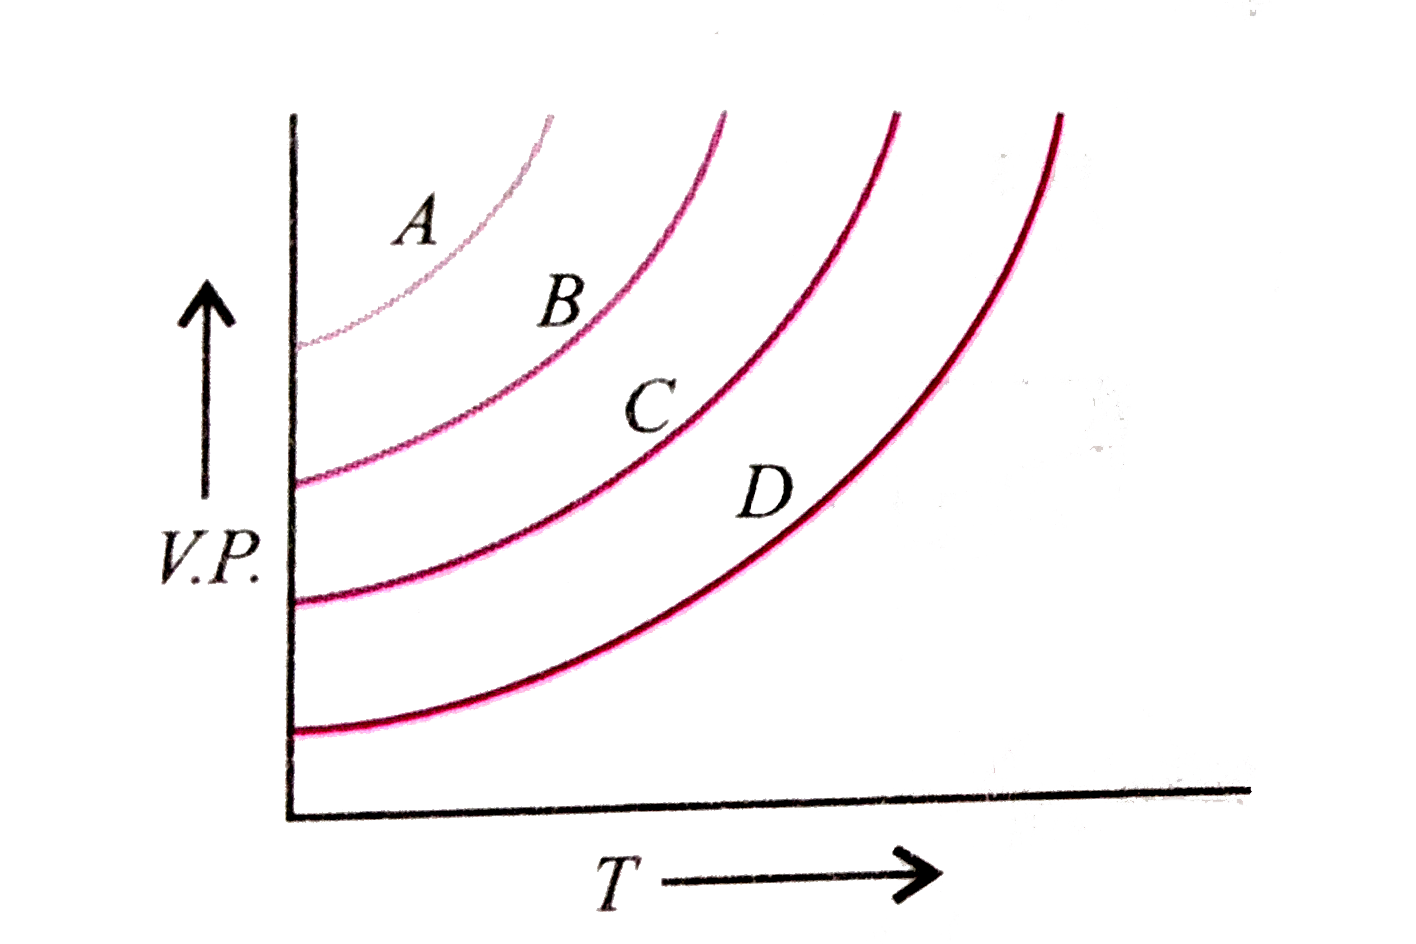
Liquids A,B, C and D respectively areView SolutionAssertion: The plot of volume (V) versus pressure (P) at constant temperature is a hyperbola in the first quadrant.
Reason: V∝1/P at constant temperature.View SolutionThe slope of the plot between pV and p at constant temperature is
View SolutionIf a graph is plotted between velocity (v) and displacement (y) of a particle executing SHM from mean position, then the nature of the graph is
View SolutionBoyle's temperature or Boyle point is the temperature at which a real gas starts behaving like an ideal gas over a particular range of pressure. A graph is plotted between compressibility factor Z and pressure P.
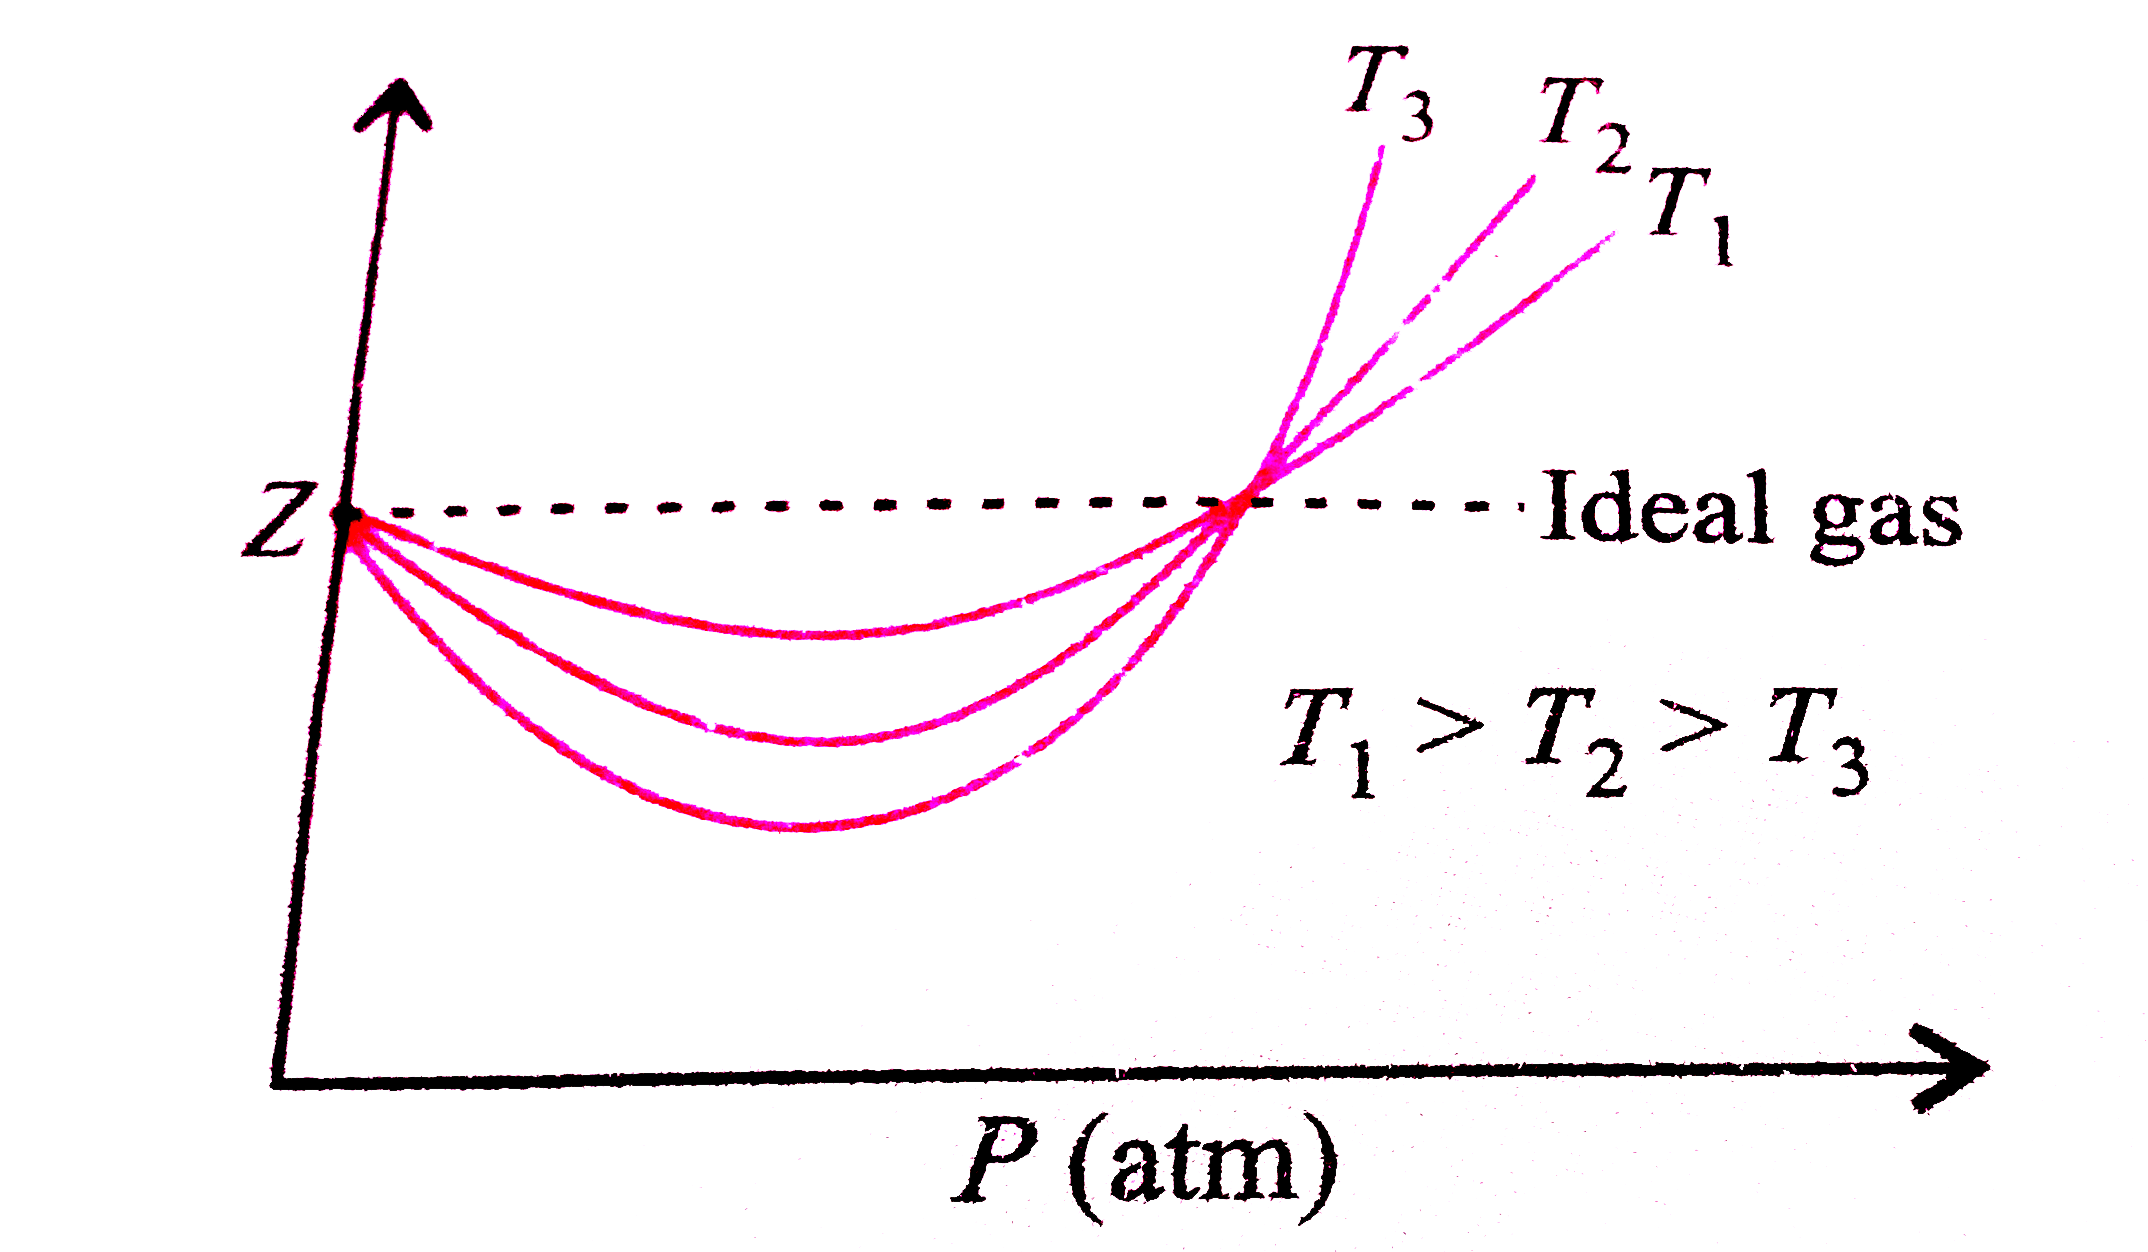
What is the deviation of real gas from ideal behaviour in terms of compressibility factor , Z ?View Solution

