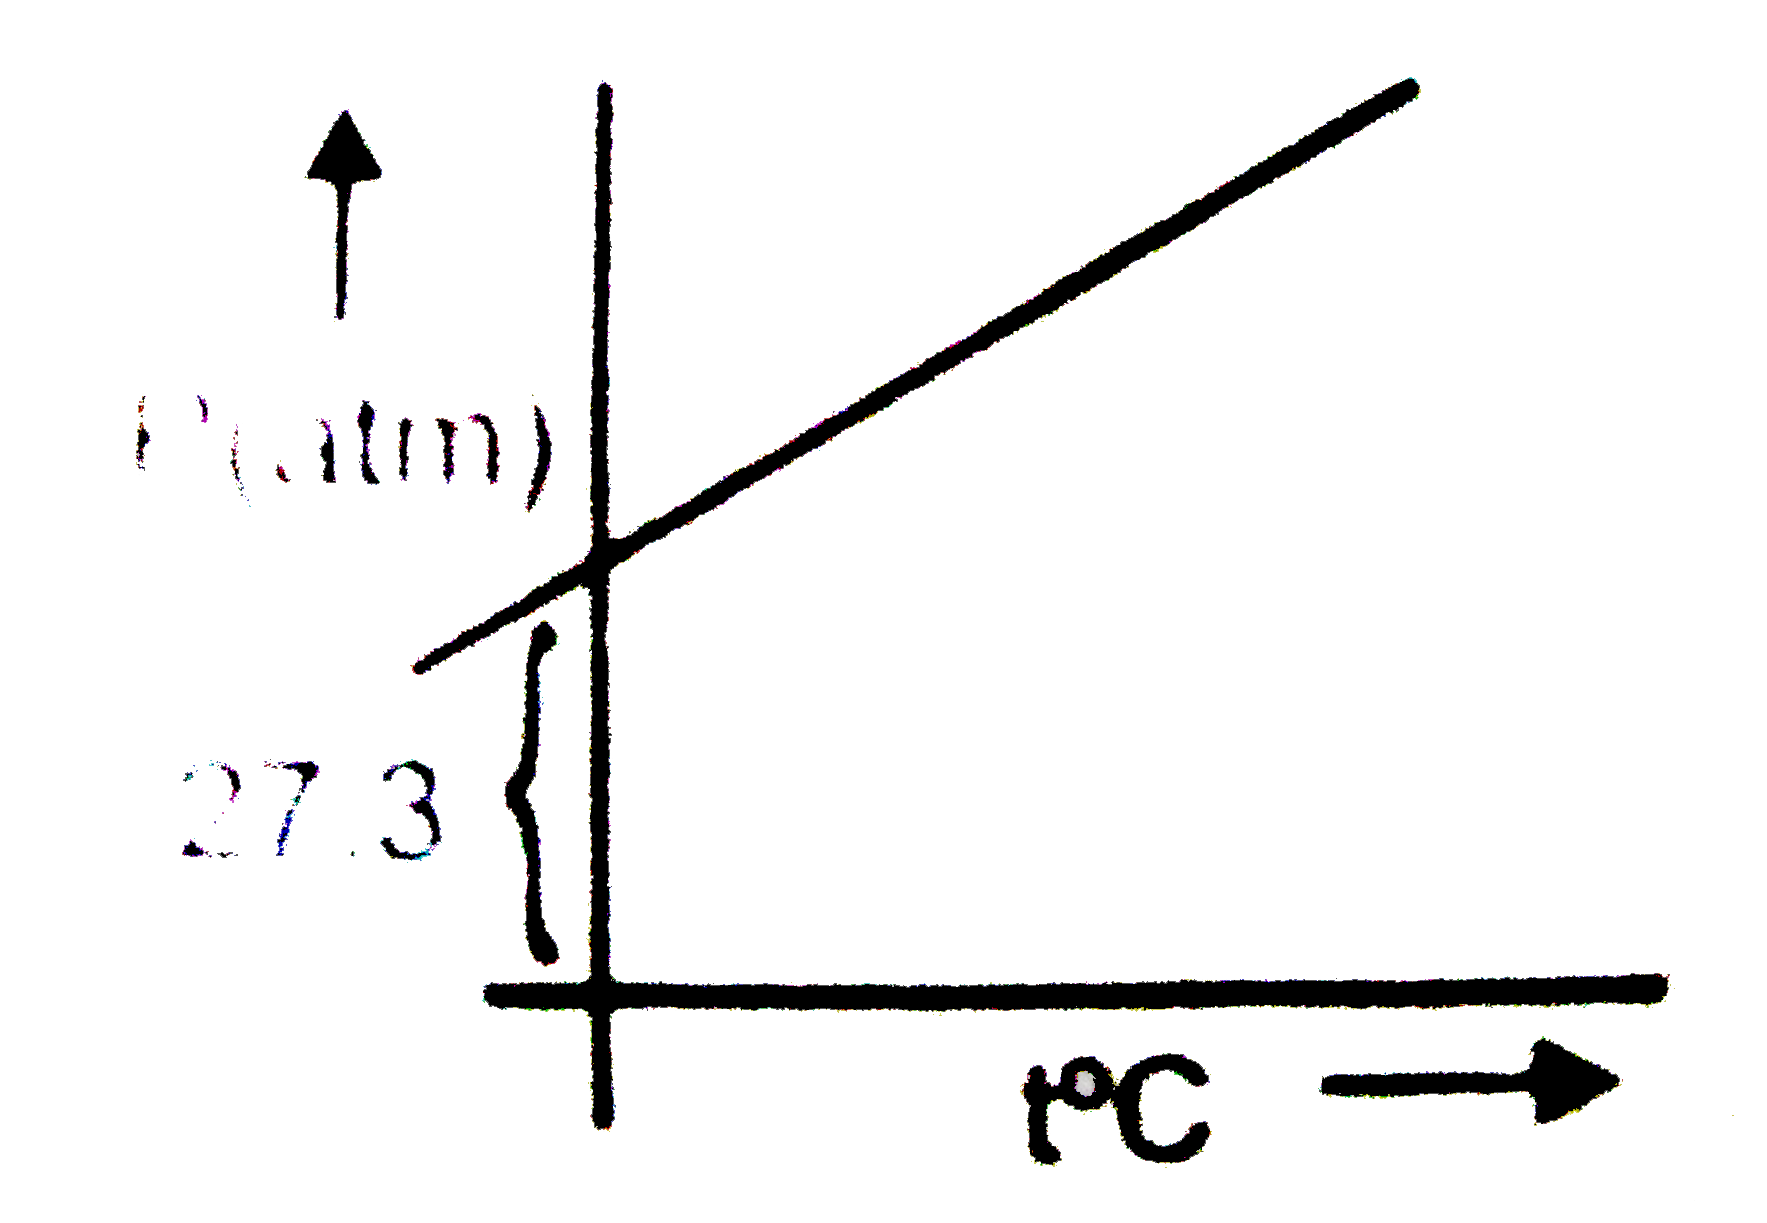
A graph is plotted between p (atm) vs t∘C for 10 mol of an ideal gas as follows:
Then slope of curve and volume of container (L) respectively, are:

0.1,8.21
8.21,0.1
27.3,8.21
8.21,27.3
The correct Answer is:a
Step by step video & image solution for A graph is plotted between p (atm) vs t^(@)C for 10 mol of an ideal gas as follows: Then slope of curve and volume of container (L) respectively, are: by Chemistry experts to help you in doubts & scoring excellent marks in Class 11 exams.
Updated on:21/07/2023Topper's Solved these Questions
- GASEOUS STATEBOOK - NARENDRA AWASTHI ENGLISHCHAPTER - GASEOUS STATEEXERCISE - Level 3 Passage 1
4 Videos
- GASEOUS STATEBOOK - NARENDRA AWASTHI ENGLISHCHAPTER - GASEOUS STATEEXERCISE - Level 3 Passage 2
6 Videos
- GASEOUS STATEBOOK - NARENDRA AWASTHI ENGLISHCHAPTER - GASEOUS STATEEXERCISE - Subjective problems
15 Videos
- ELECTROCHEMISTRYBOOK - NARENDRA AWASTHI ENGLISHCHAPTER - ELECTROCHEMISTRYEXERCISE - Subjective problems
14 Videos
- IONIC EEQUILIBRIUMBOOK - NARENDRA AWASTHI ENGLISHCHAPTER - IONIC EEQUILIBRIUMEXERCISE - Subjective problems
1 Videos
Similar Questions
Knowledge Check
If a graph is plotted between T2andr3 for a planet, then its slope will be be (where MS is the mass of the sun)
A4π2GMSBGMS4πC4πGMSDGMS
A graph is plotted between logV and logT for 2mol of gas at constant pressure of 0.0821atm. V and T are in litre and K. Which of the following statements are not correct?
(I) The curve is straight line with slope −1.
(II) The curve is straight line with slope +1.
(III) The intercepet on Y−axis is equal to 2.
(IV) The intercepet on Y−axis is equal to 0.3010.
View SolutionFor a fixed amount of real gas when a graph of zv/s p was plotted than at very high pressure slope was observed to be 0.01atm−1. At the same temperature if a graph is plotted b//w pv v//s P then for 2 moles of the gas 'Y' intercept is found to be 40 atm-litre. calculate excluded volume in litres for 20 moles of the real gas.
View SolutionThe intercept on y-axis and slope of curve plotted between P/T vs. T
( For an ideal gas having 10 moles in a closed rigid container of volume 8.21 L. (P= Pressure in atm and T = Temp. in K, log102=0.30)) are respectively :
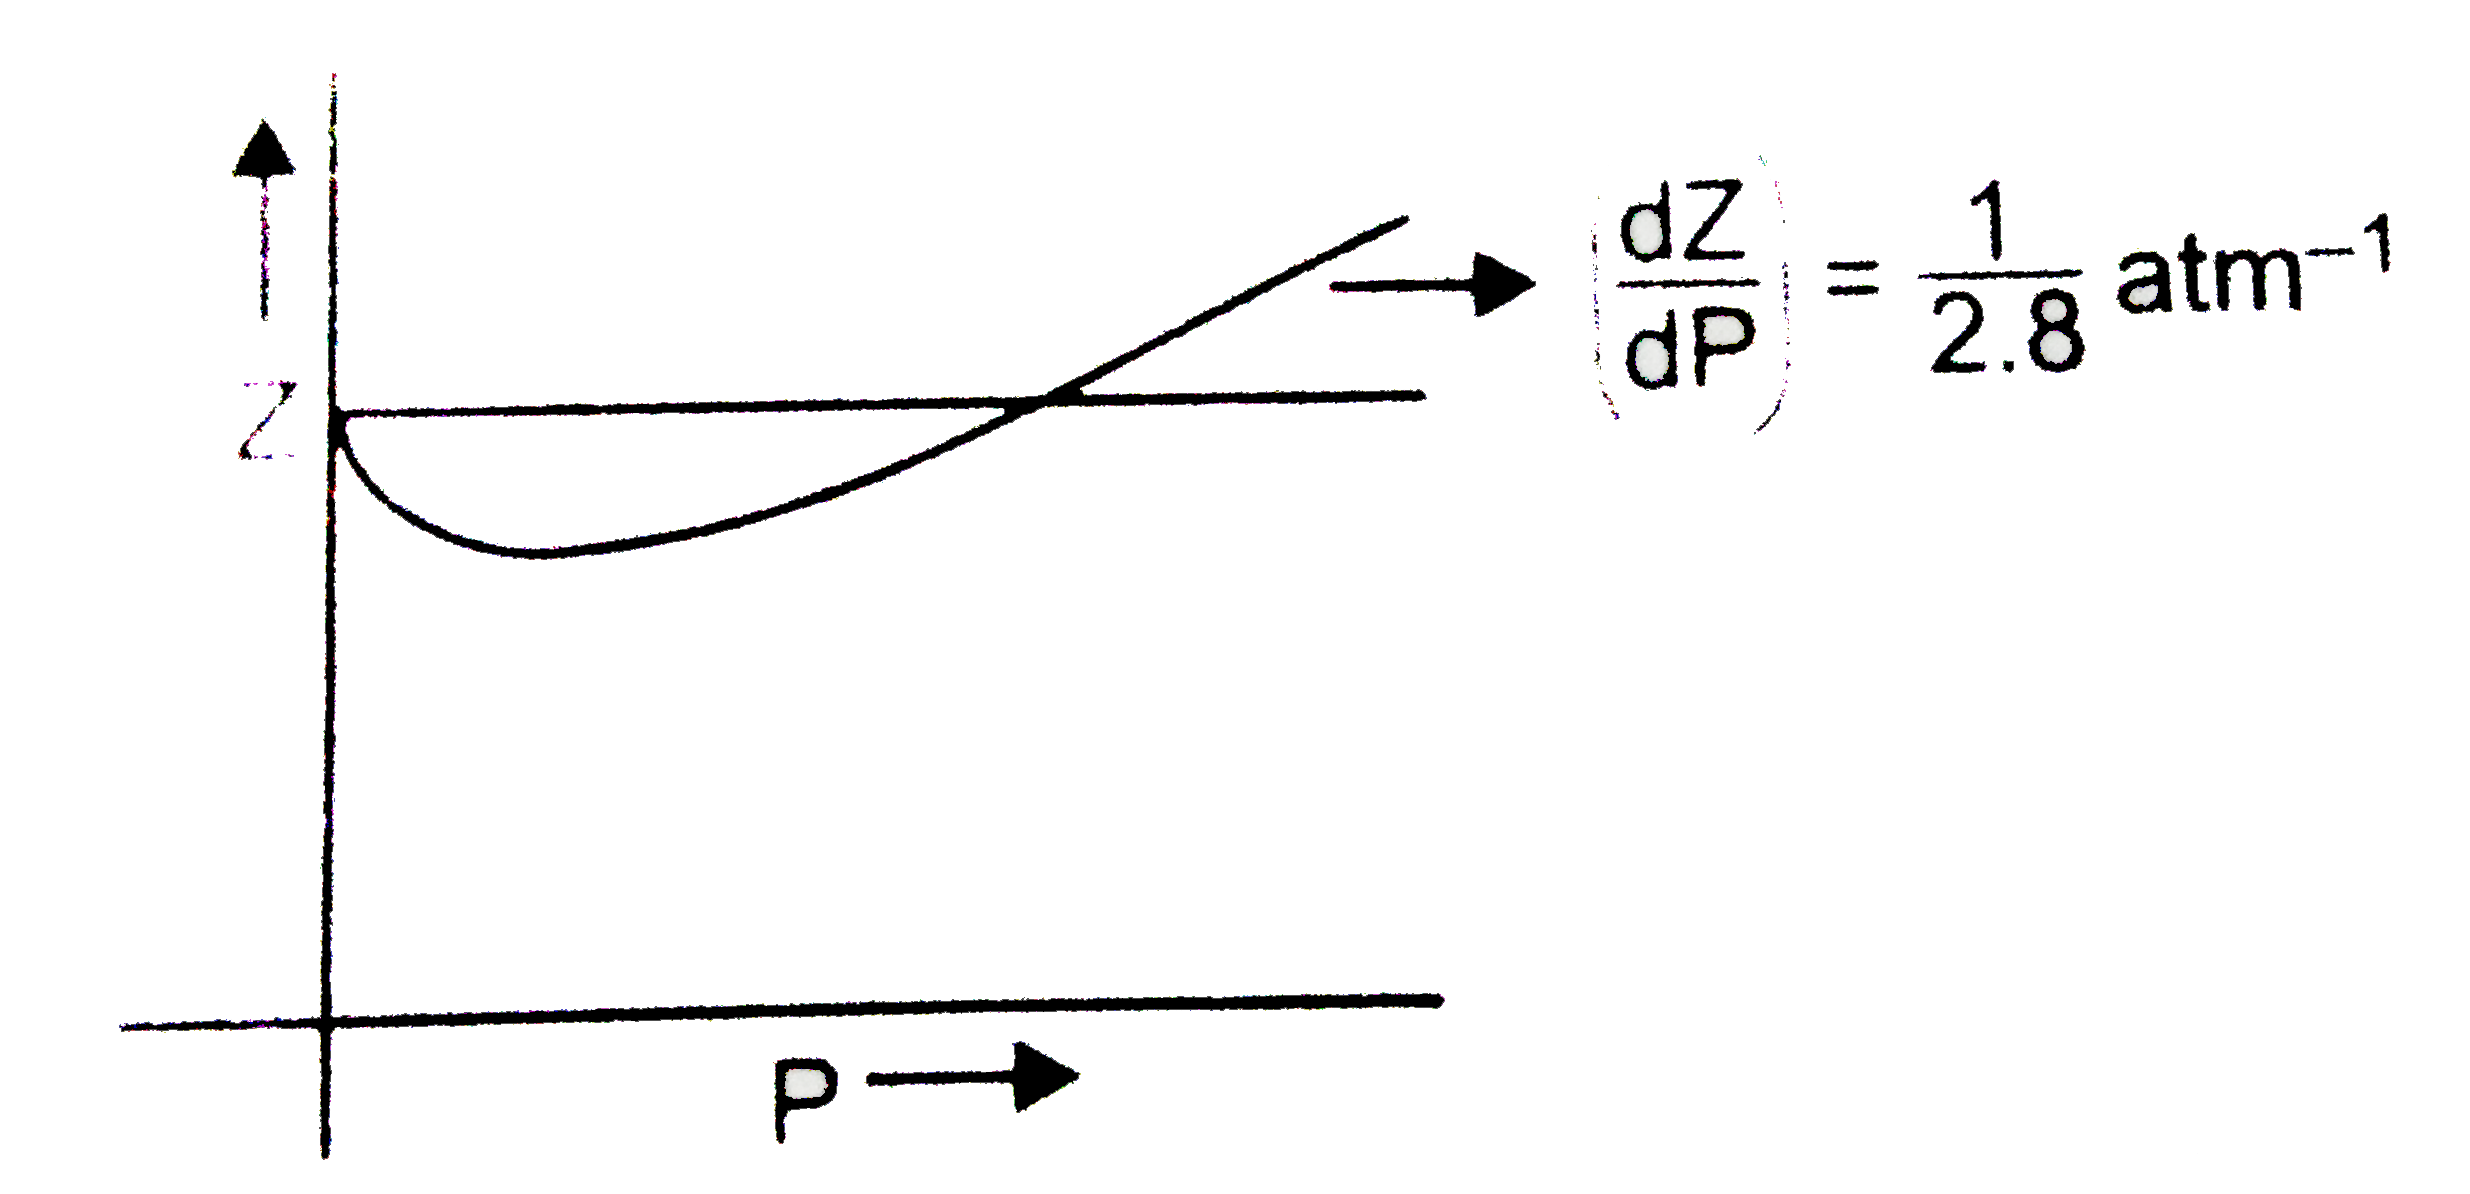
View SolutionThe graph of compressibility factor (Z) vs. P for one mole of a real gas is shown in following diagram. The graph is plotted at constant temperature 273K. If the slope of graph at very high pressure (dZdP) is (12.8)atm−1 , then calculate volume of one mole of real gas molecules (in L/mol)
Given : NA=6×10²³ and R=22.4273LatmK−1mol−1

View Solution10 litre of a non linear polyatomic ideal gas at 127∘C and 2 atm pressure is suddenly released to 1 atm pressure and the gas expanded adiabatically against constant external pressure. The final temperature and volume of the gas respectively are.
(a)T=350K,V = 17.5L
(b)T = 300 K ,V = 15 L
(c) T = 250 K, V = 12.5 L
(d)None of these
View SolutionOn the P−T graph of an ideal gas, choose the correct option(s):
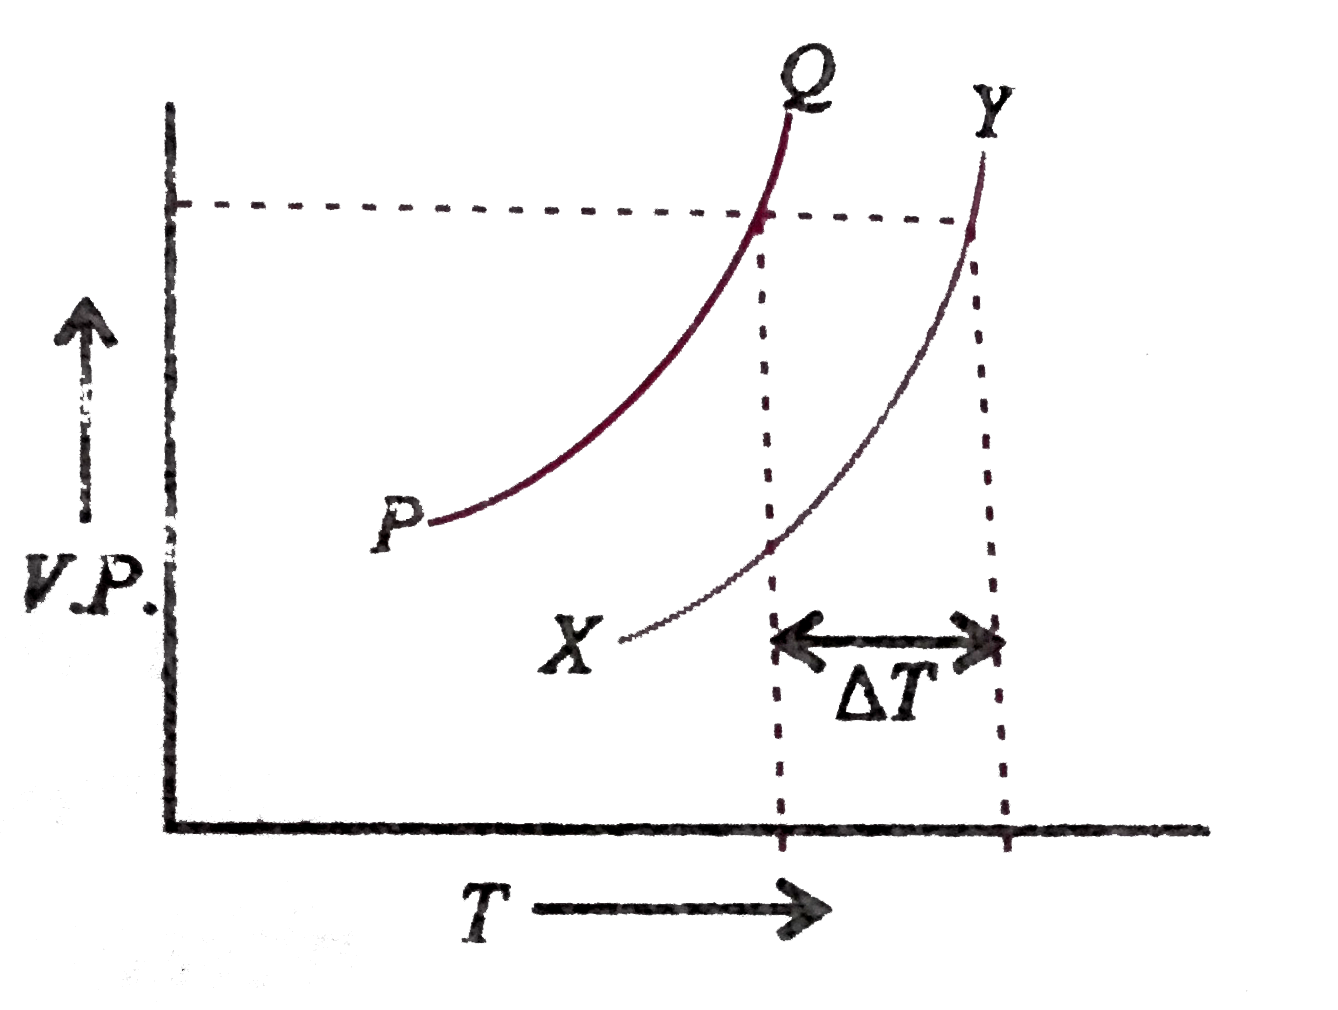
View SolutionIn the graph plotted between vapour pressure (V.P.) and temperature (T),

View Solution
