In the circuit shown in the figure, a voltage is applied between points A and B which changes with time as
V0=kt for 0≤t≤t0
=kt0 for t>t0
Plot the variation of potential difference (V) between C and D as a function of time
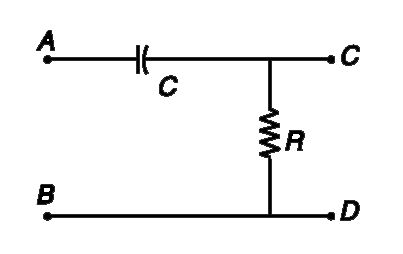
The correct Answer is:(##IJAPHYV02C08E01105_A01##)
Step by step video, text & image solution for In the circuit shown in the figure, a voltage is applied between points A and B which changes with time as V_(0)=kt for 0 le t le t_(0) =kt_(0) for t gt t_(0) Plot the variation of potential difference (V) between C and D as a function of time by Physics experts to help you in doubts & scoring excellent marks in Class 12 exams.
Topper's Solved these Questions
Similar Questions
In the circuit as shown,the charge varies with time t as q=t3−4 ,where q is in coulombs and t is in seconds.Where at t=2, the potential difference between A and B,VA−VB in volts is
View SolutionIn the circuit shown, switch S is closed at time t=0. Find the current through the inductor as a function of time t.
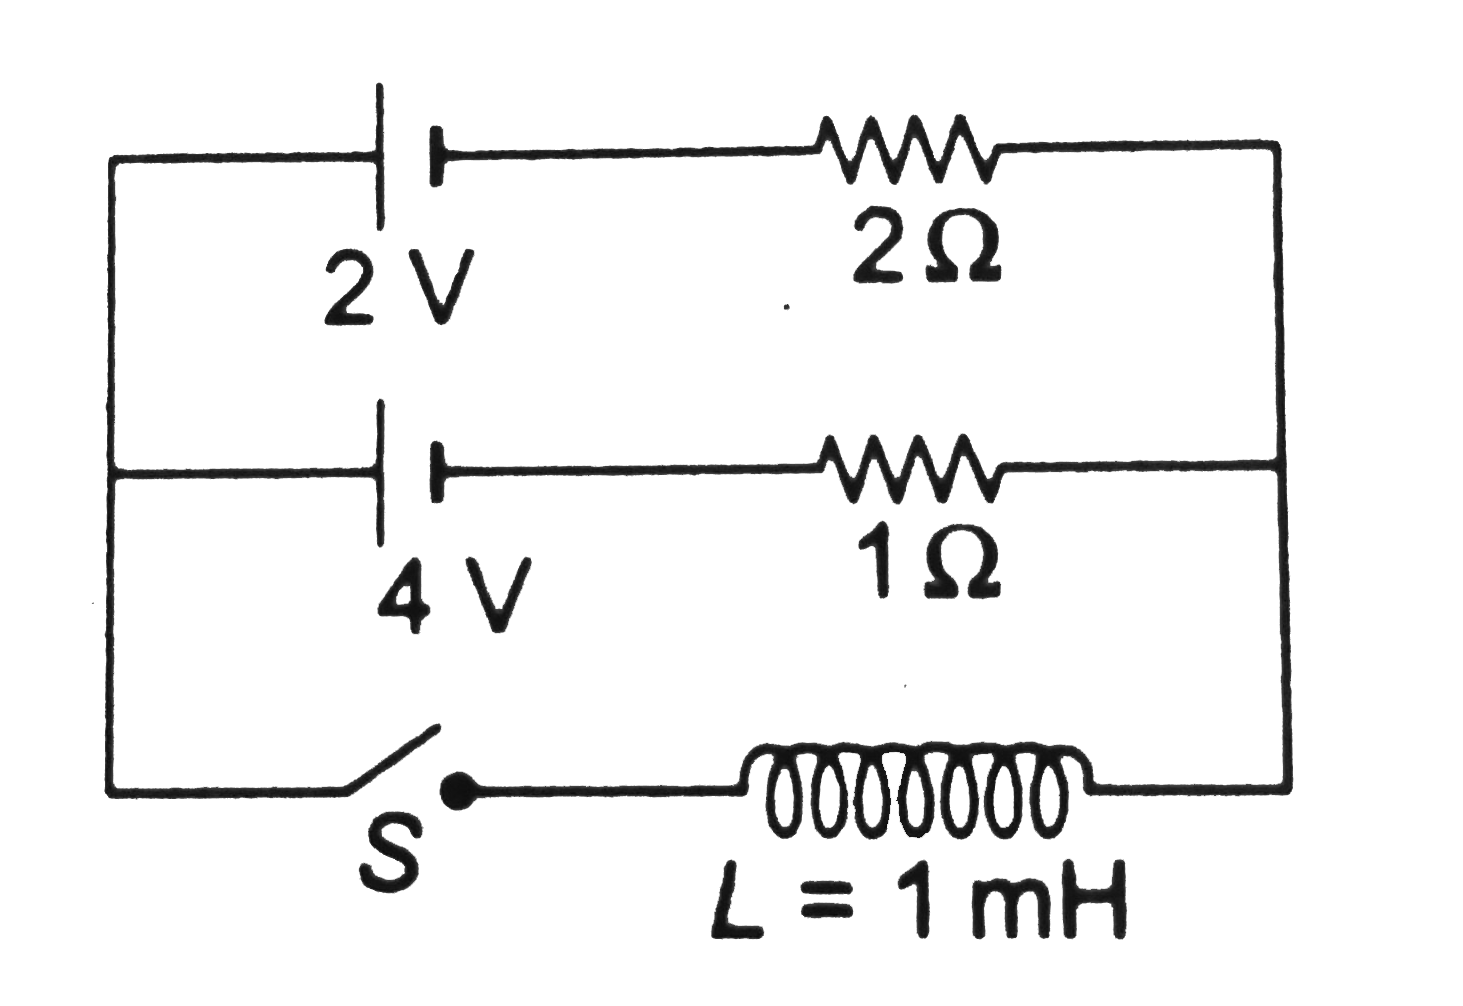 View Solution
Knowledge Check
- Question 1 - Select One or More
In the circuit shown in figure, circuit is closed at time t=0. At time t=ln(2) second
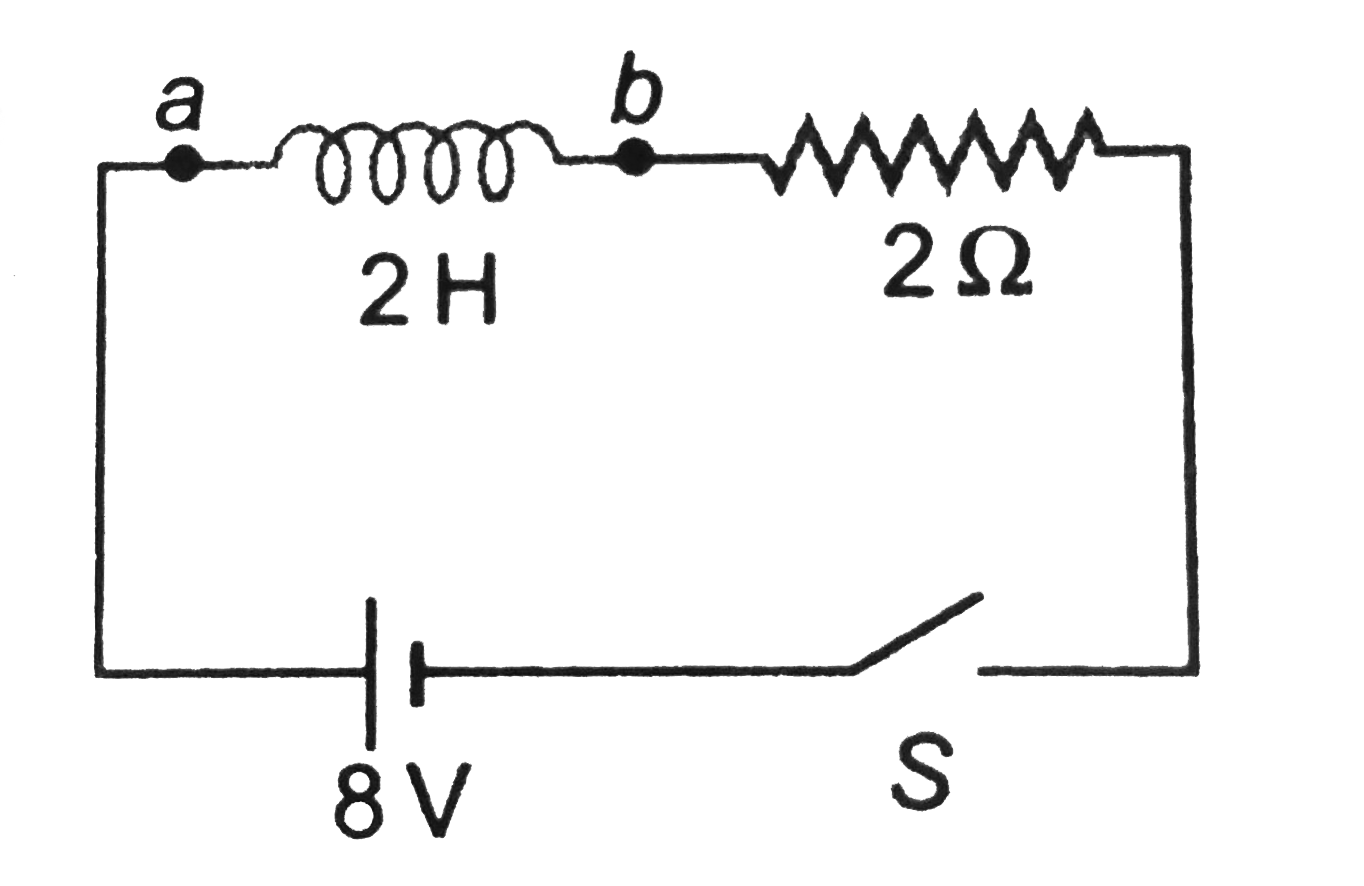 Arate of energy supplied by the battery is 16 J/sBrate of heat dissipated across resistance is 8J/sCrate of heat dissipated across resistance is 16 J/sDVa−Vb=4V
 - Question 2 - Select One
In the circuit shown in figure switch S is closed at time t=0
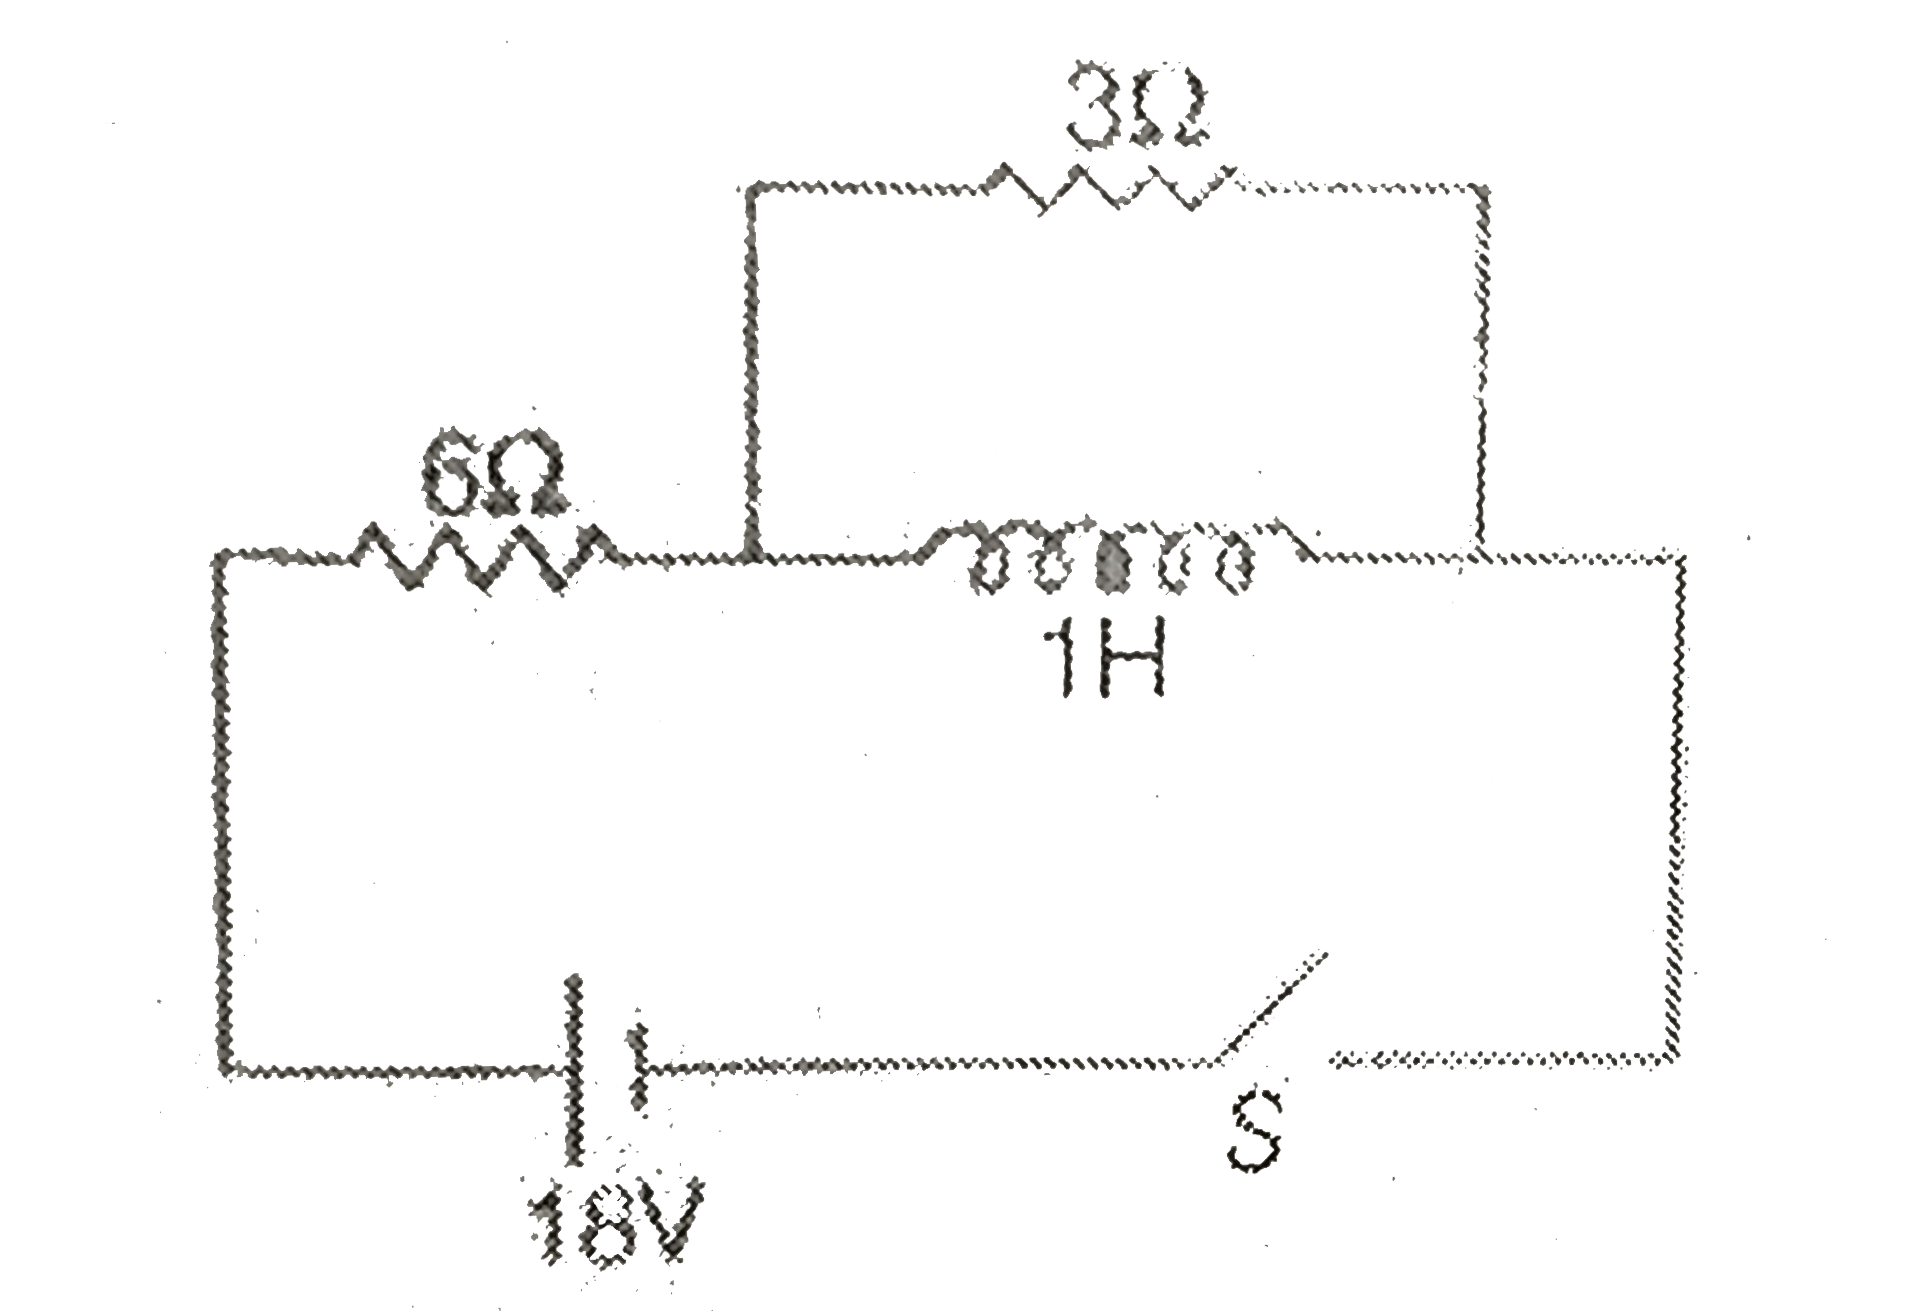
Current I from the battery at time t is given byA3(1−e−2t)B3+e−2t)C3(1-e^(-t/9))D3−e−2t - Question 3 - Select One
In the circuit shown in figure, if the A diode forward voltage drop is 0.3 V, the voltage difference between A and B is
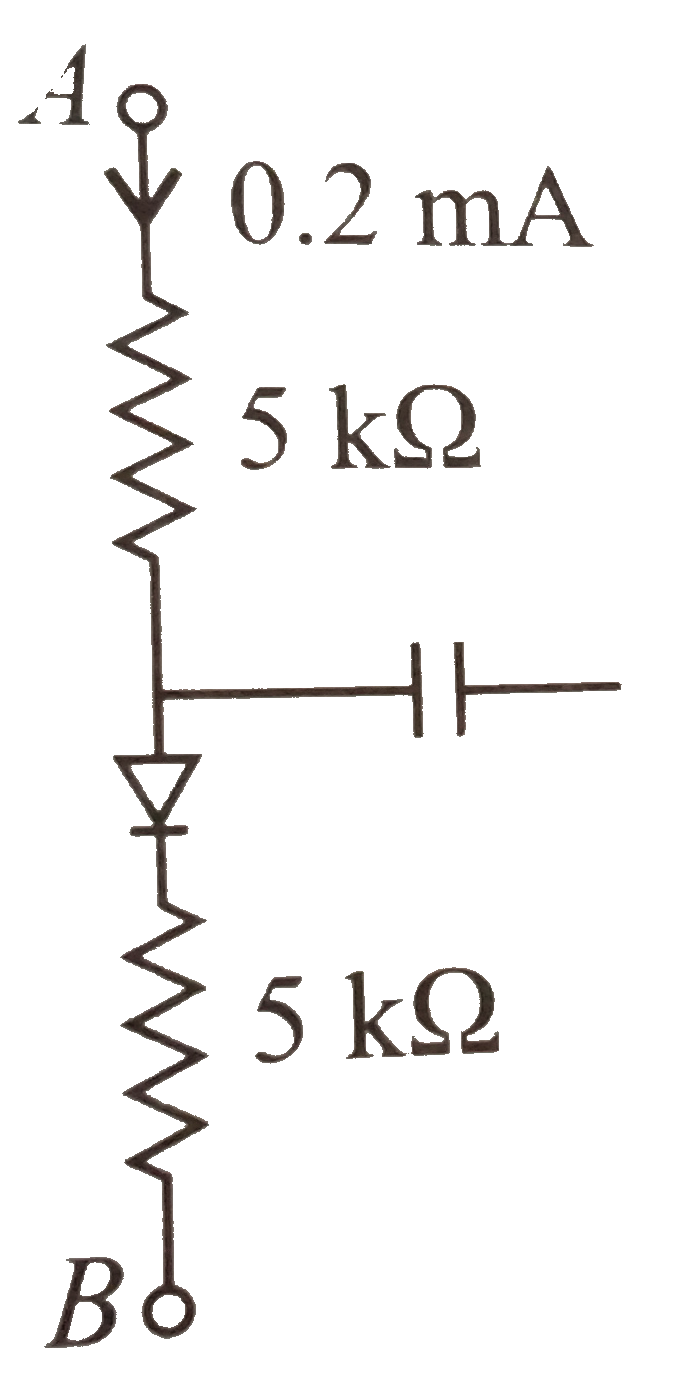 A1.3 VB2.3 VC0D0.5 V
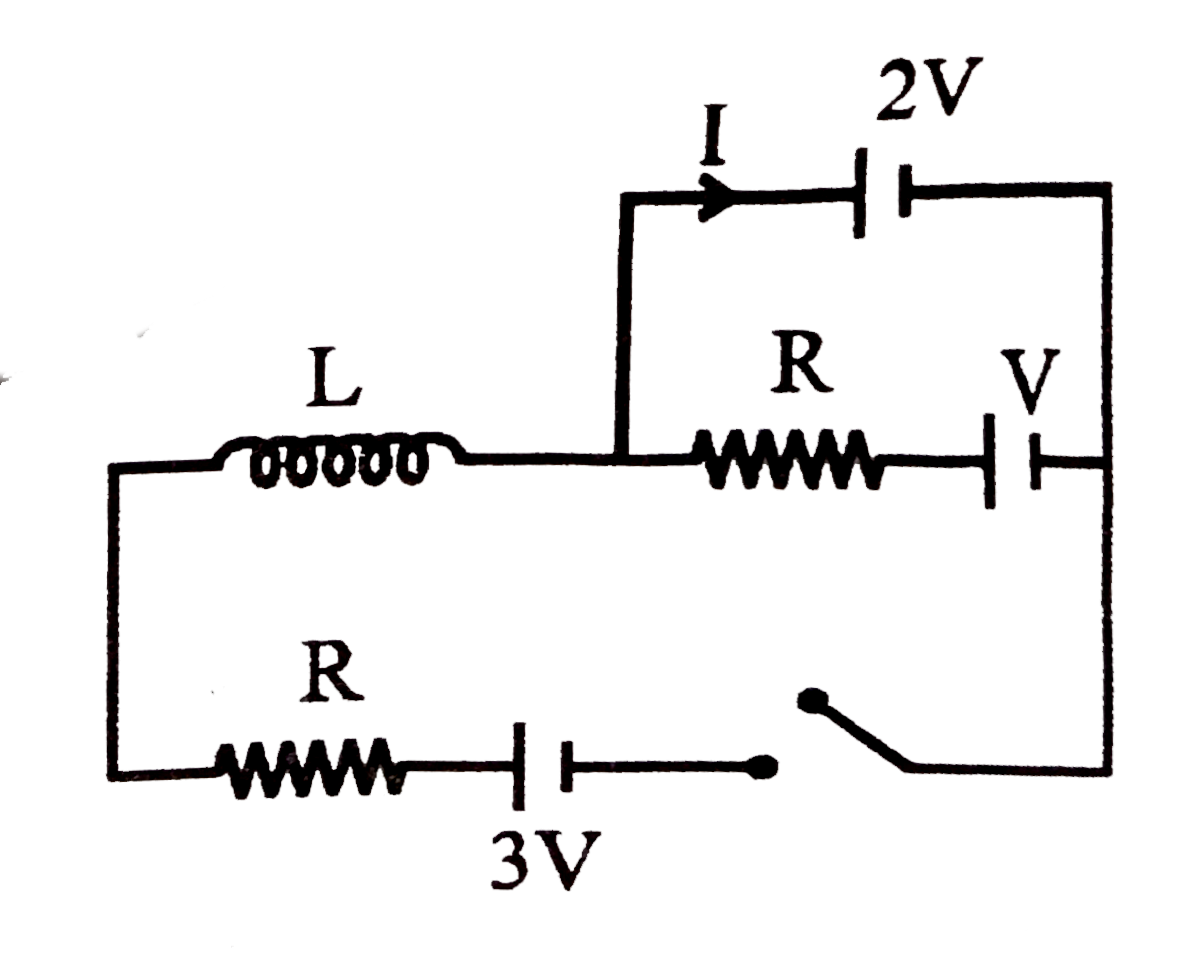
In the LR circuit shown, what is the variation of the current I as a function of time? The switch is closed at time t=0 sec.
 View Solution
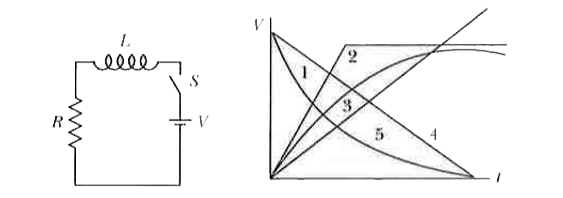
An open switch in an RL circuit is closed at time t = 0, as shown in the following figure. The curve that best illustrates the variation of potential difference across the resistor as a function of time is
 View Solution
In the circuit shown in figure, if the diode forward voltage drop is 0.3 V, then the voltage difference between A to B is,
 View Solution
In the circuit shown in figure switch S is closed at time t=0
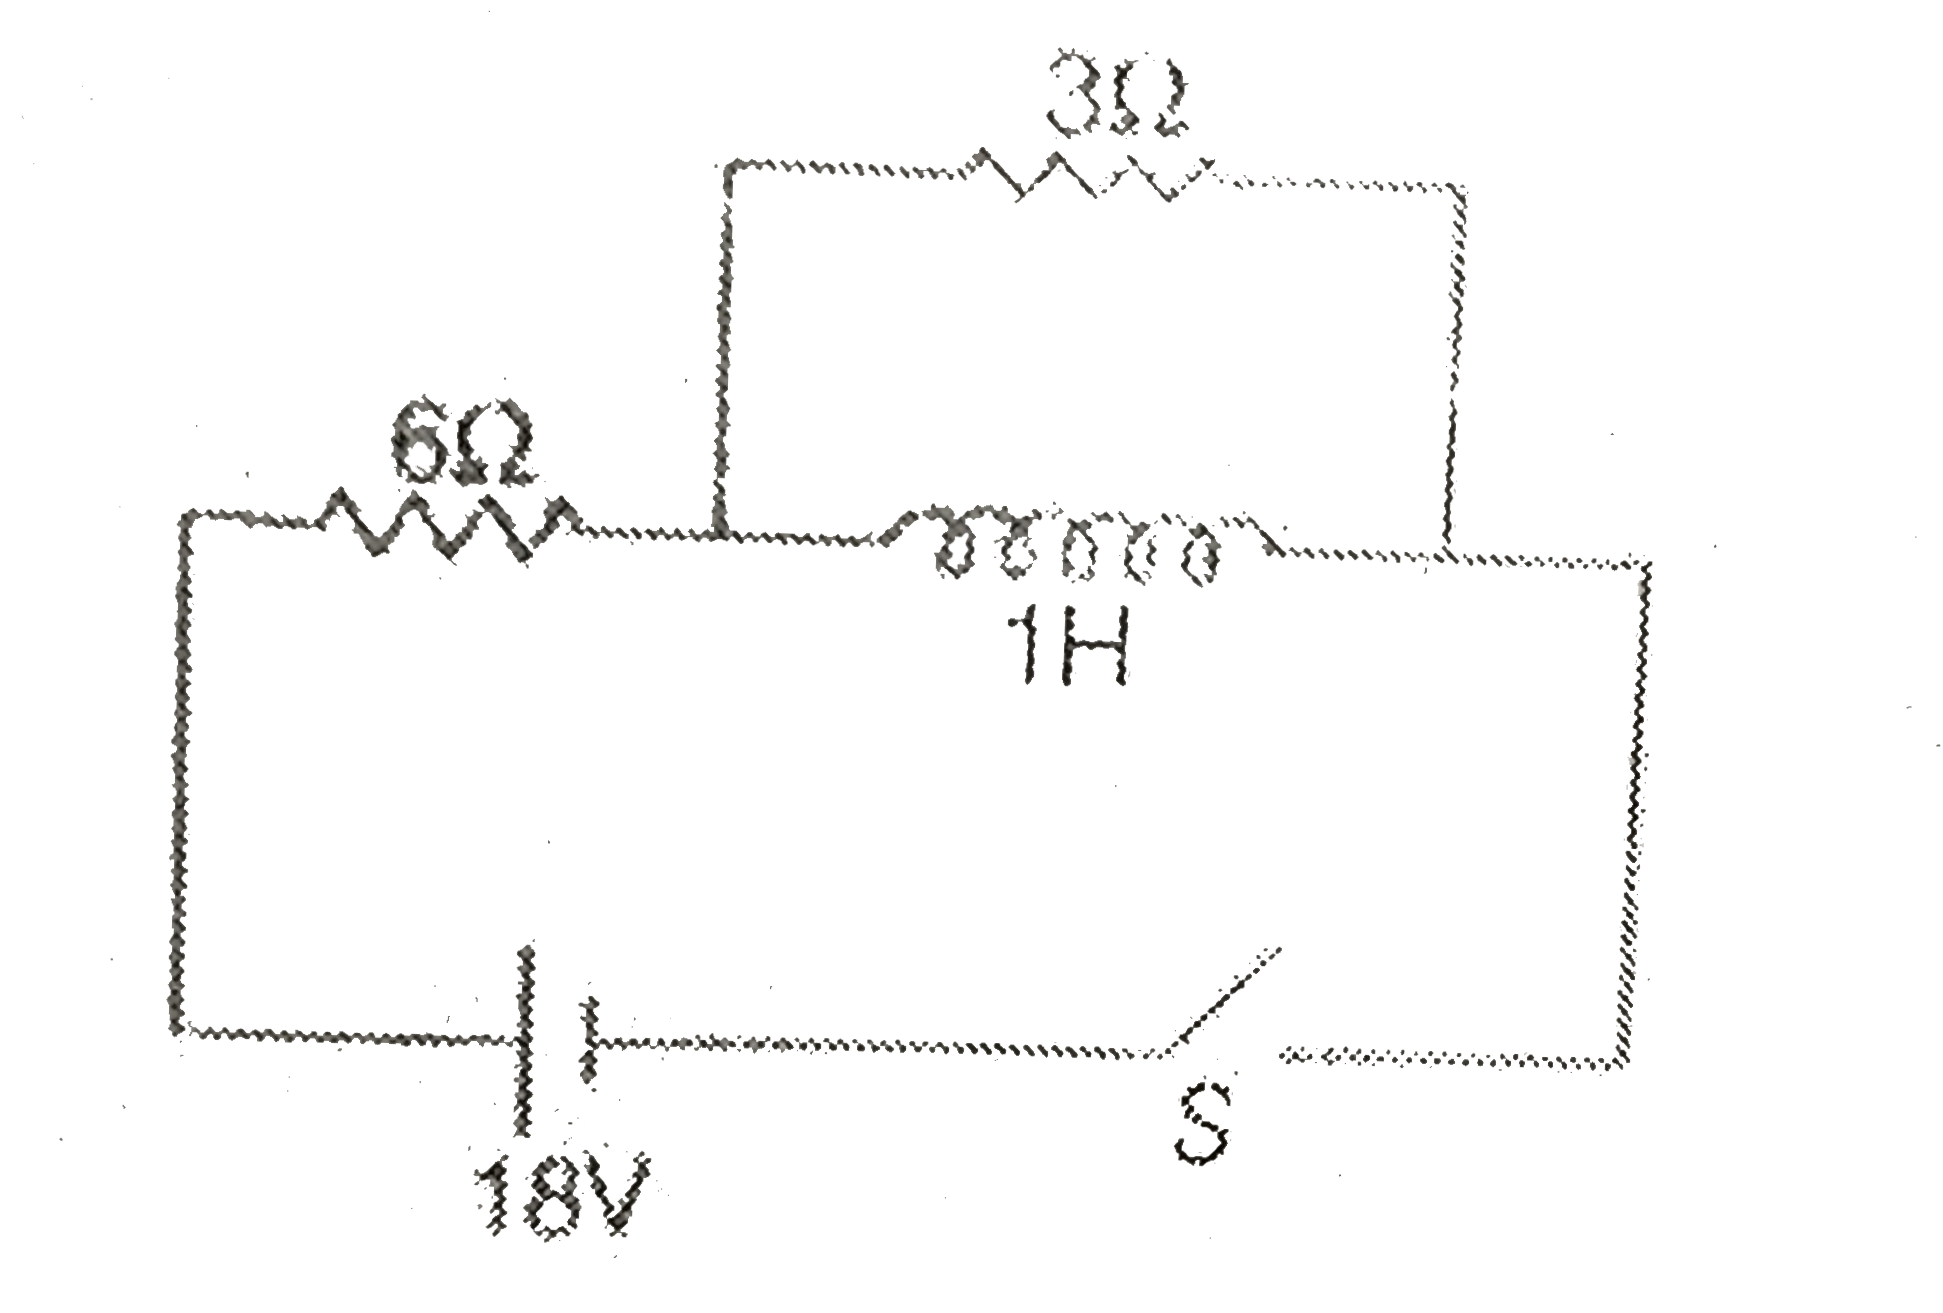
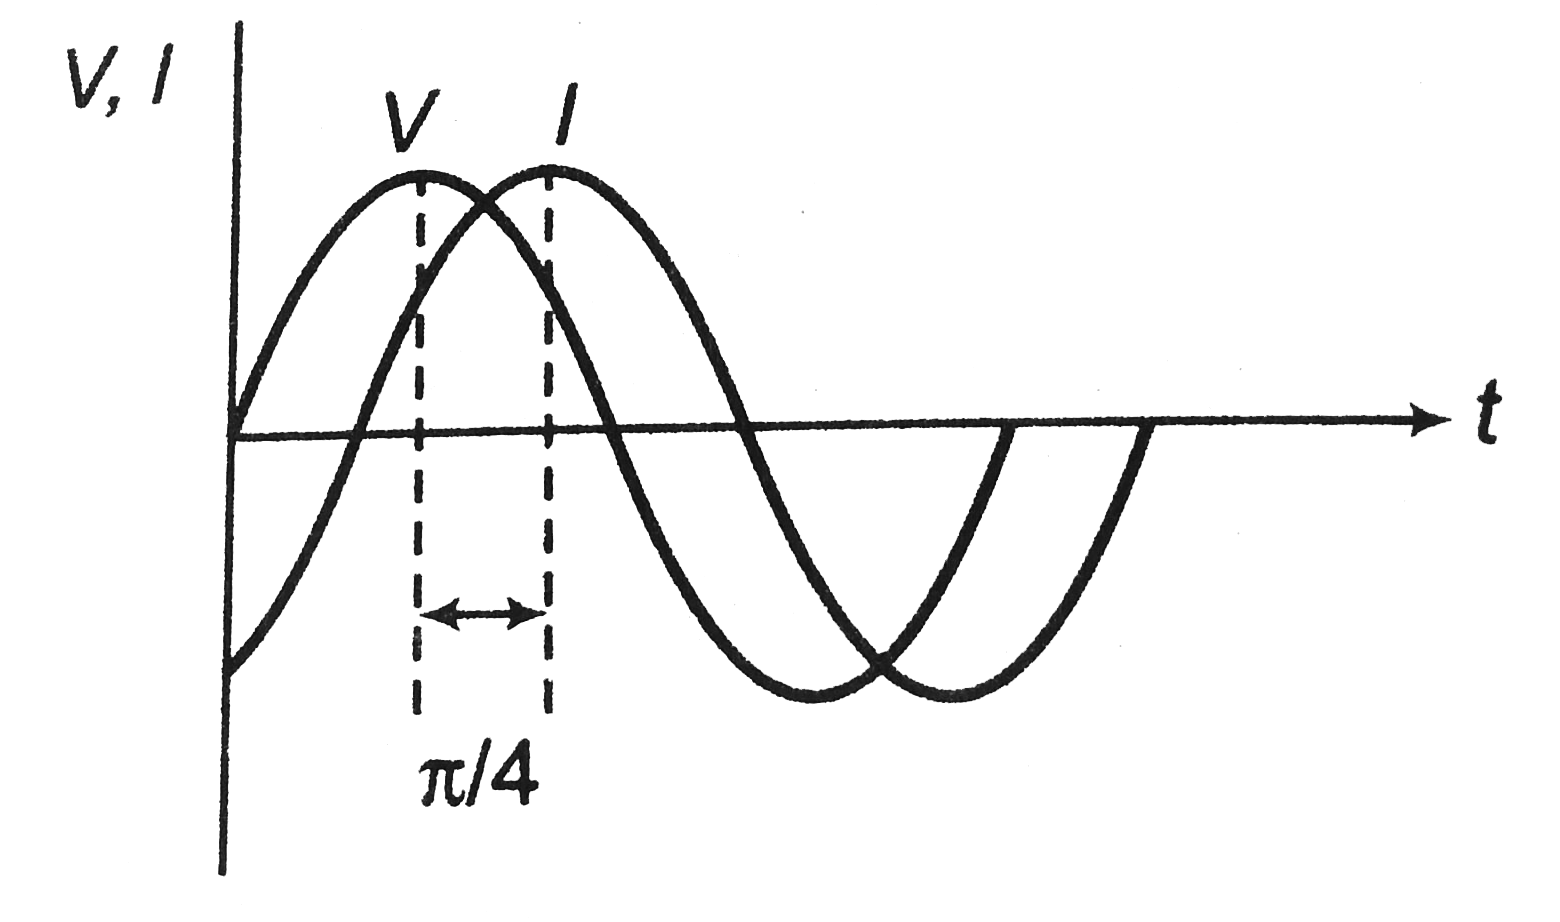
Potential difference across 3Ω resistance at time t is given byView SolutionAn Ac voltage V=V0sin100t is applied to the circuit, the phase difference between current and voltage is found to be π4, then
 .View Solution

