The production of saleable steel in some of the steel plants of our country during 1999 is given below: Plant, Bhilai, Durgapur, Rourkela, Bokaro Production (in thousand tonnes), 160, 80, 200, 150 Construct a bar graph to represent the above data on a graph paper by using the scale 1 big divisions = 20 thousand and tonnes.
Step by step video & image solution for The production of saleable steel in some of the steel plants of our country during 1999 is given below: Plant, Bhilai, Durgapur, Rourkela, Bokaro Production (in thousand tonnes), 160, 80, 200, 150 Construct a bar graph to represent the above data on a graph paper by using the scale 1 big divisions = 20 thousand and tonnes. by Maths experts to help you in doubts & scoring excellent marks in Class 6 exams.
Updated on:21/07/2023Topper's Solved these Questions
Similar Questions
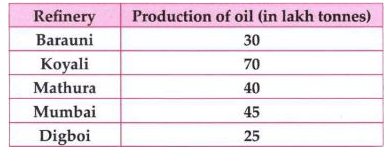
The production of oil (in lakh tonnes) in some of the refineries in India during 2008 is given below :

Construct a bar graph to represent the above data
View SolutionThe following data gives the number (in thousands) of applicants registered with an Employment Exchange during, 1995-2000: year, 1995, 1996, 1997, 1998, 1999, 2000 No. of application (Registered (in Thousand), 18, 20, 24, 28, 30, 34 Construct a bar graph to represent the above data.
View Solution
Knowledge Check
Read the following passage and answer the questions that follow
During the decade after liberalisation floriculture industries took giant steps in the export arena. This era has seen a dynamic shift from sustenance production to commercial production. The area under floriculture production in India is around 249 thousand hectares with a production of 1659 thousand tonnes loose flowers and 484 thousand tonnes cut flowers. Floriculture is now commercially cultivated in several states with Tamil Nadu (20%), Karnataka (13.5%) West Bengal (12.2%) having gone ahead of other producing states like Madhya Pradesh, Mizoram, Gujarat, Andhra Pradesh, Odisha, Jharkhand, Haryana, Assam and Chhattisgarh.
Government of India has identified floriculture as a sunrise industry and accorded it 100% export oriented status. Owing to steady increase in the demand of flowers, floriculture has become one of the important commercial trades in agriculture. Hence commercial floriculture has emerged as hi-tech activity-taking place under controlled climatic conditions inside greenhouse. Floriculture in India, is being viewed as a high growth industry. Commercial floriculture is becoming important from the export angle. The liberalisation of industrial and trade policies paved the way for development of export-oriented production of cut flowers. The new seed policy had already made it feasible to import planting material of international varieties. It has been found that commercial floriculture has higher potential per unit area than most of the field crops and is therefore a lucrative business. Indian floriculture industry has been shifting from traditional flowers to cut flowers for export purposes. The liberalised economy has given an impetus to the Indian entrepreneurs for establishing export oriented floriculture units under controlled climatic conditions
Indian floriculture industry comprises of flowers such as Rose, Tuberose, Glads, Anthurium, Carnations, Marigold etc. India's total export of floriculture was ~571 . 38 crores/$81.94 million in 2018-19. The major importing countries were United States, Netherlands, United Kingdom, Germany and United Arab Emirates. There are more than 300 export-oriented units in India. More than 50% of the floriculture units are based in Karnataka, Andhra Pradesh and Tamil Nadu. With the technical collaborations from foreign companies, the Indian floriculture industry is poised to increase its share in world trade.
The area under floriculture production in India is about:A484 thousand hectaresB249 thousand hectaresC571 thousand hectaresD1659 thousand hectaresDuring the decade after liberalisation floriculture industries took giant steps in the export arena. This era has seen a dynamic shift from sustenance production to commercial production. The area under floriculture production in india is around 249 thousand hectares with a production of 1659 thousand tonnes loose flowers and 484 thousand tonnes of cut flowers. Floriculture is now commercially cultivated in several states with Tamil Nadu (20%), Karnataka (13.5%) West Bengal (12.2%) having gone ahead of other producing states like Madhya pradesh, Mizoram, Gujarat, Andhra pradesh, Odisha, Jharkhand, Haryana, Assam and Chhattisgarh. Government of India has identified floriculture as a sunrise industry and accorded it 100% export oriented status. Owing to steady increase in the demand of flowers, floriculture has become one of the important commercial trade in agriculture. Hence commercial floriculture has emerged as a hi-tech activity -taking place under controlled climatic conditions inside greenhouse. Floriculture in India, is being viewed as a high growth industry. Commercial floriculture is becoming important from the esport angle. The liberation of industrial and trade policies paved the way for development of export-oriented production of cut-flowers. The new seed policy h ad already made it feasible to import planting material of international varieties. It has been found that commercial floriculture flowers to cut flowers for export purposes. The liberalised economy has given an impetus to the indian entrepreneurs for establishing export oriented floriculture units under controlled climatic conditions. Indian floriculture industry comprises of flowers such as Rose, Tuberose, Glads, Anthurium, Carnations, Marigold etc. India’s total export of floriculture was ₹ 571.38 crores/$81.94 million in 2018-19. The major importing countries were United States, Netherlands, United Kingdom, Germany and United ArabEmirats. There are more than 300 export- oriented units in India. More than 50% of the floriculture units are based in Karnataka, Andhra p radesh and Tamil Nadu. With the technical collaborations from foriegn companies, the Indian floriculture industry is poised to increase its share in world trade.
What gave a major fillip t o the export of indian floriculture products?AThe demand from many countries like the US, the UK a nd UAE.BThe use of technology in cultivating flowers inside greenhouses.CThe use of new p olicy to ease the import of seeds of international varietiesDThe liberalisation of industrial and trade policies by the government
The following data gives the production of food grains (in thousand tonnes) for some years: Year 1995 1996 1997 1998 1999 2000 Production (in thousand tonnes) 120 150 140 180 170 190 Represent the above data with the help of a bar graph.
View SolutionThe following data gives the amount of manure (in thousand tonnes) manufactured by a company during some years: Year, 1992, 1993, 1994, 1995, 1996, 1997 Manure (In thousand tonnes), 15, 35, 45, 30, 40, 20 Represent the above data with the help of a bar graph. Indicate with the help of the bar graph the year in which the amount of manure manufactured by the company was maximum. Choose the correct alternative: The consecutive years during which there was maximum decrease in manure production are: 1994 to 1995 (b) 1992 and 1993 1996-1997 (d) 1995 and 1996
View SolutionThe data given below shows the production of motor bikes in a factory for some months of two consecutive years.

Study the table given above and answer the following questions:
(a) Draw a double bar graph using appropriate scale to depict the above information and compare them.
(b) In which year was the total output the maximum?
(c) Find the mean production for the year 2007.
(d) For which month was the difference between the production for the two years the maximum?
(e) In which month for the year 2008, the production was the maximum?
(l) In which month for the year 2007, the production was the least?
View SolutionDirections (Questions 21-26): The bar graph given below gives the data of the production of paper (in lakh tonnes) by three different companies X, Y and Z over last 5 years. Study the graph carefully and answer the questions that follow. Production of Paper (in lakh tons) By Companies X, Y and Z over the Years (FIGURE) What is the difference between the production of Company Z in 2008 and Company Y in 2006? (a) 2 lakh tons (b) 20 lakh tons (c) 20 thousand tons (d) 200 lakh tons (e) None of these
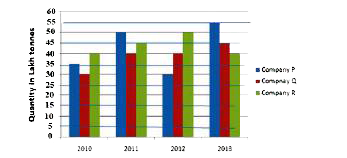
View SolutionThe bar graph given below shows the data of the production of paper (in lakh tonnes) by three different companies P, Q and R over the years.

What is the ratio of the average production by company P during the period 2010 to 2013 to the average production by company R during the same period?
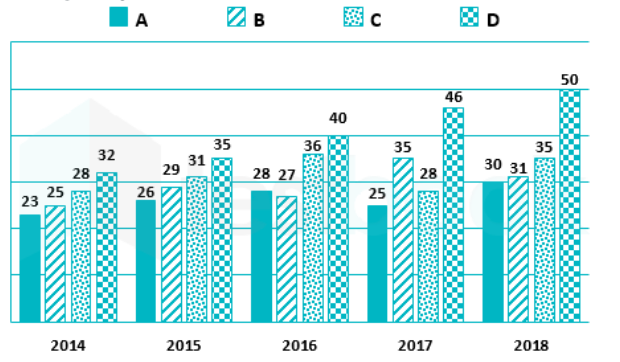
View SolutionThe following bar graph shows the data of the production of an item (in thousand tonnes) from four different companies A, B, C and D during the years mentioned.

In the five years given, the average production is highest in company _____ and lower in company _______ respectively.
View Solution