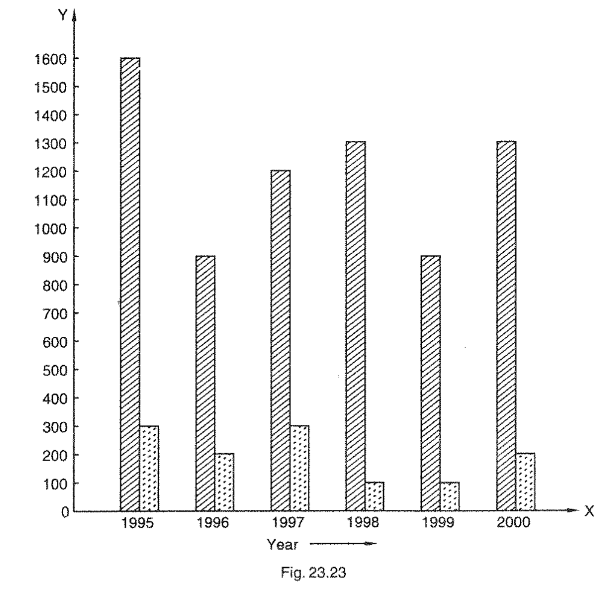
The following bar graph shows the number of
persons killed in industrial accidents in a country for some years (Figure)
Read the bar graph and choose the correct alternative
in each of the following:
The year which shows the maximum percentage
increase in the number of persons killed in coal mines over the preceding
year is:
(a) 1996
(b) 1997 (c)
1999 (d) 2000
The year which shows the maximum decrease in
the number of persons killed in industrial accidents over the preceding year
is:
(a) 1996
(b) 1997 (c)
1998 (d) 2000
The year in which the maximum number of persons
were killed in industrial accidents other than those killed in coal mines is:
1995
(b) 1997 (c)
1998 (d) 1999
Step by step video & image solution for The following bar graph shows the number of persons killed in industrial accidents in a country for some years (Figure) Read the bar graph and choose the correct alternative in each of the following: The year which shows the maximum percentage increase in the number of persons killed in coal mines over the preceding year is: (a) 1996 (b) 1997 (c) 1999 (d) 2000 The year which shows the maximum decrease in the number of persons killed in industrial accidents over the preceding year is: (a) 1996 (b) 1997 (c) 1998 (d) 2000 The year in which the maximum number of persons were killed in industrial accidents other than those killed in coal mines is: 1995 (b) 1997 (c) 1998 (d) 1999 by Maths experts to help you in doubts & scoring excellent marks in Class 6 exams.
Updated on:21/07/2023Topper's Solved these Questions
Similar Questions
The following data shows the number of students born in different months of a particular year of class VI. Make the bar graph based on the given information.

View SolutionRead the following graph and answer questions
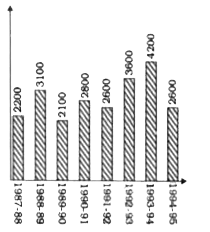
In which of the following years, the percent increase of deficit was highest over its preceding year?
View Solution
Knowledge Check
The year, in which the percentage increase in export was maximum from its preceding year, is
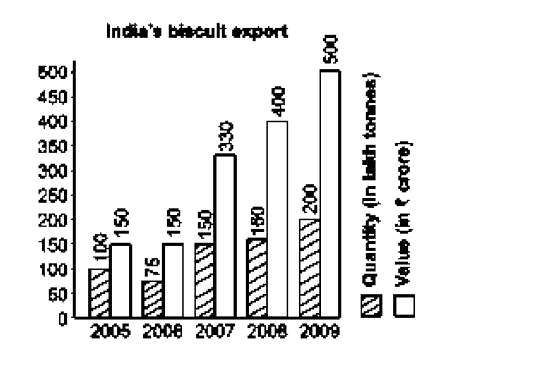 A2009B2007C2008DNone of the above
Study the following bar graph and answer the question that follows.
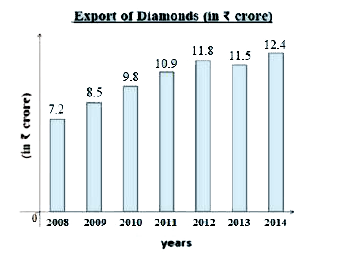
In which year was the maximum percentage increase in diamond exports compared to the previous year?A2014B2009C2010D2012The bar graph shows the number of students (in hundreds) admitted and passed out per year in a college during the years 2010 to 2014.
Study the bar graph and answer the question.
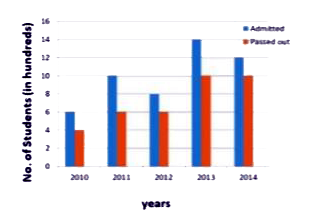
In which of the following years, was the pass percentage between 80 and 85?A2013B2012C2011D2014
Read the bar graph given below and answer the following questions:
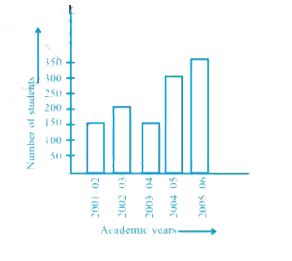
In which year is the number of students maximum?
View SolutionRead the bar graph given below and answer the following questions:
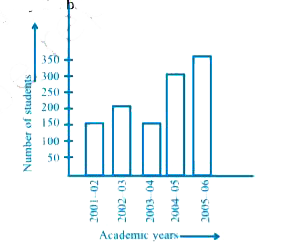
In which year is the increase in number of students maximum as compared to the previous year?
View SolutionThe following bar graph shows the number of students in a particular class of school. Then, answer the following questions.
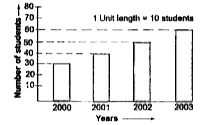
What is the number of students in the year 2003?
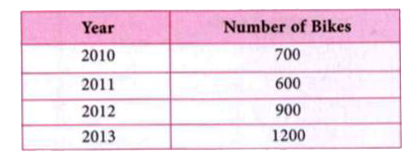
View SolutionDraw a bar graph using the data given in the following table, which shows the number of bikes manufactured in a factory during the years 2010 to 2013.
View SolutionThe following bar graph shows the number of students in a particular class of school. Then, answer the following questions.
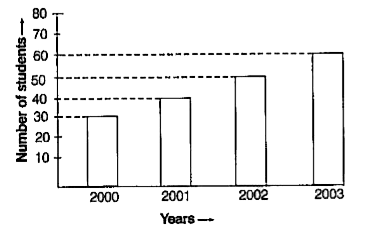
What is the number of students in the year 2003?
View Solution
