The population of four major cities in India in a particular year is given below: City, Mumbai, Kolkata, Delhi, Chennai No. of Students, 120, 130, 150, 80 Construct a bar graph to represent the above data.
Step by step video & image solution for The population of four major cities in India in a particular year is given below: City, Mumbai, Kolkata, Delhi, Chennai No. of Students, 120, 130, 150, 80 Construct a bar graph to represent the above data. by Maths experts to help you in doubts & scoring excellent marks in Class 6 exams.
Updated on:21/07/2023Topper's Solved these Questions
Similar Questions
Given below is the data of school going students (boys and girls):

Draw the bar graph to represent the above data.
View SolutionThe production of saleable steel in some of the steel plants of our country during 1999 is given below: Plant, Bhilai, Durgapur, Rourkela, Bokaro Production (in thousand tonnes), 160, 80, 200, 150 Construct a bar graph to represent the above data on a graph paper by using the scale 1 big divisions = 20 thousand and tonnes.
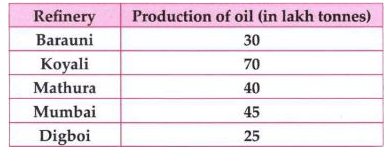
View SolutionThe production of oil (in lakh tonnes) in some of the refineries in India during 2008 is given below :

Construct a bar graph to represent the above data
View SolutionThe daily pocket expenses of 206 students in a school are given below.

Construct a frequency polygon representing the above data.
View SolutionThe daily pocket expenses of 206 students in a school are given below.

Construct a frequency polygon representing the above data.
View SolutionThe marks obtained (out of 100) by a class of 80 students are given below:

Construct a histogram to represent the data above
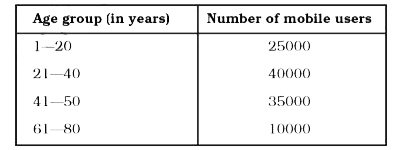
View SolutionNumber of mobile phone users in various age groups in a city is listed below:

Draw a bar graph to represent the above information.
View SolutionThe expenditure of a family of different heads in a month is given below

Draw a bar graph to represent the data above.
View Solution70 students from a locality use different modes of transport to go to school as given below:

Draw the bar graph representing the above data.
View Solution70 students from a locality use different modes of transport to go to school as given below:
 Draw the bar graph representing the above data.
View Solution
