There are 50 people in a room ,Twenty -eight are male ,and 32 are under the age of 30 Twelve are males under the age of 30 ,How woman over the age of 30 are in the group ?
2
3
4
5
The correct Answer is:A
A Venn diagram will help you solve this problem

The two circles represent males and people who are at most 30 years of age , respectively . The part of the rectangle outside both circles represents people who are in neither category , i,e females over the age of 30 ,First fill in the 12 males who are less than or equal to 30 years of age in the intersection of the circles .Since there are 28 males altogether , 16 are male and over 30. since there are 32 people age 30 or less , there are 20 women that age ,Add these together to get 48 people . since there are 50 in the group , 2 must be women over 30 .
Topper's Solved these Questions
Similar Questions
The mean age of a combined group of men and women is 30 years. If the means of the age of men and women are respectively 32 and 27, then the percentage of women in the group is
View SolutionStudy the bar graph representing the number of persons in various age groups in a town shown in Figure. Observe the bar graph and answer the following questions: What is the percentage of the youngest age-group persons over those in the oldest age group? What is the total population of the town? What is the number of persons in the age-group 60-65? How many persons are more in the age-group 10-15 then in the age group 30-35? What is the age-group of exactly 1200 persons living in the town? What is the total number of persons living in the town in the age-group 50-55? What is the total number of persons living in the town in the age-groups 10-15 and 60-65? Whether the population in general increases, decreases or remains constant with the increase in the age-group.
View Solution
Knowledge Check
- Question 1 - Select One
A group of 30 employees of Cadre A has a mean age of 27. A different group of 70 employees of Cadre B has a mean age of 23. What is the mean age of the employees of the two group togeters?
A23B24.2C25D26.8 - Question 2 - Select One
A boy is 30 years younger than this father. If the sum of the ages of the son and the father is 56, find the age of the son.
A13 yearsB12 yearsC11 yearsD10 years - Question 3 - Select One

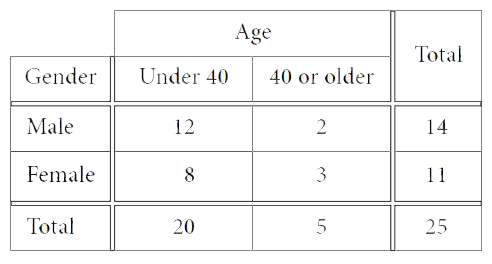
The table above shows the distribution of age and gender for 25 people who entered a contest. If the contest winner will be selected at random, what is them probability that the winner will be either a female under age 40 or a male age 40 or older?A425B1025C1125D1625
The average (arithmetic mean) age of the people in a certain group was 35 years before one of the members left the group and was replaced by someone who is 12 years older than the person who left. If the average age of the group is now 37 years, how many people are in the group?
View SolutionA researcher estimates that 10% of the children in the world are between the ages of 8 and 18 and dislike soccer, and that 50% of the children who like soccer are between the ages of 8 and 18. If 40% of the children in the world are between the ages of 8 and 18, what percentage of children in the world are under age 8 and dislike the game of soccer? (Assume all children are between the ages of 0 and 18.)
View SolutionPresent age of father is 42 years and that of his son is 14. Find the ratio of (a) Present age of father to the present age of son.(b) Age of the father to the age of son, when son was 12 years old.(c) Age of father after 10 years to the age of son after 10 years.(d) Age of father to the age of son when father was 30 years old.
View SolutionA contractor plans to install two slides for the children to play in a park. For the children below the age of 5 years, she prefers to have a slide whose top is at a height of 1.5 m, and is inclined at an angle of 30∘to the ground, whereas for elder children, she wants to have a steep slide at a height of 3m, and inclined at an angle of 60∘ to the ground. What should be the length of the slide in each case?
View SolutionAn insurance company selected 2000 drivers at random (i.e., without any preference of one driver over another) in a particular city to find a relationship between age and accidents. The data obtained are given in the following table: Find the probabilities of the following events for a driver chosen at random from the city: (i) The driver being in the age group 18−29 years and having exactly 3 accidents in one year. (ii) The driver being in the age group of 30−50 year and having one or more accidents in a year. (iii) The number of drivers having no accidents in one year
View Solution

