The scatterplot shows gas mileage (miles per gallon) at various speeds (miles per hour) when a car was driven 100 miles at various speeds on a test track.

Which regression model is probably the best predictor of gas mileage as a function of speed?
constat
linear
quadratic
cubic
The correct Answer is:C
The scatterplot has the shape of a parabola with a maximum. Therefore, the quadratic model would be the best predicor.
Topper's Solved these Questions
- BOOK - ENGLISH SATCHAPTER - STATISTICSEXERCISE - EXERCISES8videos
STATISTICS
- BOOK - ENGLISH SATCHAPTER - SOLVING POLYNOMIAL INEQUALITIES EXERCISE - EXERCISES3videos
SOLVING POLYNOMIAL INEQUALITIES
- BOOK - ENGLISH SATCHAPTER - STRATEGIES FOR SOLVING SAT MATH PROBLEMS EXERCISE - EXAMPLE19videos
STRATEGIES FOR SOLVING SAT MATH PROBLEMS
Similar Questions
A cheetah ran 12 miles at an average rate of 50 miles per hour and then ran the next 12 miles at an average rate of 43 miles per hour. What was the average speed, in miles per hour, of the cheetah for the 24 miles ?
View SolutionAn elephant traveled 7 miles at an average rate of 4 miles per hour and then traveled the next 7 miles at an average rate of 1 mile per hour. What was the average speed, in miles per hour, of the elephant for the 14 miles?
View Solution
Knowledge Check
- Question 1 - Select One

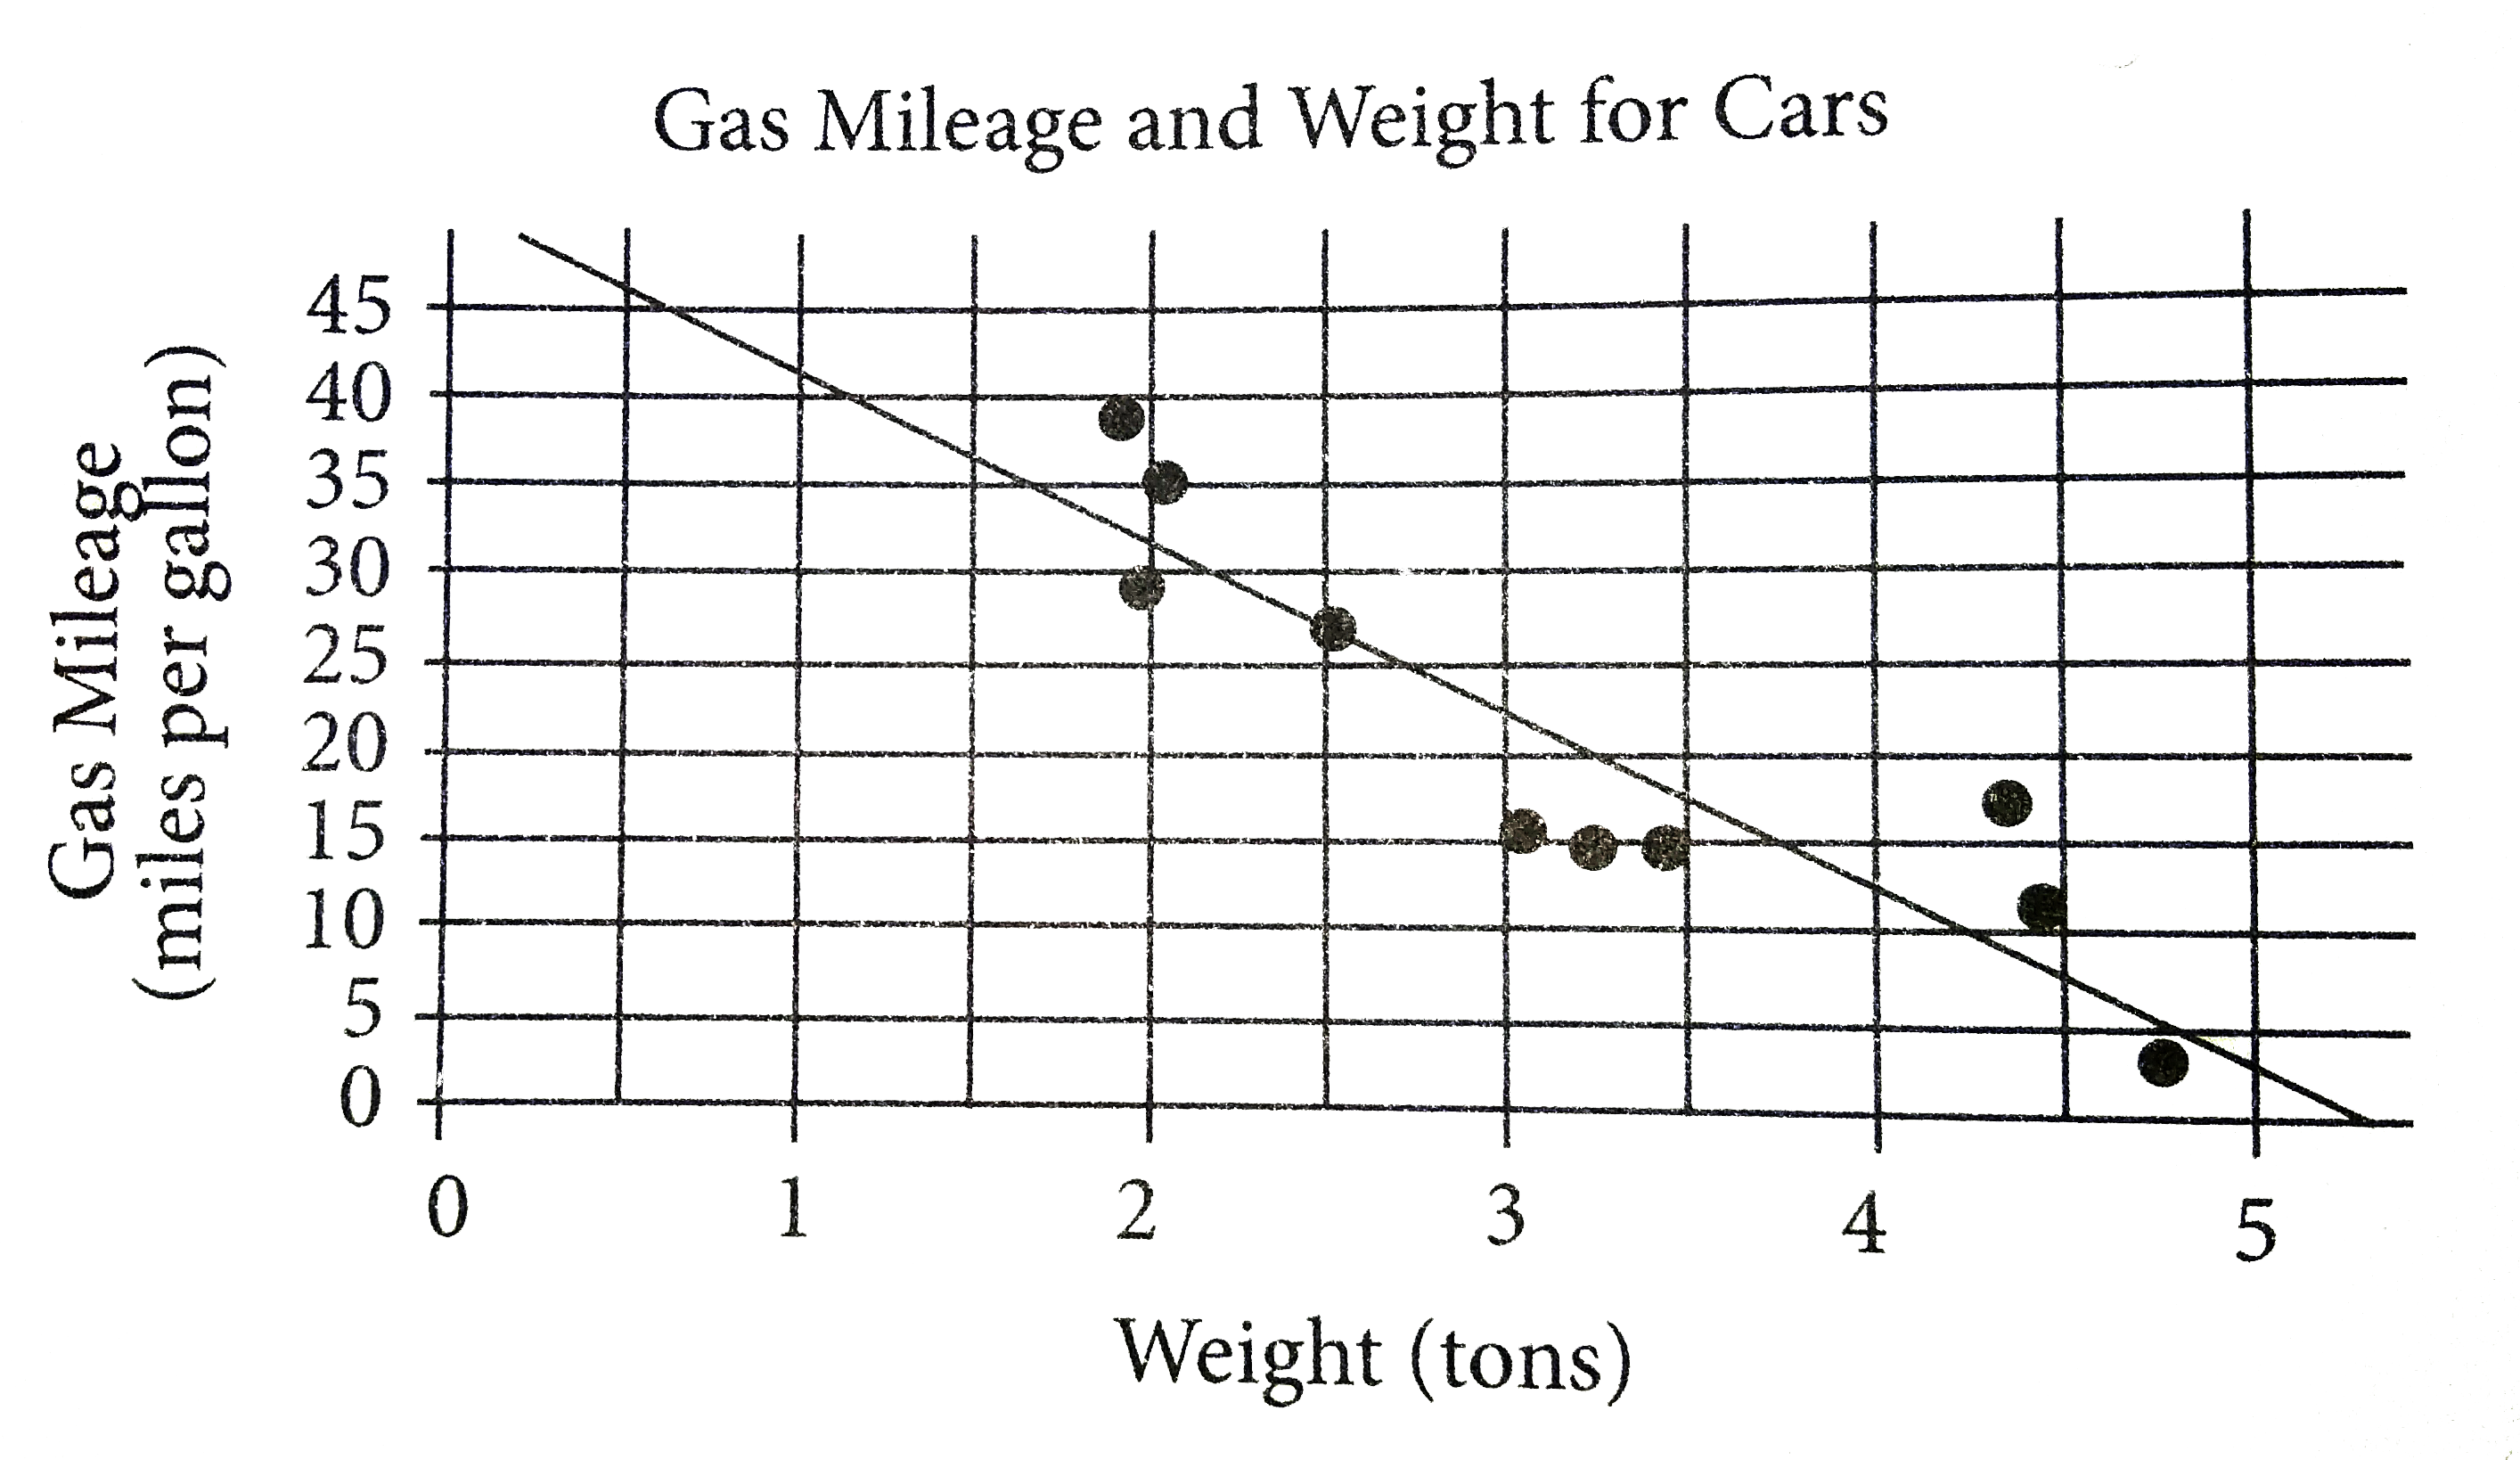
The scatterplot above shows the relationship between gas mileage, in miles per gallon, and weight , in tons, for 10 cars selected at random. The line of best fit models the gas mileage based on the weight of the car. What is the weight, in tons, of the car for which the actual gas mileage was closest to the predicted value?A2.5B4.5C15D27 - Question 2 - Select One
The average gas mileage for n vehicles on one car lot is 21 miles per gallon. The average gas mileage for p vehicles on another car lot is 25 miles per gallon. When the vehicles on both lots are combined, the average gas mileage is 22.5 miles per gallon. What is the value of pn?
A38B12C35D1 - Question 3 - Select One
A train travels at an average speed of 50 miles per hour. It travels for 212 hours.
A120 milesB150 milesC200 milesDNone of these
A tennis ball was observed to travel at a speed of 96 miles per hour. Calculate the speed of the ball in metres per second.
View SolutionThe gas mileage for Jan's car is 28 miles per gallon when the car travels at an average speed of 55 miles per hour. The car's gas tank has 20 gallons of gas at the beginning of a trip. If Jan drives at an average speed of 55 miles per hour, Which of the following functions f models the number of gallons of gas remaining in the tank t hours after the trip begins ?
View SolutionAn airline flies, two different planes over the same route. The faster of the two planes travels at an average speed of 540 mile per hour,and the other plane travels at an average speed of 450 miles per hour. How many more miles can the faster plane travel in 12 seconds than the slower plane?
View SolutionA freight train and a passenger train start toward each other at the same time from two towns that are 500 miles apart. After 3 hours, the trains are still 80 miles apart. If the average rate of speed of the passenger train in 20 miles per hour faster than the average rate of speed of the freight train, what is the average rate of speed, in miles per hour, of the freight train?
View SolutionJessica's car gets 18 miles per gallon when the car travels at an average speed of 35 miles per hour. Jessica begins a trip with 14 gallons of gas, and she travels at 35 miles per hour for the first 4 hours of her trip. Which of the following functions g is the most accurate model for the number of gallons of gallons of gas remaining in the tank t hours after the trip begins for 0≤t≤4?
View Solution

