The mean and standard deviation for SATmath math scores are shown in the table below for five high schools in a large city. A particular score for each school is also shown (in the right column).

Which single score has the highest z-score ?
474 in school D
552 in school E
560 in school B
561 in school C
The correct Answer is:A
The z-scores for the schools are 2.8 for A, 2.5 for B, 2.1 for C, 3 for D, and 2.1 for E.
Topper's Solved these Questions
- BOOK - ENGLISH SATCHAPTER - STATISTICSEXERCISE - EXERCISES8videos
STATISTICS
- BOOK - ENGLISH SATCHAPTER - SOLVING POLYNOMIAL INEQUALITIES EXERCISE - EXERCISES3videos
SOLVING POLYNOMIAL INEQUALITIES
- BOOK - ENGLISH SATCHAPTER - STRATEGIES FOR SOLVING SAT MATH PROBLEMS EXERCISE - EXAMPLE19videos
STRATEGIES FOR SOLVING SAT MATH PROBLEMS
Similar Questions
The following table shown the mean and standard deviation of the marks of Mathematics and Physics scored by the students in a school :

The correlation coefficient between the given marks is 0.86 . Estimate the likely marks in Physics if the marks in Mathematics are 92.View Solution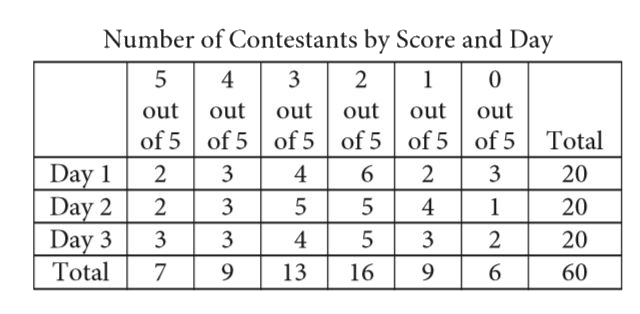
The same 20 contestants, on each of 3 days, answered 5 questions in order to win a prize. Each contestant received 1 point for each correct answer. The number of contestants receiving a given score on each day is shown in the table above.
What was the mean score of the contestants on Day 1 ?View Solution
Knowledge Check
- Question 1 - Select One
For 20 quiz scores in a typing class, the table below gives the frequency of the scores in each score interval. Which score interval contains the median of the scores?
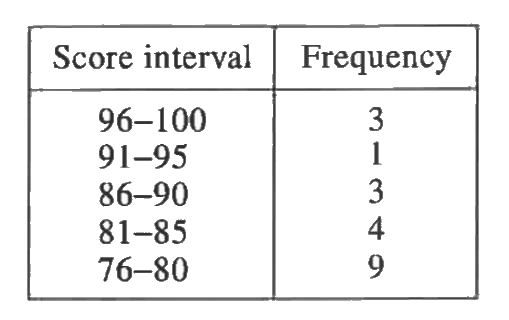 A96-100B91-95C86-90D81-85
 - Question 2 - Select One
In a particular college, the test scores of the most recent test given for a particular Physics class and a particular Literature class were studied. Both tests were scored from 0 to 100 and had a total of 20 question, which were equally weighted with no partial credit. The physics class had 128 students and the Literature class had 75 students . The test results are shown in the two graphs below.
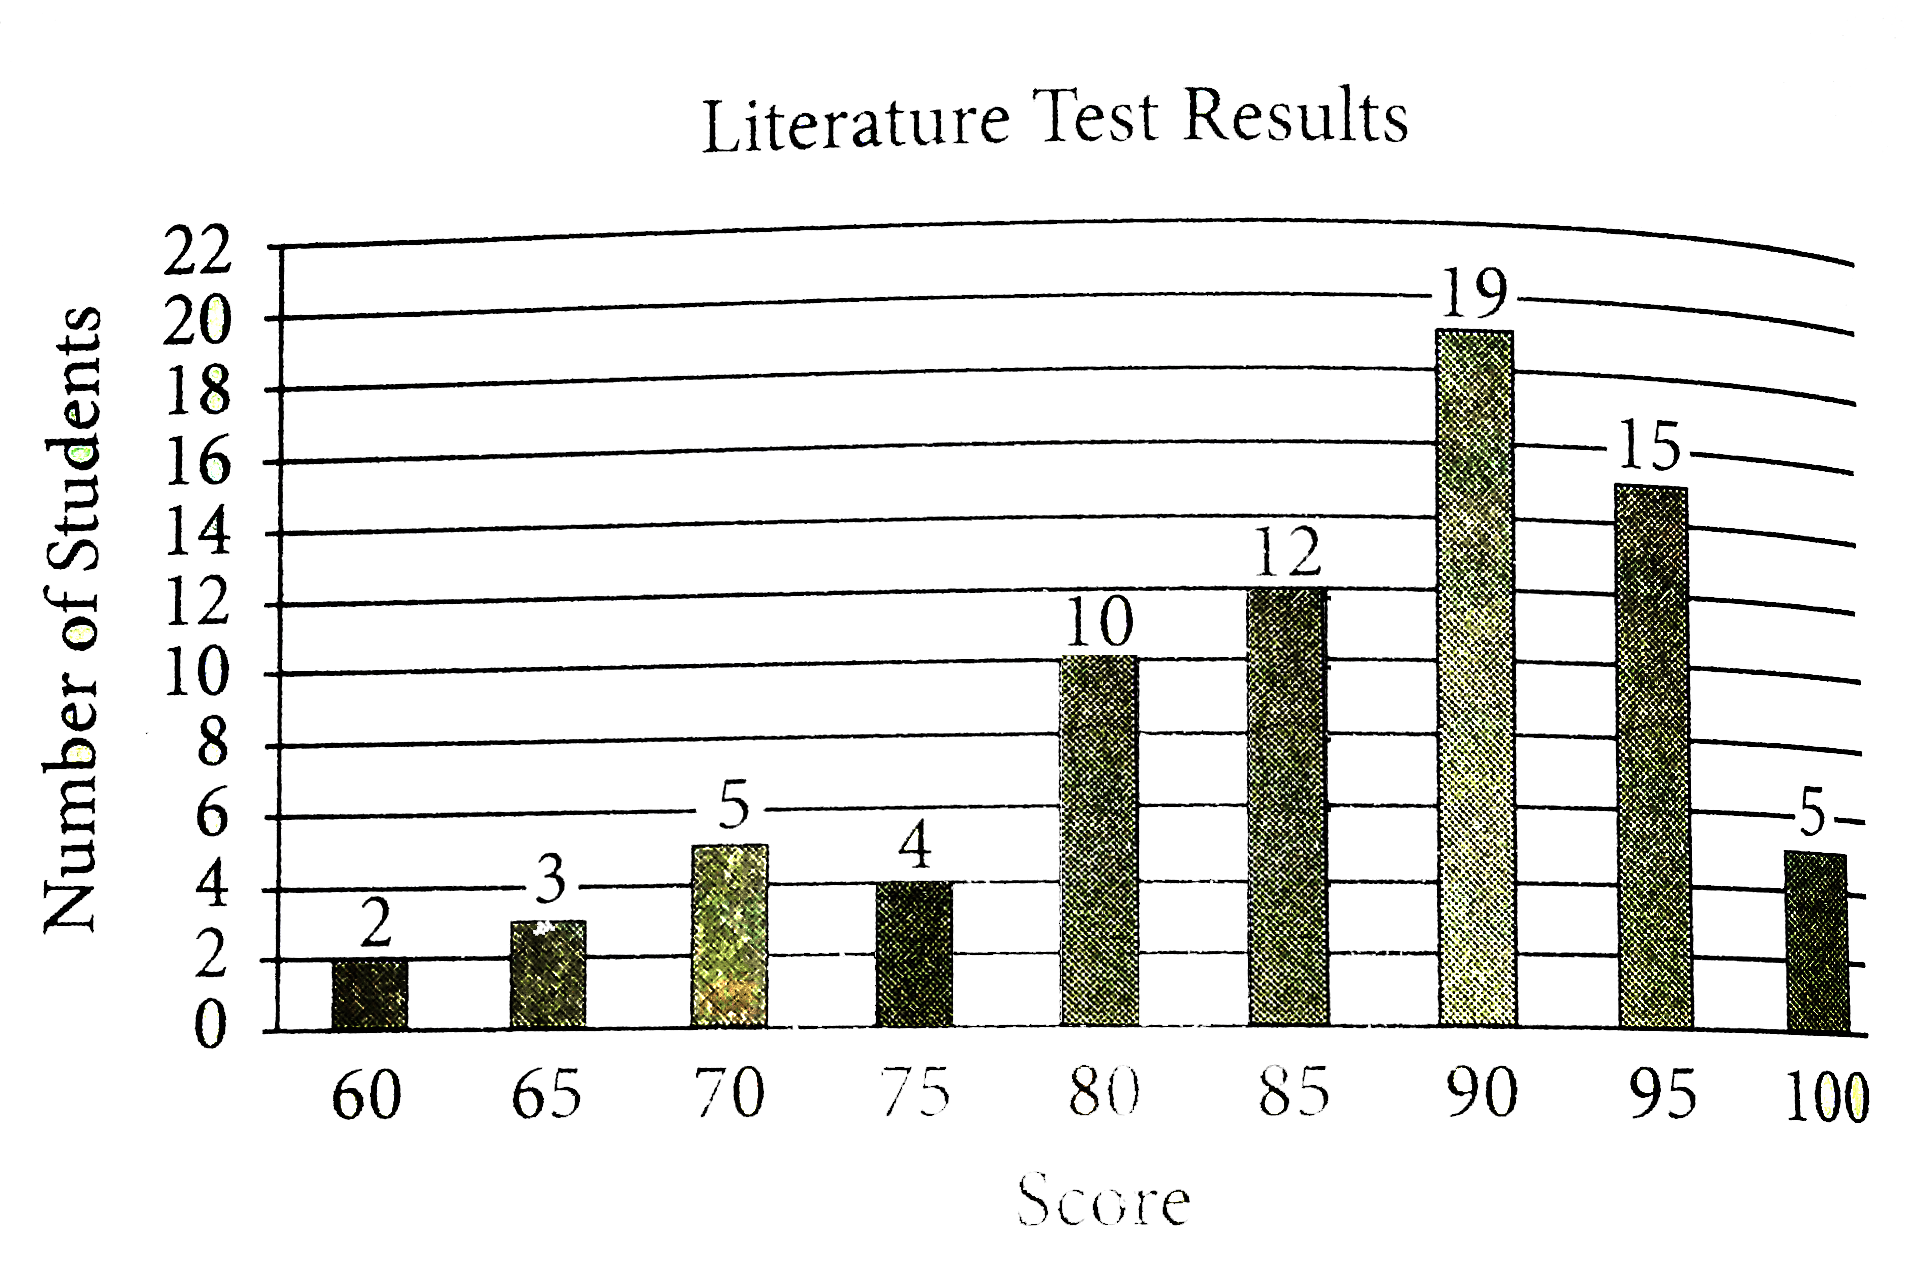
The dean of the college is comparing the scores from the two classes and calculates the median for each class. If the dean labels the median score of the Physics class P and the median score of the Literature class L, what is the sum of P and L?A175B170C85D80 - Question 3 - Select One
A sociologist chose 300 students at random from each of two schools and asked each student how many siblings he or she has. The results are shown in the table below.
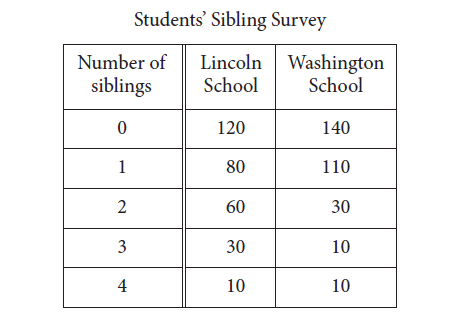
There are a total of 2,400 students at Lincoln School and 3,300 students at Washington School.
What is the median number of siblings for all the students surveyed?A0B1C2D3
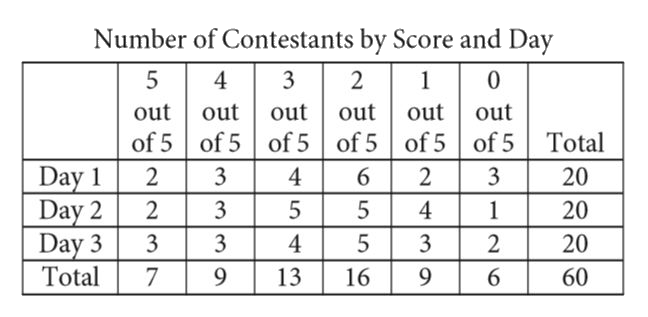
The same 20 contestants, on each of 3 days, answered 5 questions in order to win a prize. Each contestant received 1 point for each correct answer. The number of contestants receiving a given score on each day is shown in the table above.
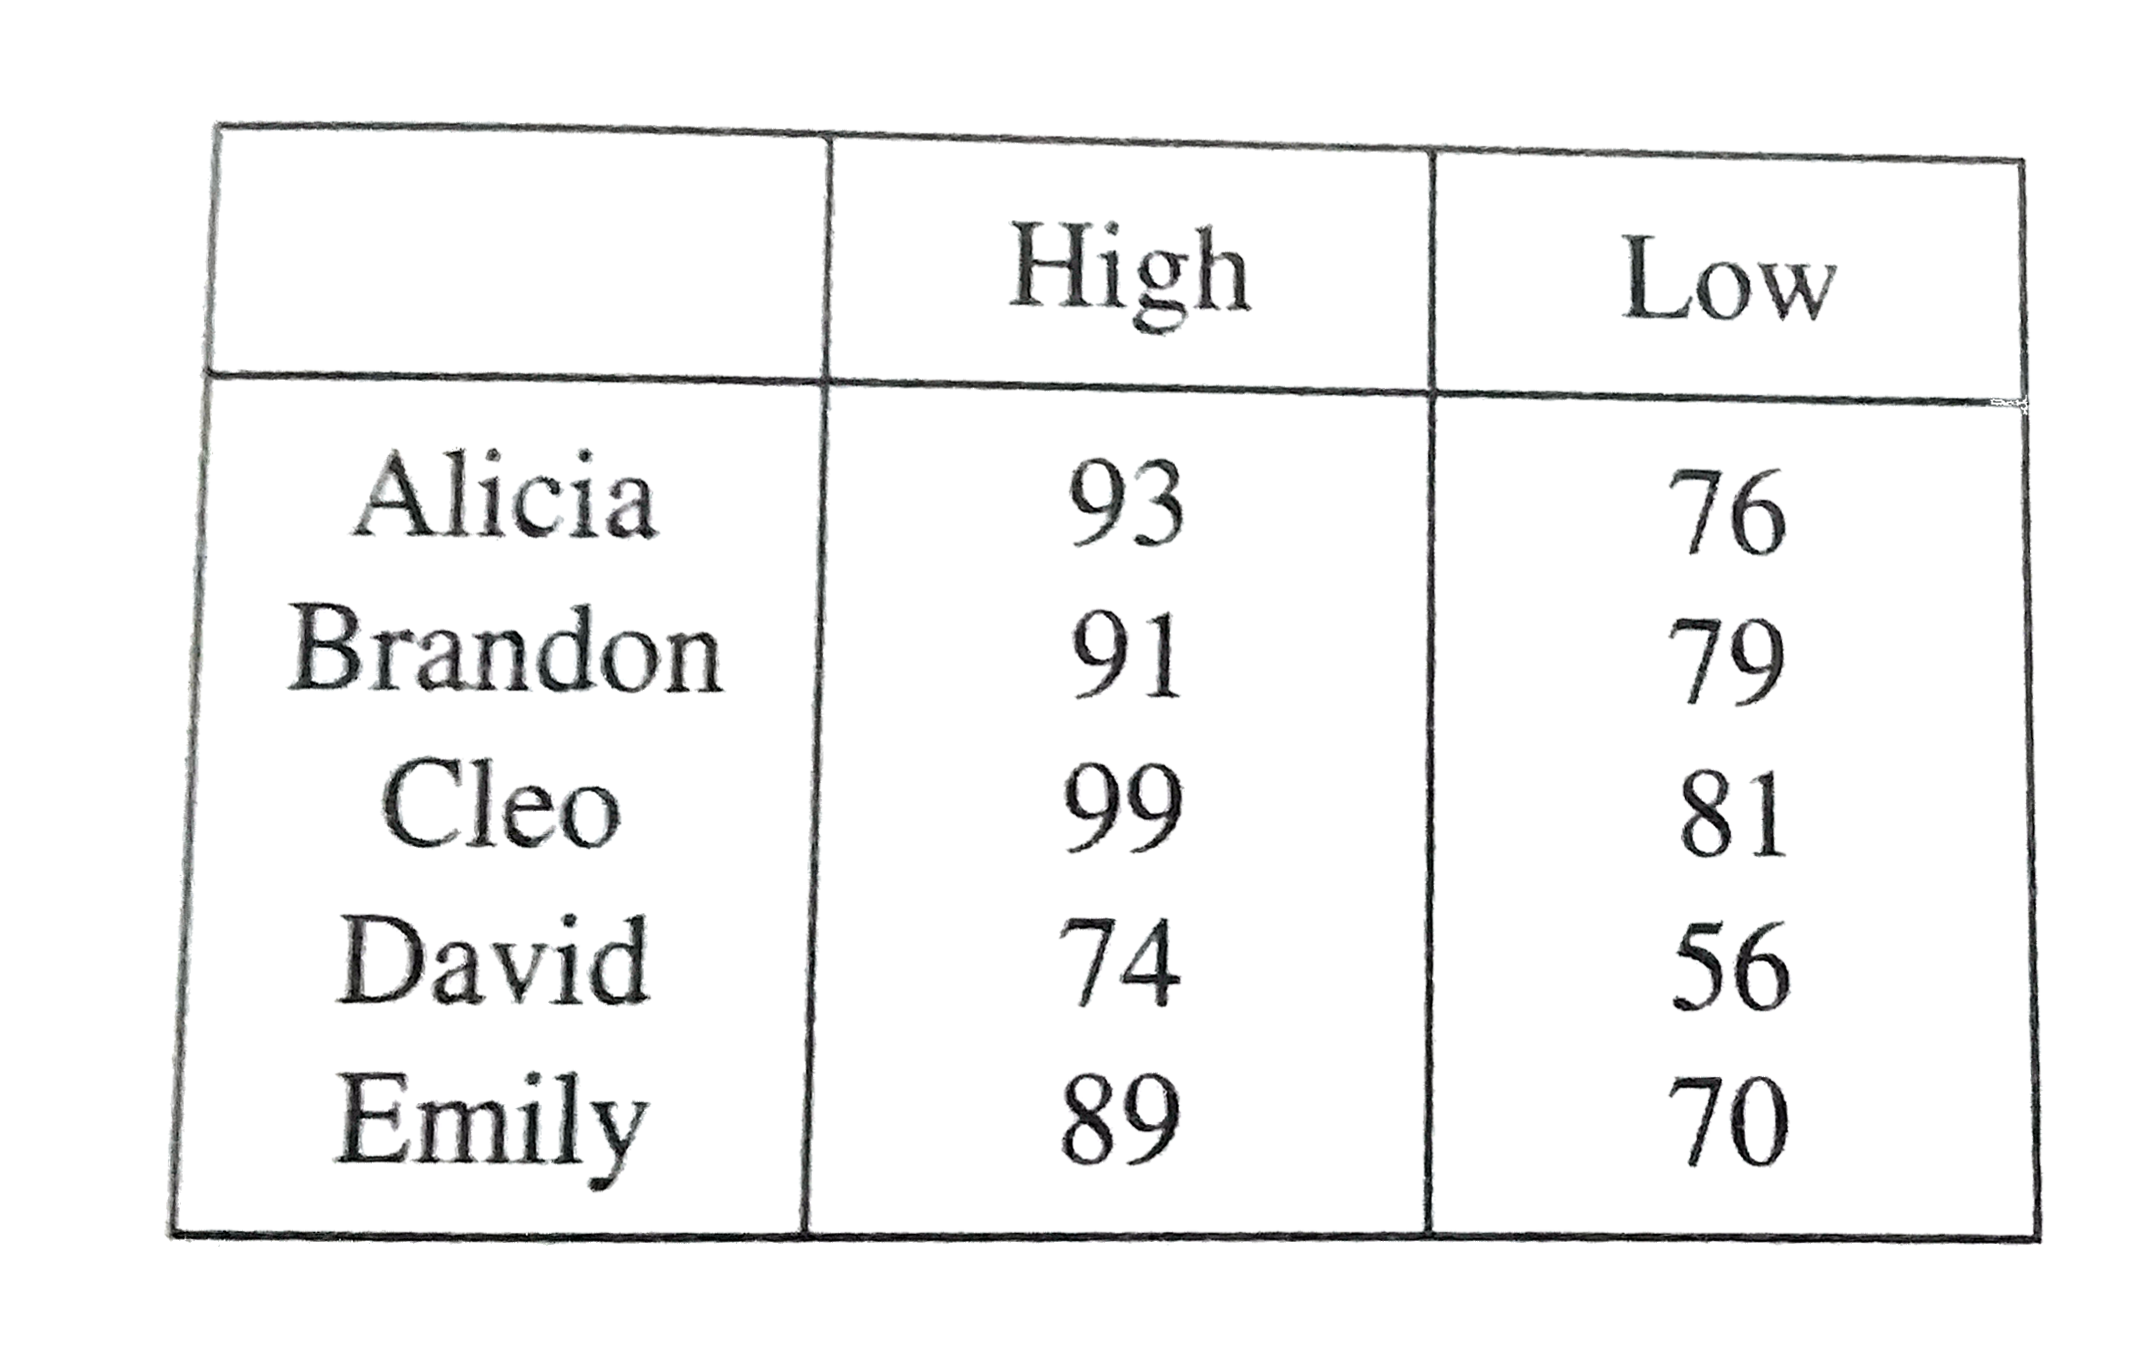
No contestant received the same score on two different days. If a contestant is selected at random, what is the probability that the selected contestant received a score of 5 on Day 2 or Day 3, given that the contestant received a score of 5 on one of the three days?View SolutionThe highest and lowest test scores of five students in Mr . Canyon's science class are listed below . Which students had the greatest range of scores ?
 View Solution
A sociologist chose 300 students at random from each of two schools and asked each student how many siblings he or she has. The results are shown in the table below.
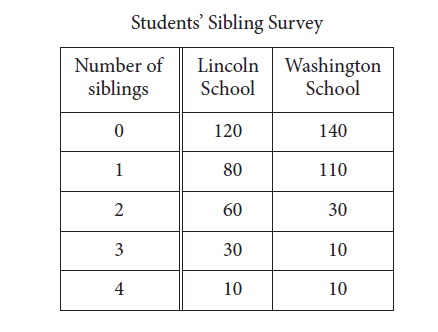
There are a total of 2,400 students at Lincoln School and 3,300 students at Washington School.
Based on the survey data, which of the following most accurately compares the expected total number of students with 4 siblings at the two schools?View SolutionAnswer the questions on the basis of the information given below: Coach John sat with the score cards of Indian players from the 3 games in a one-day cricket tournament where the same set of players played for India and all the major batsman got out. John summarized the batting performance through three diagrams, one for each game. In each diagram, the three outer triangles communicate the number of runs scored by the three top scorers from India, where K, R, S,V and Y represent Kaif, Rahul, Saurav, Virender, and Yuvraj respectively. The middle triangle in each diagram denotes the percentage of total score that was scored by the top three Indian scorers in that game. No two players score the same number of runs in the same game. John also calculated two batting indices for each player based on his scores in the tournament, the R-index of a batsman is the difference between his highest and lowest scores in the 3 games while the M-index is the middle number, if his scores are arranged in a non-increasing order.

How many players among those listed definitely scored less than Yuvraj in the tournament?View SolutionAnswer the questions on the basis of the information given below: Coach John sat with the score cards of Indian players from the 3 games in a one-day cricket tournament where the same set of players played for India and all the major batsman got out. John summarized the batting performance through three diagrams, one for each game. In each diagram, the three outer triangles communicate the number of runs scored by the three top scorers from India, where K, R, S,V and Y represent Kaif, Rahul, Saurav, Virender, and Yuvraj respectively. The middle triangle in each diagram denotes the percentage of total score that was scored by the top three Indian scorers in that game. No two players score the same number of runs in the same game. John also calculated two batting indices for each player based on his scores in the tournament, the R-index of a batsman is the difference between his highest and lowest scores in the 3 games while the M-index is the middle number, if his scores are arranged in a non-increasing order.

Which of the players had the best M-index from the tournament?View Solution

