The temperature of patient, admitted in a hospital with typhoid fever, taken at different times of the day are given below. Draw the temperature-time graph to represent the data: Time (in hours), 6:00, 8:00, 10:00, 12:00, 14:00, 16:00, 18:00 Temp. (in 0F): , 102, 100, 99, 103, 100, 102, 99
Step by step video & image solution for The temperature of patient, admitted in a hospital with typhoid fever, taken at different times of the day are given below. Draw the temperature-time graph to represent the data: Time (in hours), 6:00, 8:00, 10:00, 12:00, 14:00, 16:00, 18:00 Temp. (in \ ^0F): , 102, 100, 99, 103, 100, 102, 99 by Maths experts to help you in doubts & scoring excellent marks in Class 8 exams.
Updated on:21/07/2023Topper's Solved these Questions
Similar Questions
Draw the velocity-time graph from the following data: Time (in hours), 7:00, 8:00, 9:00, 10:00, 11:00, 12:00, 14:00, 14:00 Speed in km/hr, 30, 45, 60, 50, 70, 50, 40, 45
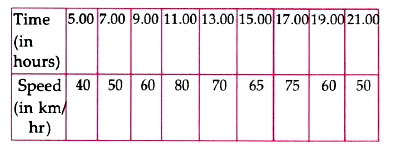
View SolutionA car is going for a long journey of 16 hours, 4. starting at 5:00 hrs. The speeds of the car at different hours are given below: Draw a velocity-time graph for the above data.

View Solution
Knowledge Check
500 mL of NH3 contain 6.00×10²³ molecules at a certain temperature and pressure. How many molecules are present in 100 mL of CO2 at same temperature and pressure?
A6×1023B1.5×1021C1.2×1023DNone of these
Draw the temperature-time graph in each of the following cases: Time (in hours:), 7:00, 9:00, 11:00, 13:00, 15:00, 17:00, 19:00, 21:00 Temperature 0F) ∈ , 100, 101, 104, 102, 100, 99, 100, 98 (ii) Time (in hours), 8:00, 10:00, 12:00, 14:00, 16:00, 18:00, 20: Temperature ( 0F) in, 100, 101, 104, 103, 99, 98, 100
View SolutionA car is going for a long journey of 16 hours, starting at 5:00 hrs. The speeds of the car at different hours are given below:
Time (in hours):, 5:00, 7:00, 9:00, 11:00, 13:00, 15:00, 17:00, 19:00, 21:00
Speed (in km/hour):, 40, 50, 60, 80, 70, 65, 75, 60, 50
Draw a velocity-time graph for the above data:
View SolutionA 10.0 litre container is filled with a gas to a pressure of 2.00 atm at 0∘C. At what temperature will the pressure inside the container be 2.50 atm ?
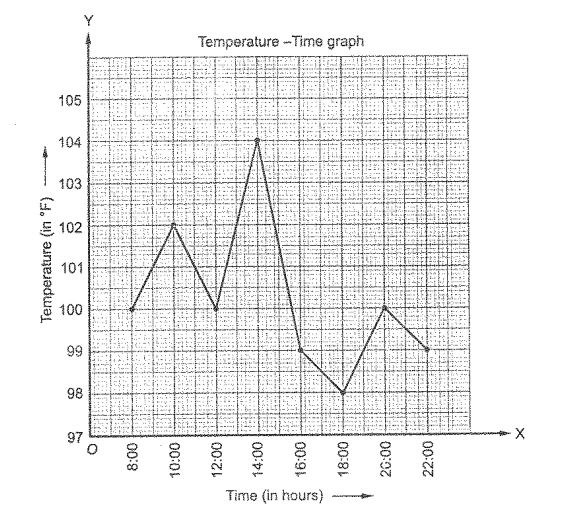
View SolutionGiven below is the temperature chart of a patient.

Find the temperature of the patient at 12:00 hours and 18:00 hours.
At what time is the temperature (ii) highest? (ii) lowest?
View SolutionFollowing table gives the temperature at 12 : 00 noon on seven successive days in a city:

Draw a line graph.
View SolutionHow many times are the hour hand and the minute hand of a clock at right angles during their motion from 1.00 p.m. to 10.00 p.m.? (a) 9 (b) 10 (c) 18 (d) 20
View SolutionThe temperature and pressure in the Sun's atmosphere are 2.00×10⁶ K and 0.0300 Pa. Calculate the rms speed of free electrons (mass 9.11×10⁻³¹ kg) there, assuming they are an ideal gas.
View Solution