The maximum temperature on 10 days of June,
2002, in Delhi is given below:

Draw a temperature-time graph for the above data
Video Solution
|
Answer
Step by step video & image solution for The maximum temperature on 10 days of June, 2002, in Delhi is given below: Draw a temperature-time graph for the above data by Maths experts to help you in doubts & scoring excellent marks in Class 8 exams.
Updated on:21/07/2023Topper's Solved these Questions
Similar Questions
Knowledge Check
Day time temperature of moon is
A60∘CB70∘CC90∘CD110∘CDay time temperature of moon is
A60∘CB70∘CC90∘CD110∘CMaximum temperature of the day occurs generally
AIn the afternoonBWhen the sun risesCWhen the sun setsDIn the evening
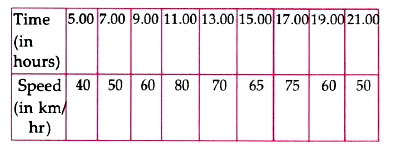
A car is going for a long journey of 16 hours, 4. starting at 5:00 hrs. The speeds of the car at different hours are given below: Draw a velocity-time graph for the above data.

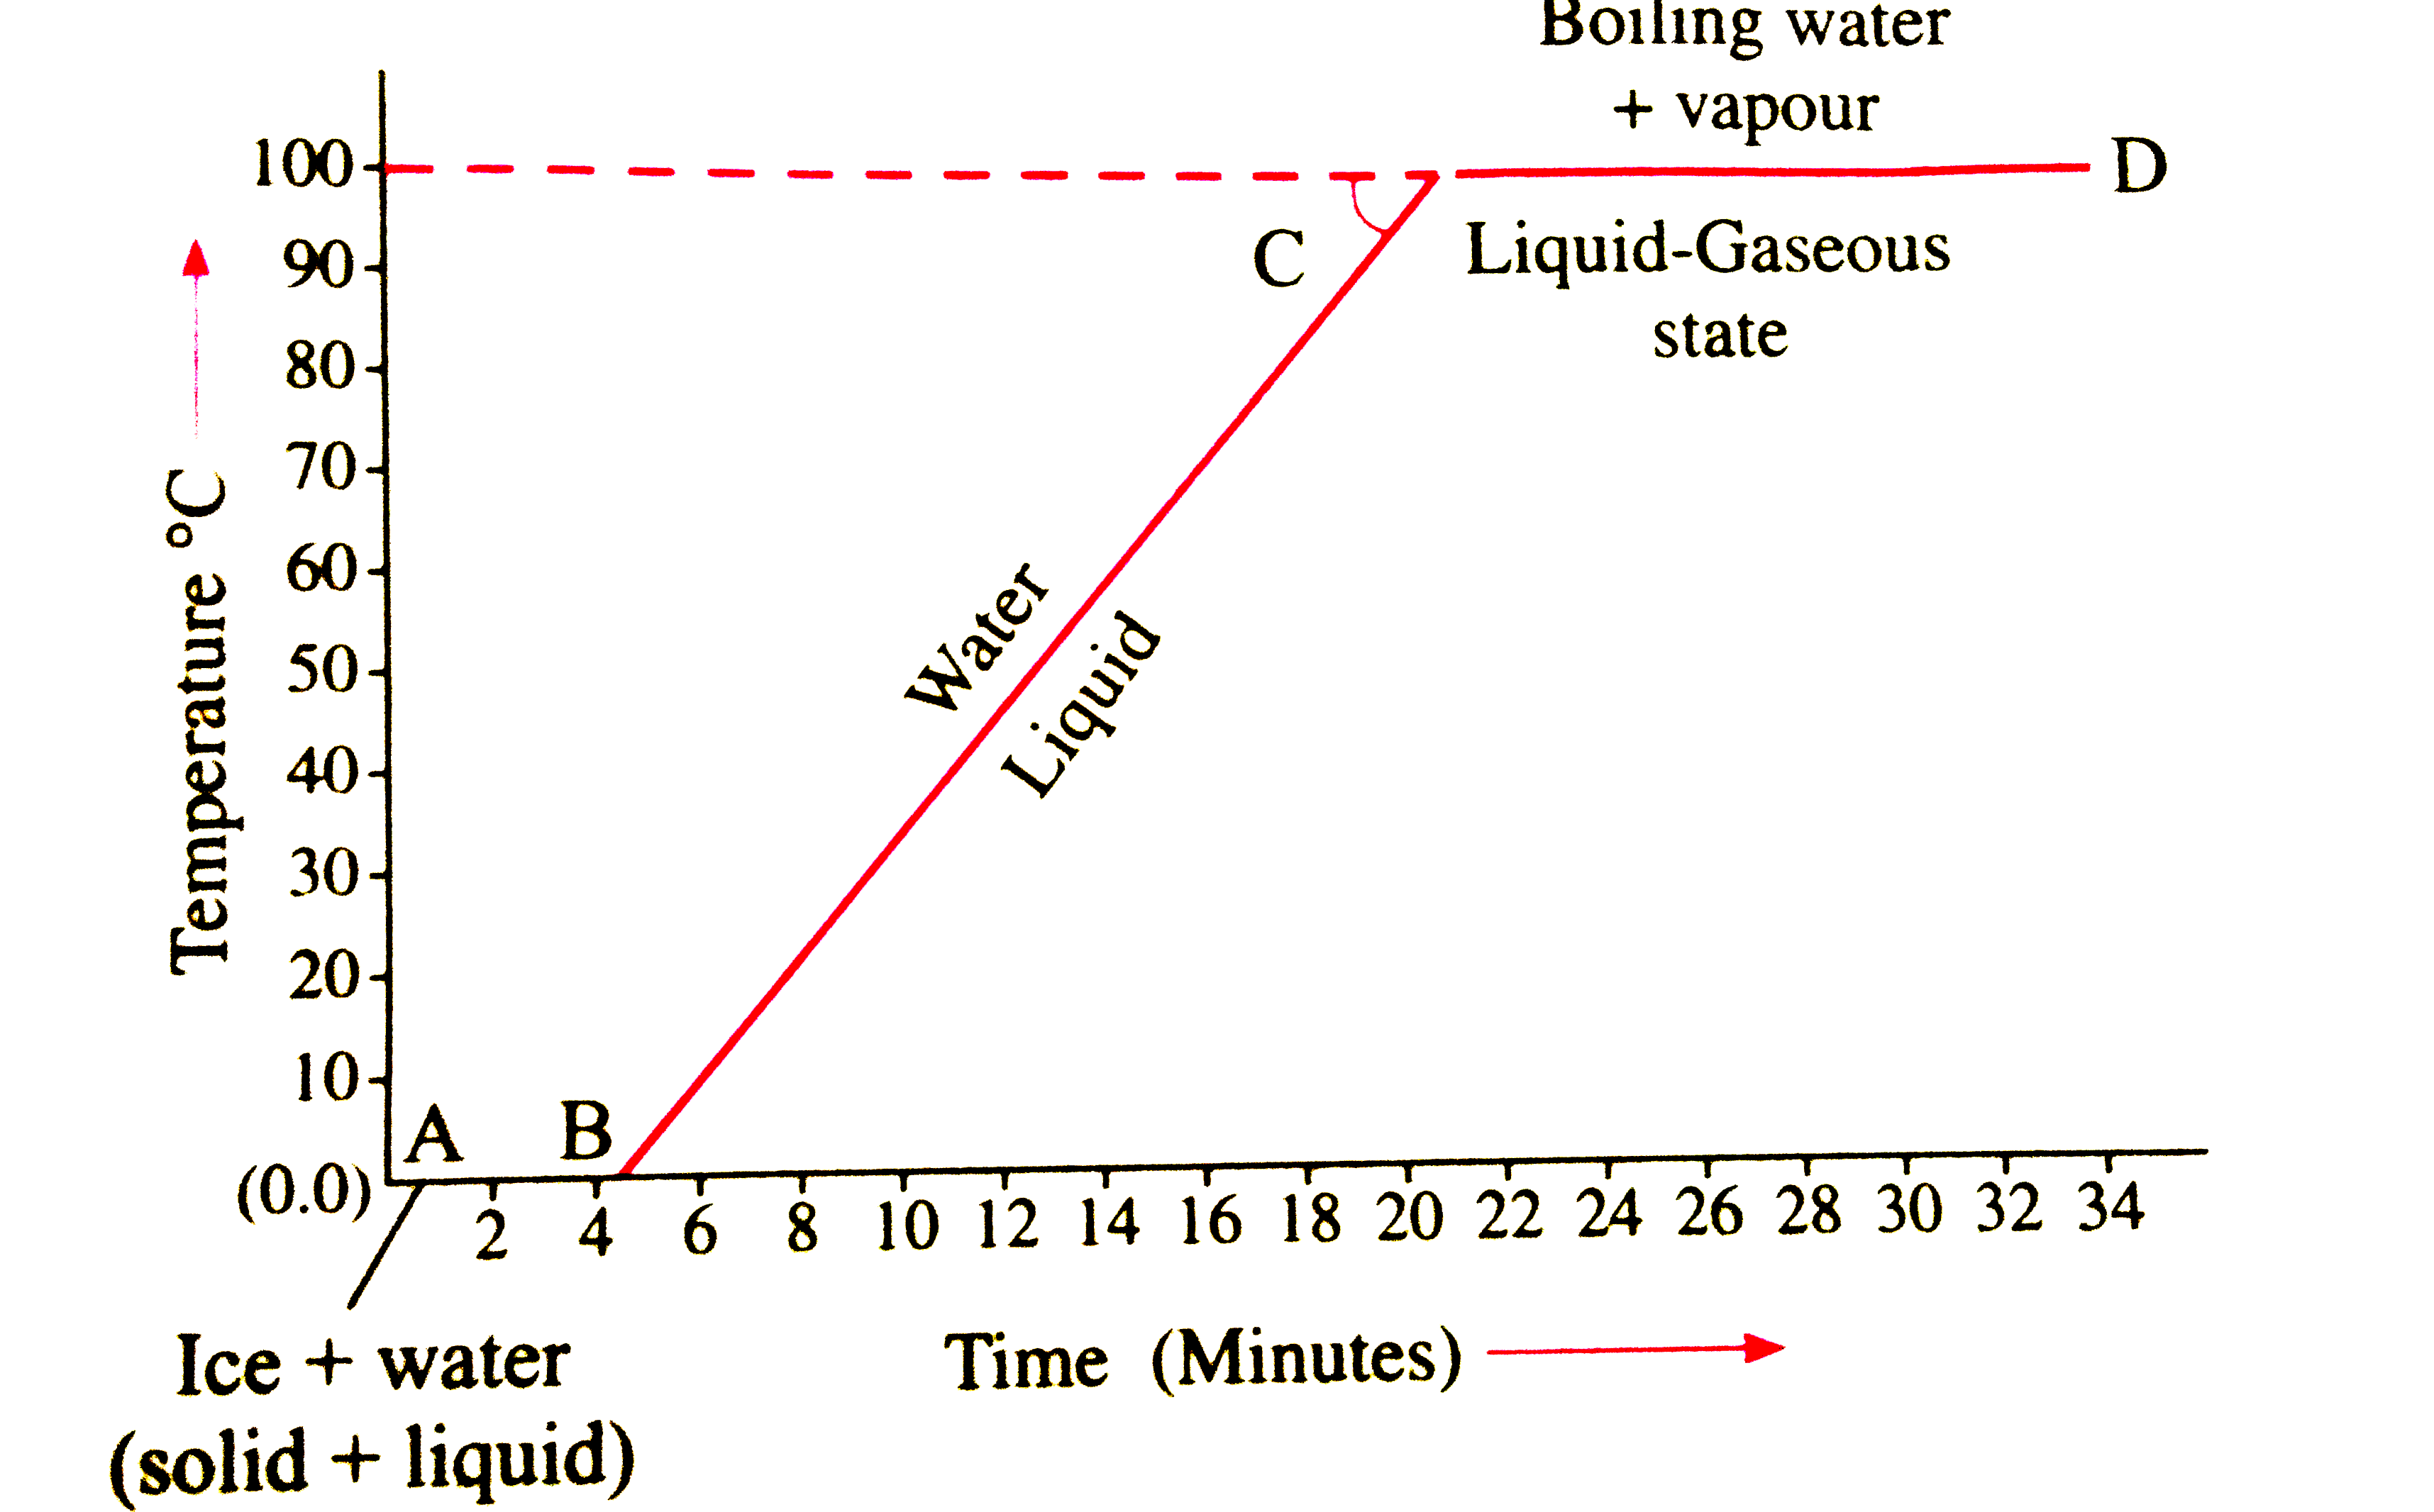
View SolutionExplain the following temperature Vs. time graph:

View SolutionThe expenditure of a family of different heads in a month is given below

Draw a bar graph to represent the data above.
View SolutionDraw a graph of temperature versus time.
View SolutionDraw a graph of temperature versus time.
View Solution
