Which of the following is the graph between the height (h) of a projectile and time (t), when it is projected from the ground
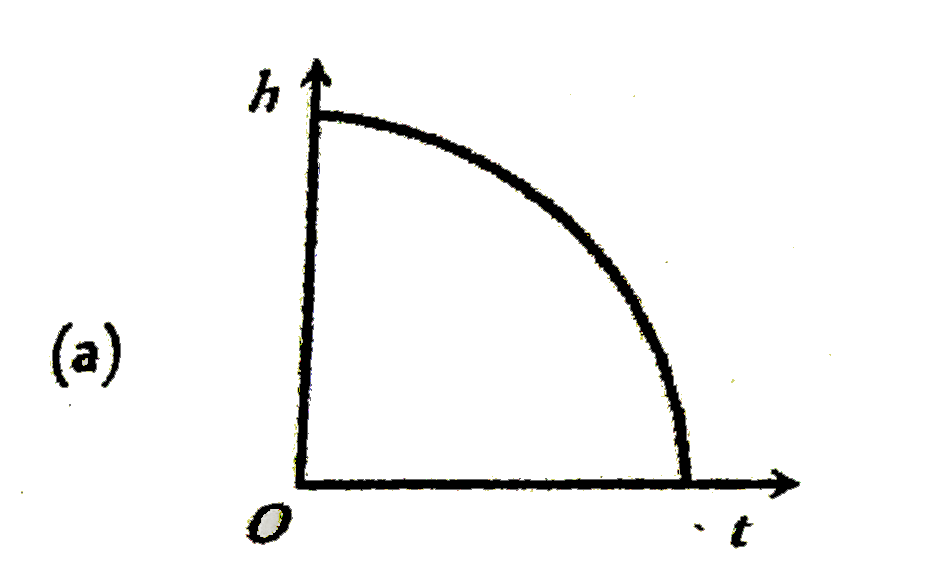
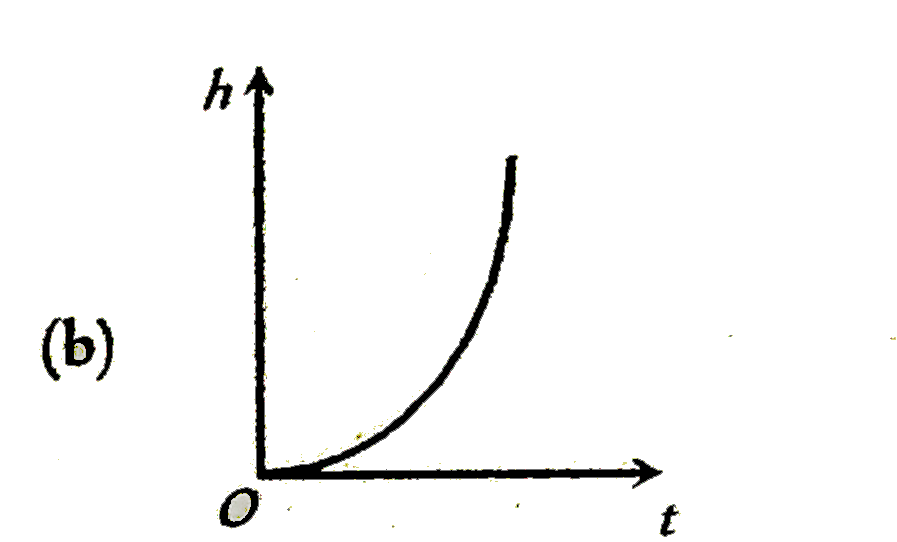
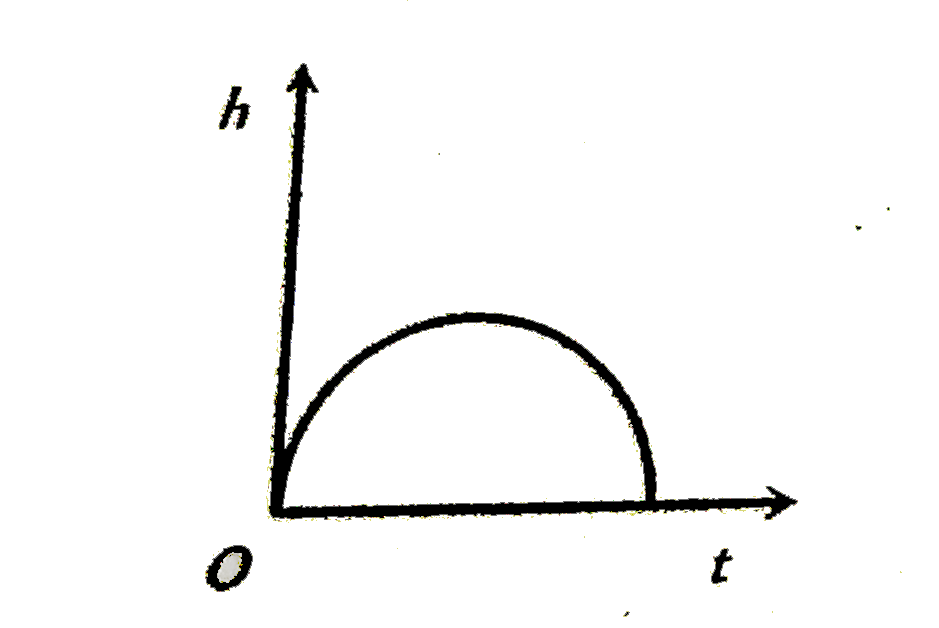
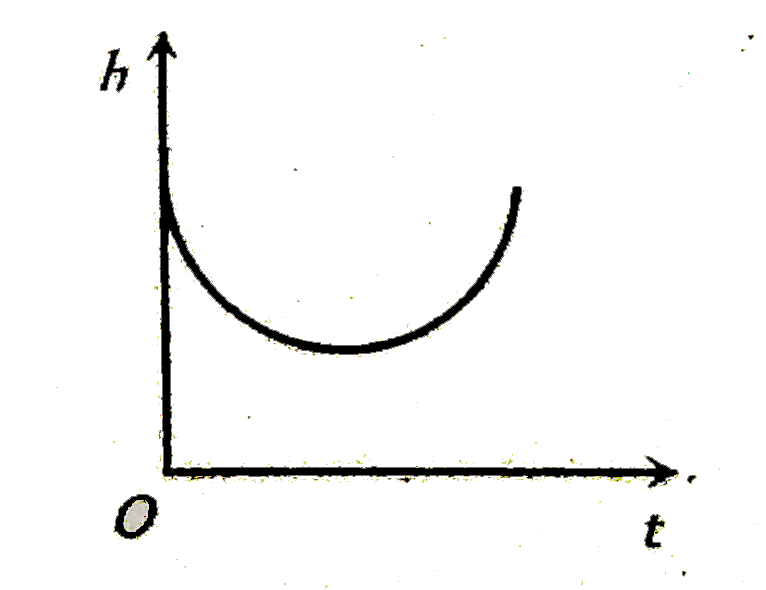
The correct Answer is:C
Step by step video, text & image solution for Which of the following is the graph between the height (h) of a projectile and time (t), when it is projected from the ground by Physics experts to help you in doubts & scoring excellent marks in Class 11 exams.
Updated on:21/07/2023Topper's Solved these Questions
Similar Questions
Two projectile are projected simultaneously from a point on the ground "O" and an elevated position "A" respectively as shown in the figure. If collision occurs at the point of return of two projectiles on the horizontal surface, then find the height of "A" above the ground and the angle at which the projectile "O" at the ground should be projected.
View SolutionThe relation between the time of flight of projectile Tf and the time to reach the maximum height tm is
View Solution
Knowledge Check
Which of the following graph is correct between kinetic energy E, potential energy (U) and height (h) from the ground of the partical
A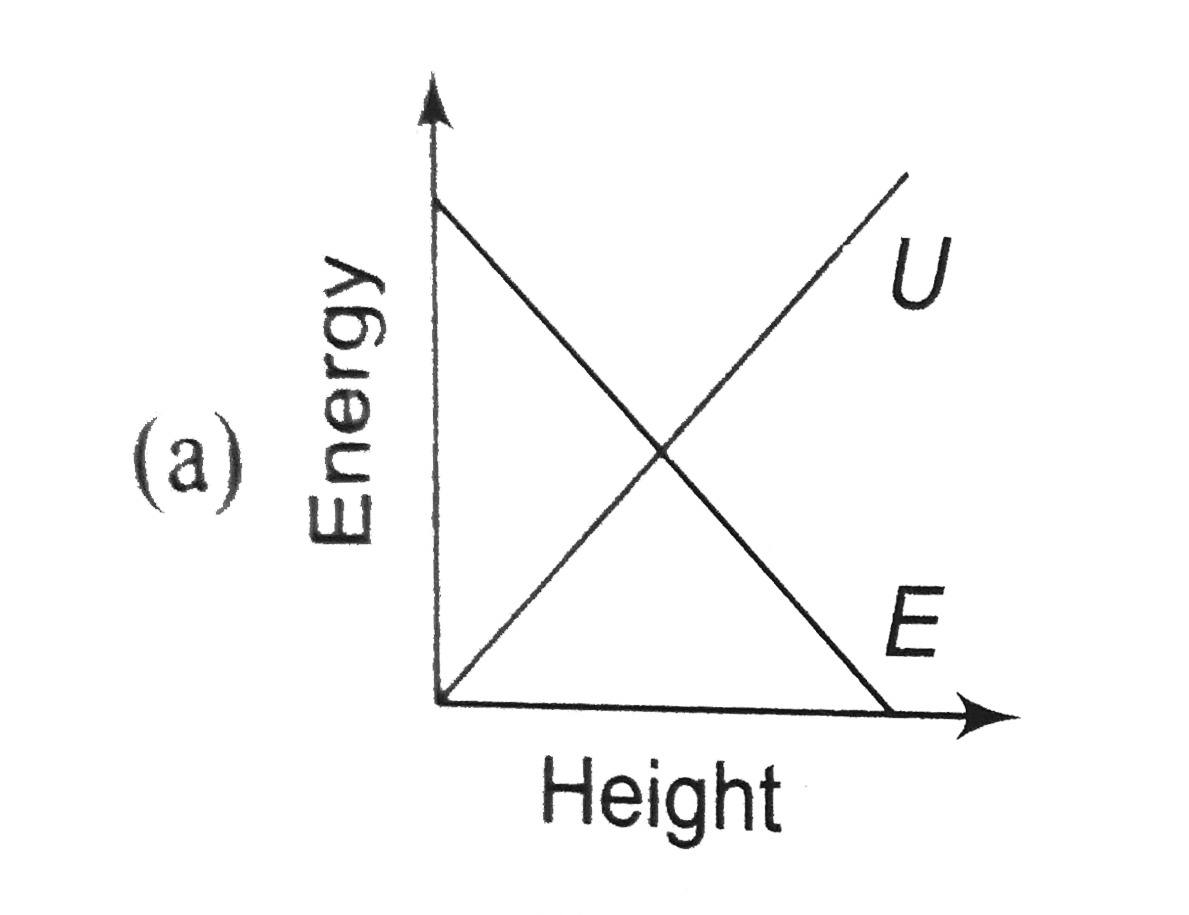 B
B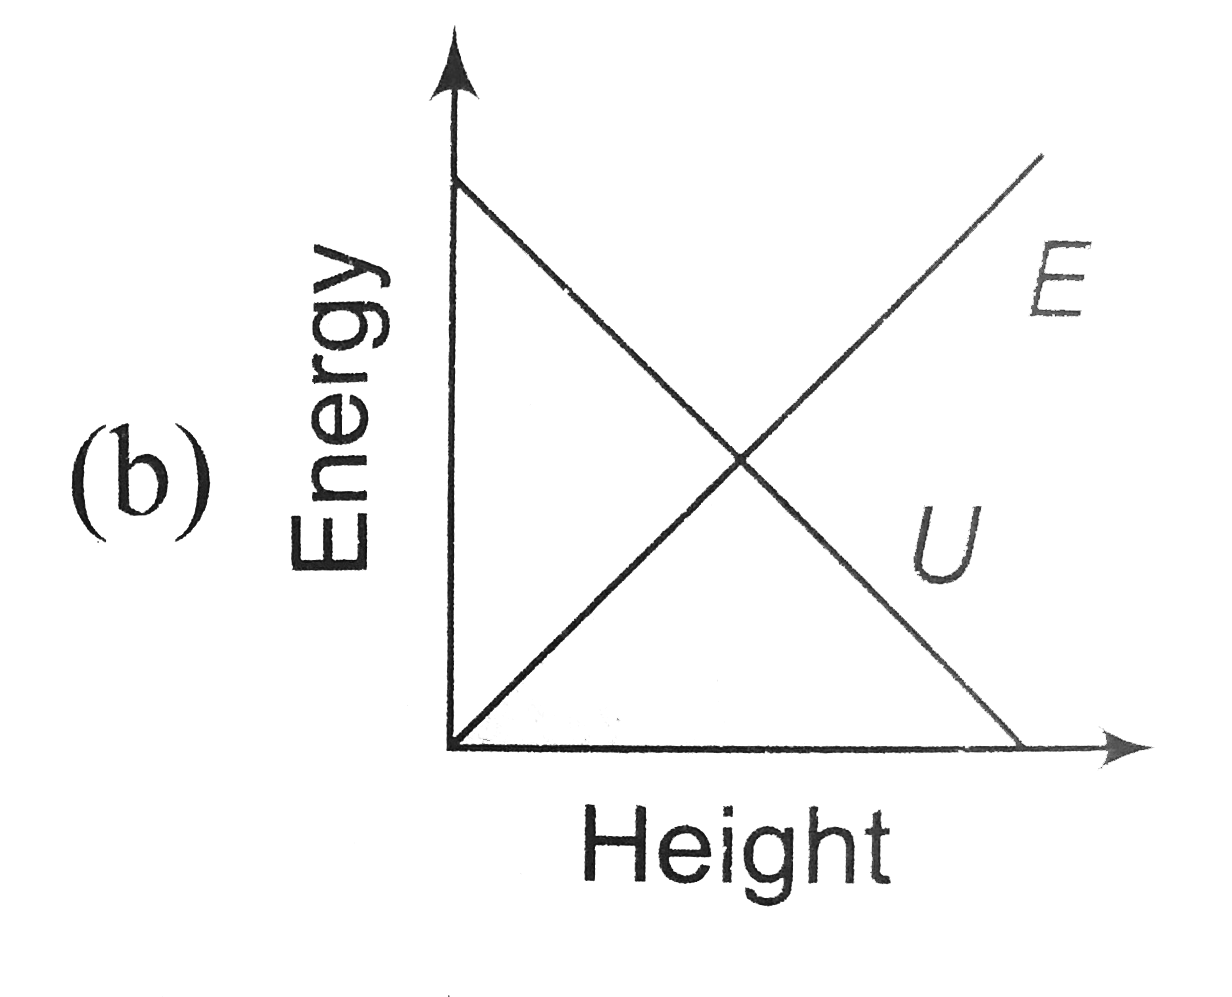 C
C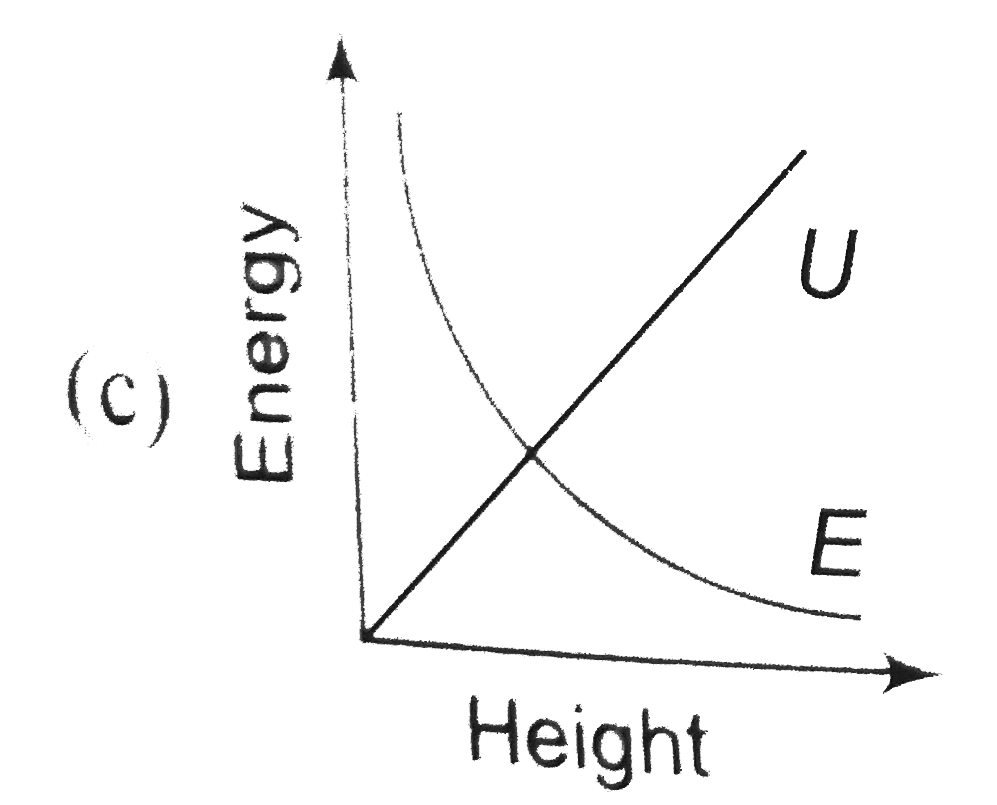 D
D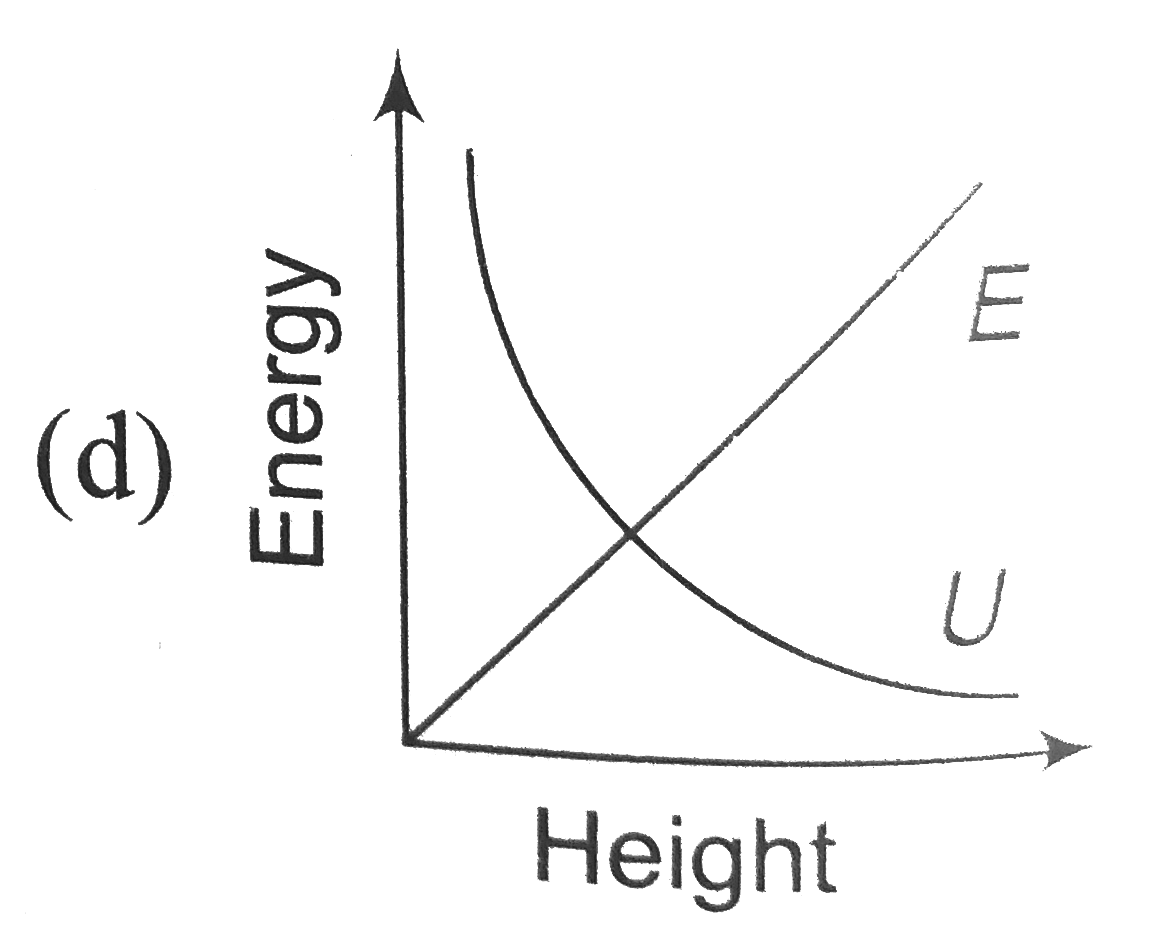
Which of the following graph is correct between kinetic energy E, potential energy (U) and height (h) from the ground of the partical
A B
B C
C D
D
The relation between the time of flight of projectile Tf and the time to reach the maximum height Tm is
ATf=2TmBTf=TmCTf=Tm2DTf=√2(Tm)
The horizontal range and the maximum height of a projectile are equal. The angle of projection of the projectile is
View SolutionA batsman hits a sixes and the ball touches the ground outside the cricket ground. Which of the following graph describes the variation of the cricket ball's vertical velocity v with time between the time t1 as it hits the bat and time t2 when it touches the ground?
View SolutionTwo projectiles are projected simultaneously from the top and bottom of a vertical tower of height h at angles 45∘ and 60∘ above horizontal respectively.Body strike at the same point on ground at distance 20m from the foot of the tower after same time.
The ratio of the speed of the projectile projected from the top and the speed of the projectile projected from the bottom of tower is
View SolutionA ball falls from a height ‘h’ and collides with the ground. Each time it collides, its velocity is halved. Which of the following graphs are correct? Here t, v and y represent time, velocity and height above ground respectively. (vertically upwards direction is taken as positive and ground as y = 0)
View SolutionA particle is dropped from a finite height H above the ground level under gravity . Due to air resistance acceleration of particle becomes a=g−kv in the direction of velocity. Where k= positive constant &v= speed of particle. Then which of the following graph(s) is / are possible (t0= time when particle touches the ground ):
View Solution