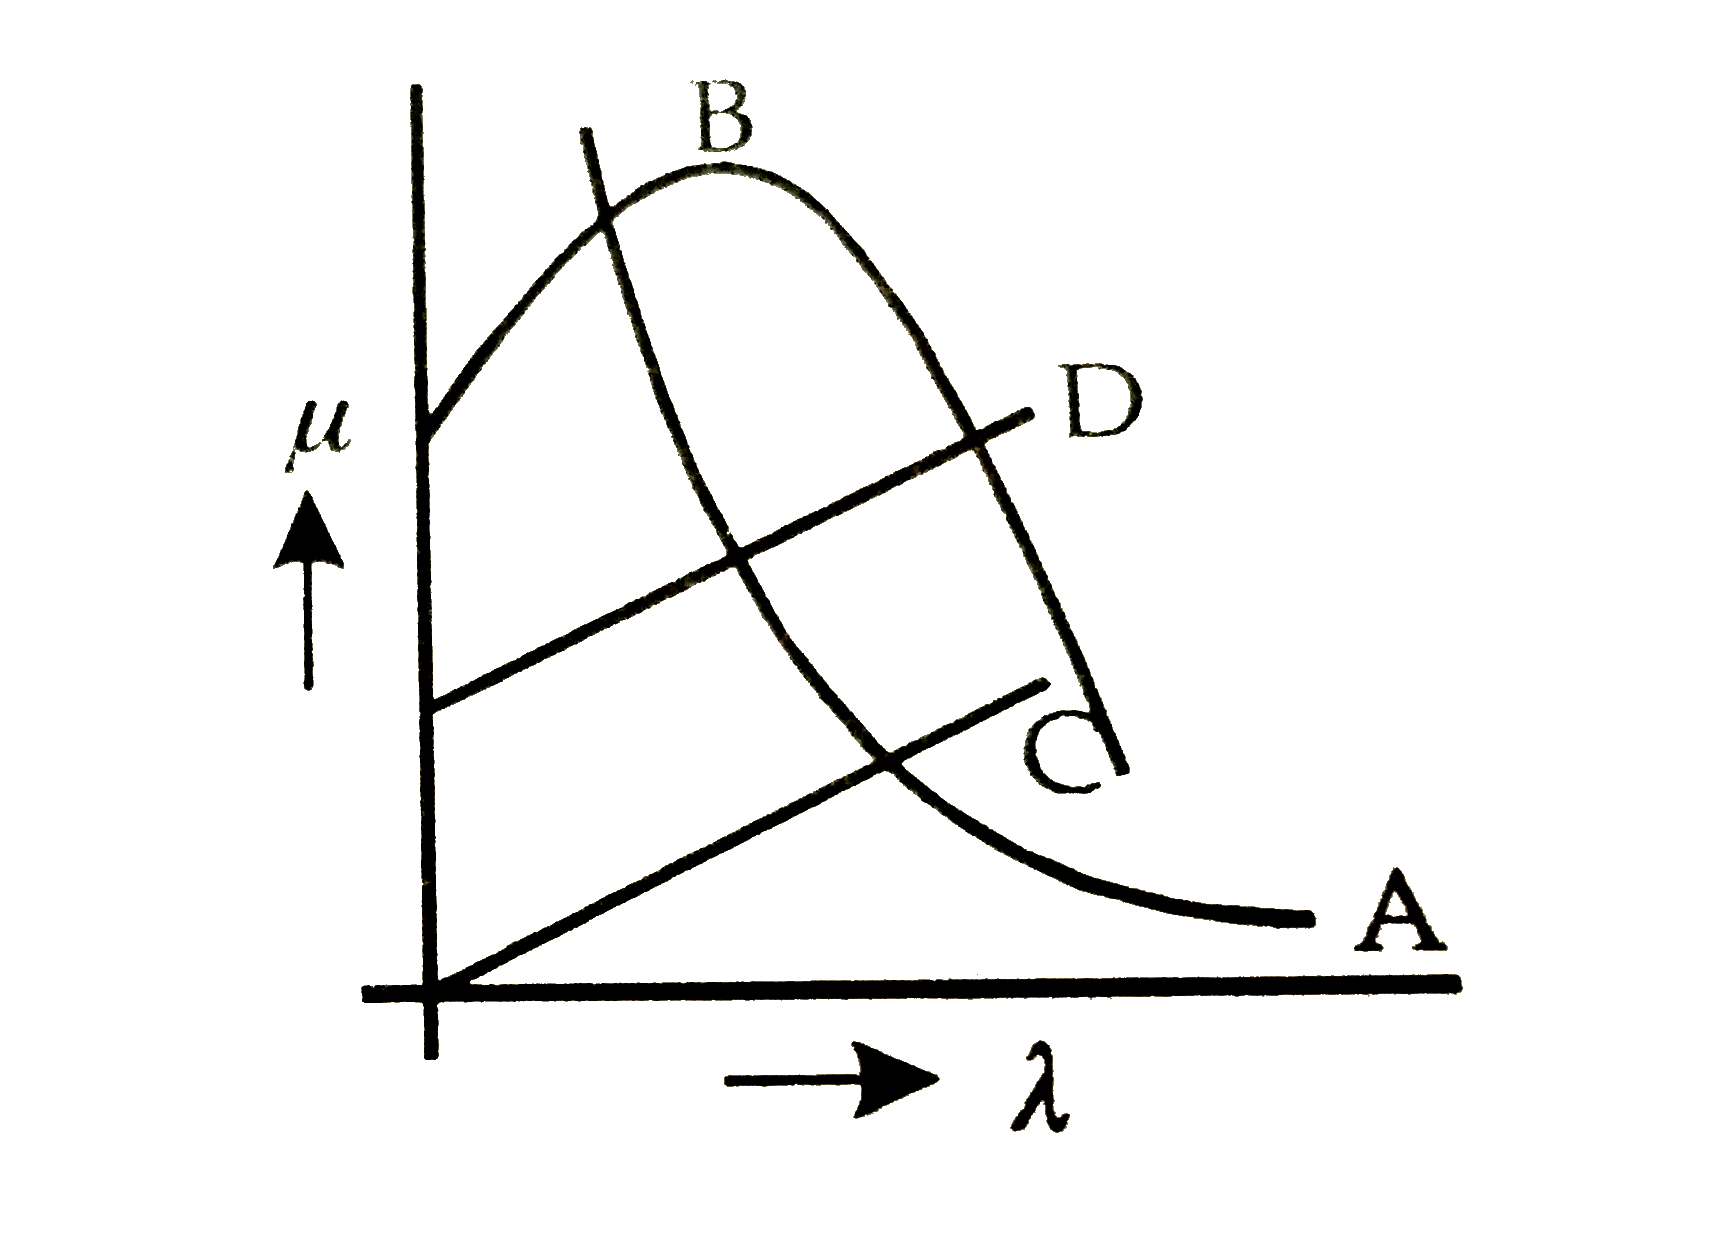
Which of the following graphs shows appropriate variation of refractive index μ with wavelength λ
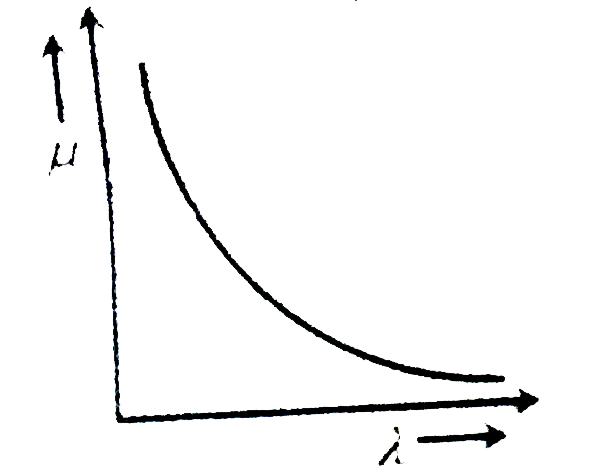
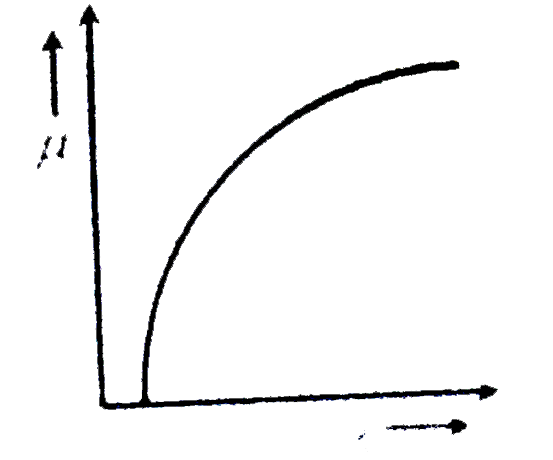
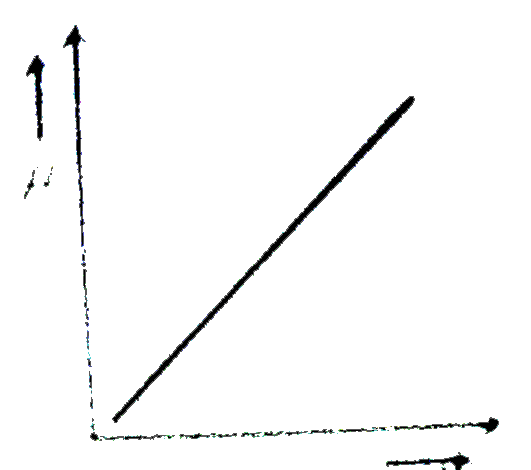
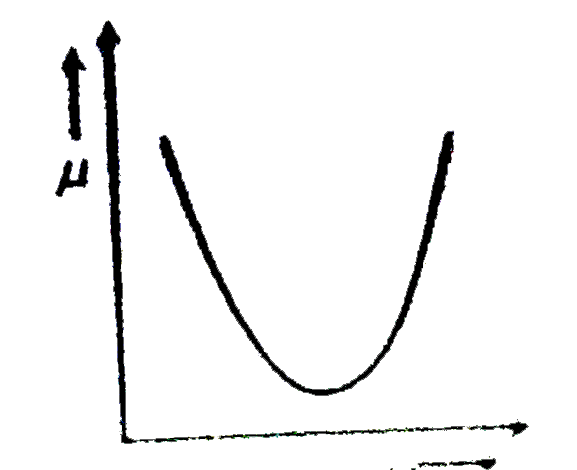
The correct Answer is:a
Step by step video, text & image solution for Which of the following graphs shows appropriate variation of refractive index mu with wavelength lambda by Physics experts to help you in doubts & scoring excellent marks in Class 12 exams.
Topper's Solved these Questions
- BOOK - ERRORLESS CHAPTER - RAY OPTICSEXERCISE - Refraction of Light at Plane Surfaces9videos
RAY OPTICS
- BOOK - ERRORLESS CHAPTER - RAY OPTICSEXERCISE - Refraction at Curved Surface8videos
RAY OPTICS
- BOOK - ERRORLESS CHAPTER - MAGNETISMEXERCISE - Assertion & Reason1videos
MAGNETISM
- BOOK - ERRORLESS CHAPTER - WAVE OPTICSEXERCISE - SET23videos
WAVE OPTICS
Similar Questions
Knowledge Check
- Question 1 - Select One
The correct curve between refractive index μ and wavelength λ will be
 A
A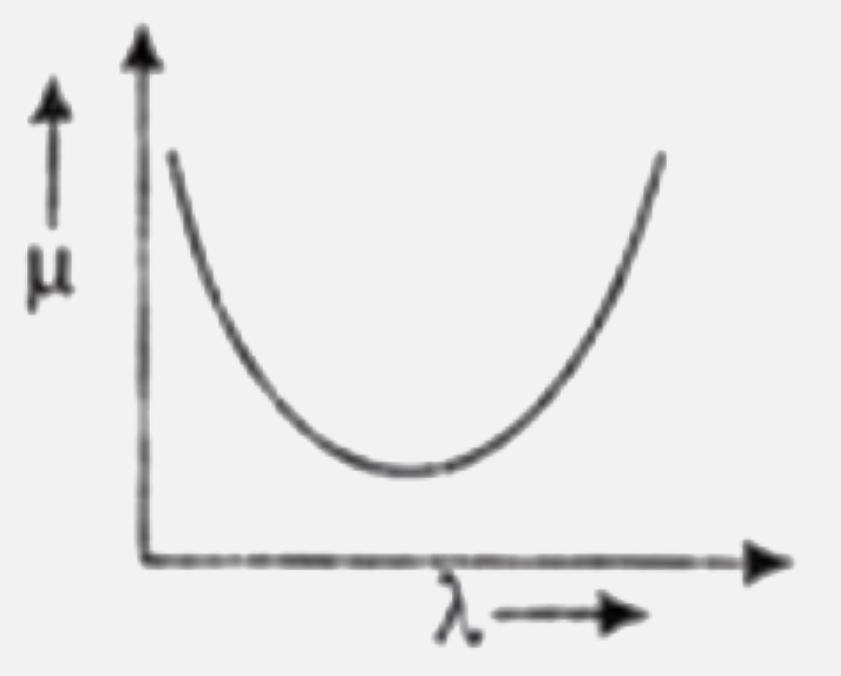 B
B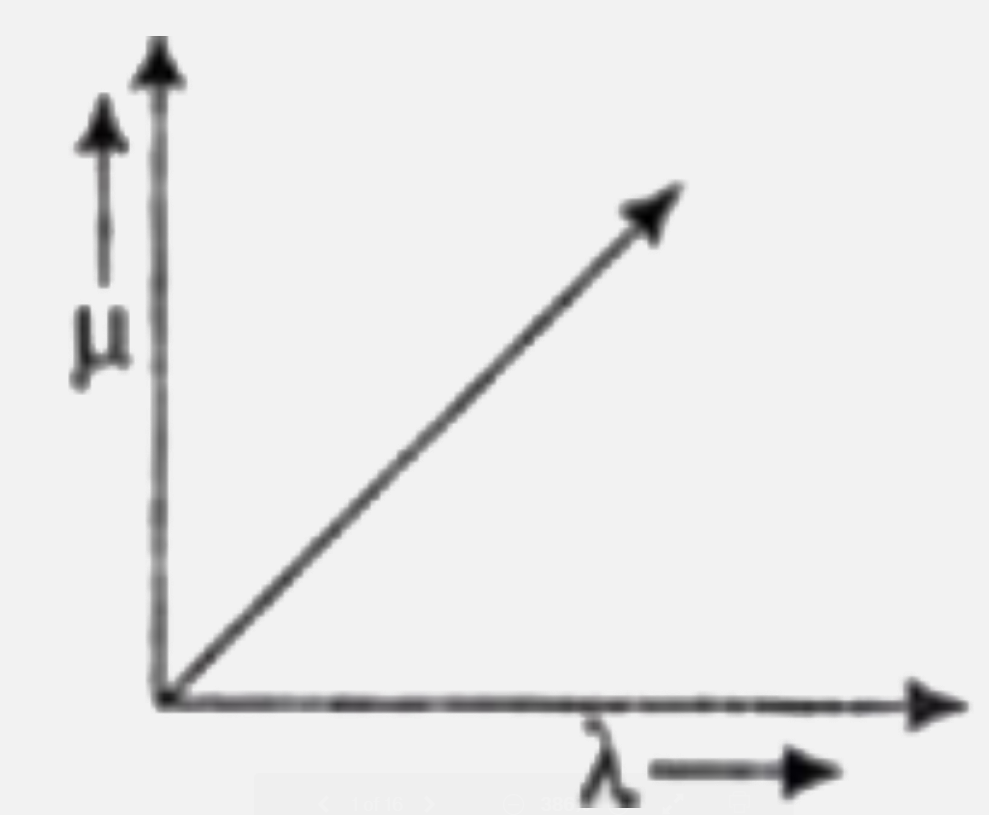 C
C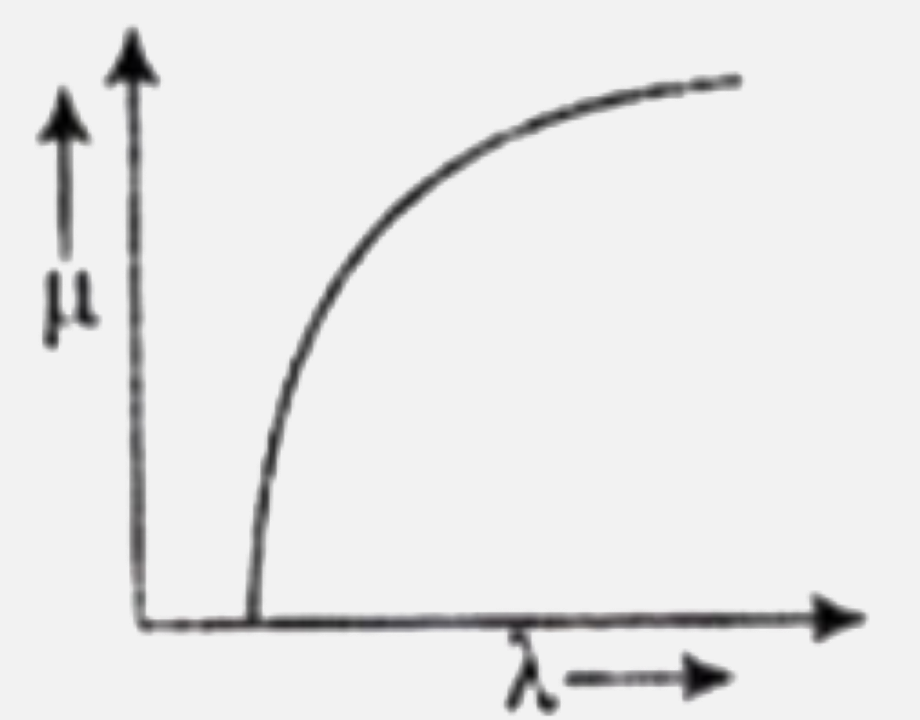 D
D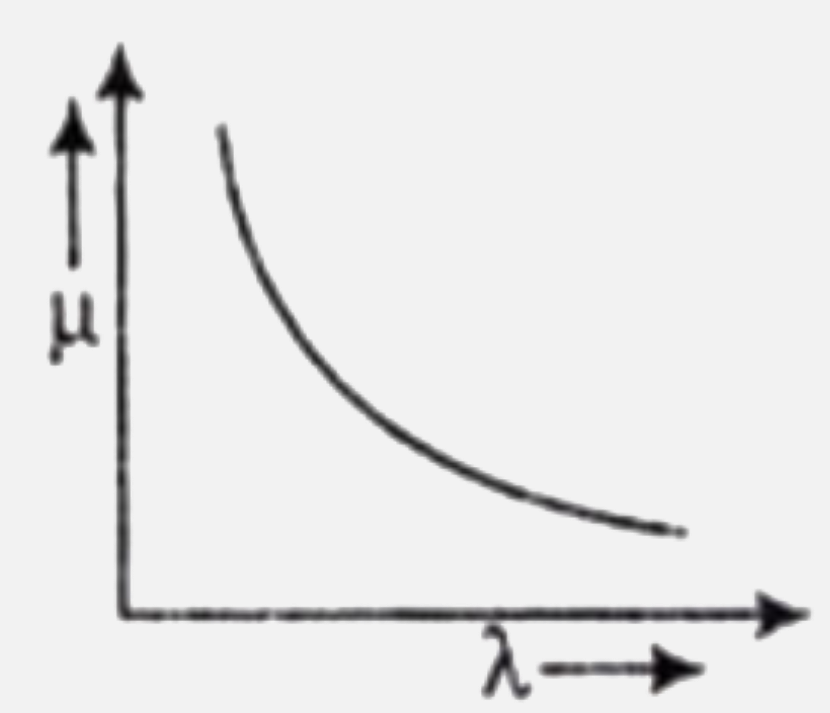
- Question 2 - Select One
Which of the following graphs shows variation between density of water and temperature?
A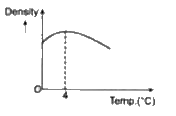 B
B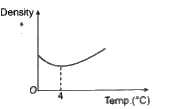 C
C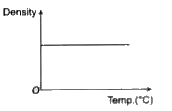 D
D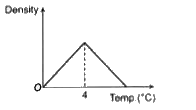
- Question 3 - Select One
Which of the following graphs shows the variation of de-Broglie wavelength with potential through which a particle of charge q and mass m is accelerated ?
A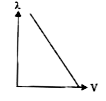 B
B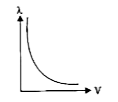 C
C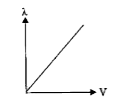 D
D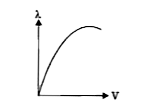
Which of the following is the graph showing stress-strain variation for elastomers ?
View SolutionWhich of the following graphs correctly represents the variation of particle momentum with associated de Broglie wavelength?
View SolutionWhich of the following graph represent the variation of particle momentum and associated de Broglie wavelength?
View SolutionMonochromatice light is refracted from air into glass of refractive index μ. The ratio of the wavelength of the incident and refracted waves in
View SolutionWhich graph shows how the energy E of a photon of light is related to its wavelengths (λ)?
View Solution

