A particle released from rest is falling through a thick fluid under gravity. The fluid exerts a resistive force on the particle proportional to the square of its speed. Which one of the following graphs best depicts the variation of its speed v with time t –


The correct Answer is:A
Step by step video, text & image solution for A particle released from rest is falling through a thick fluid under gravity. The fluid exerts a resistive force on the particle proportional to the square of its speed. Which one of the following graphs best depicts the variation of its speed v with time t – by Physics experts to help you in doubts & scoring excellent marks in Class 12 exams.
Topper's Solved these Questions
Similar Questions
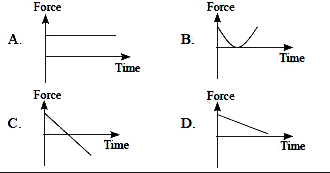
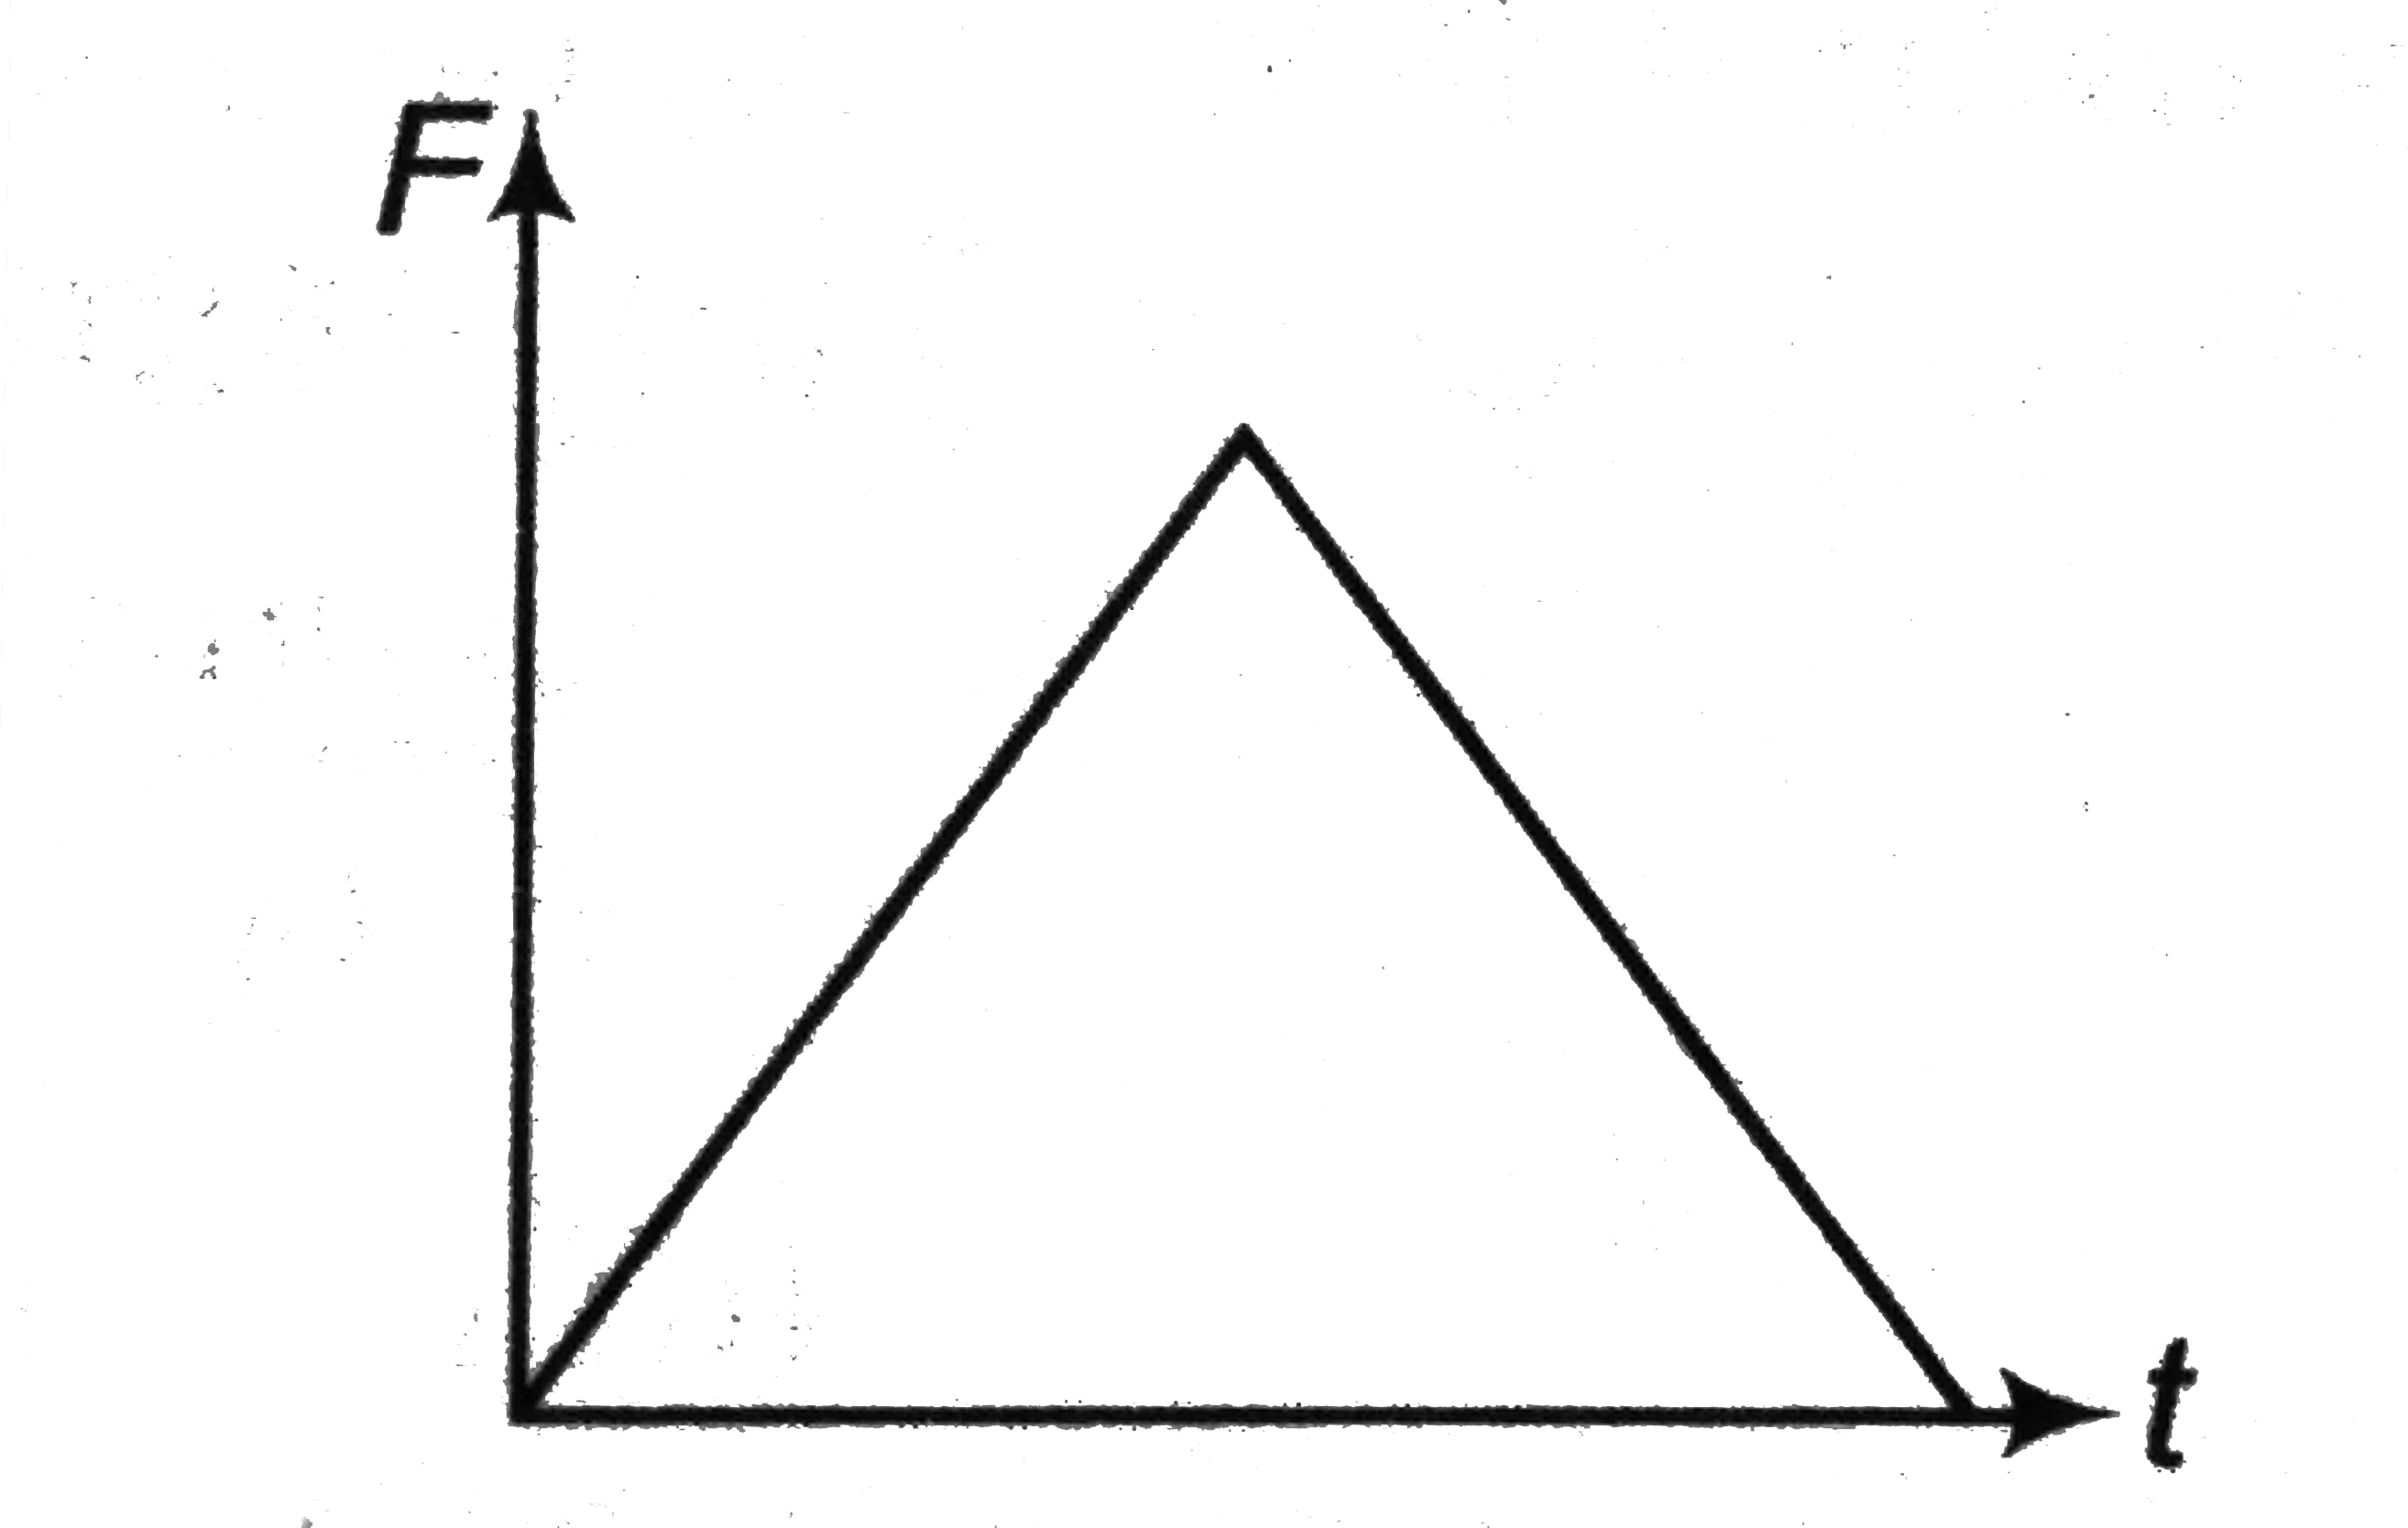
A force is applied to a cart moving along a horizontal track in the positive x direction. If the cart speeds up and then slows down, then which one of the following graphs best shows the variation of the force with time for the cart? Assume that friction is negligible.
 View Solution
A particle is moving in a circular path ofradius rat a constant speed v. Which one of the following graphs correctly represents its acceleration a?
View Solution
Knowledge Check
- Question 1 - Select One
The graph shown the variation with times t of the velocity v of an object . Which one of the following graphs best represents the variation of acceleration a of the object with time t?
 A
A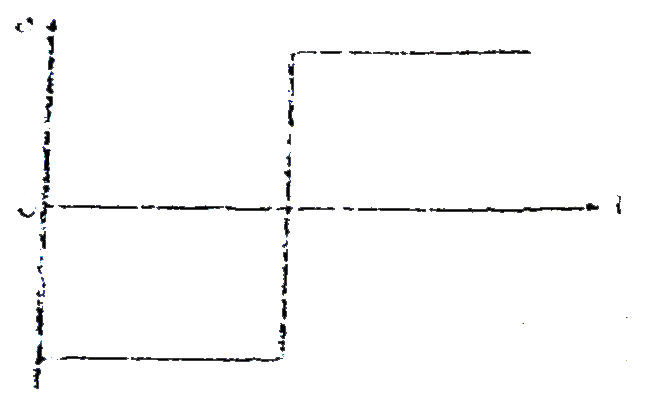 B
B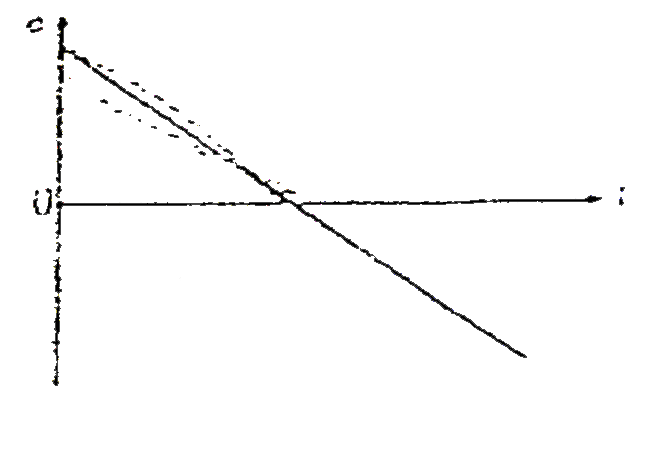 C
C D
D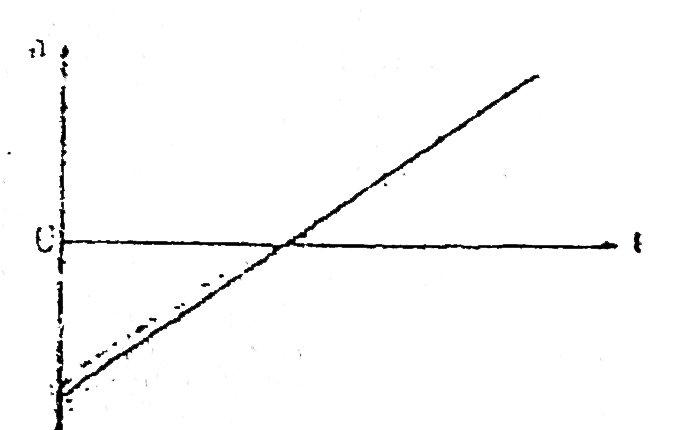
- Question 2 - Select One
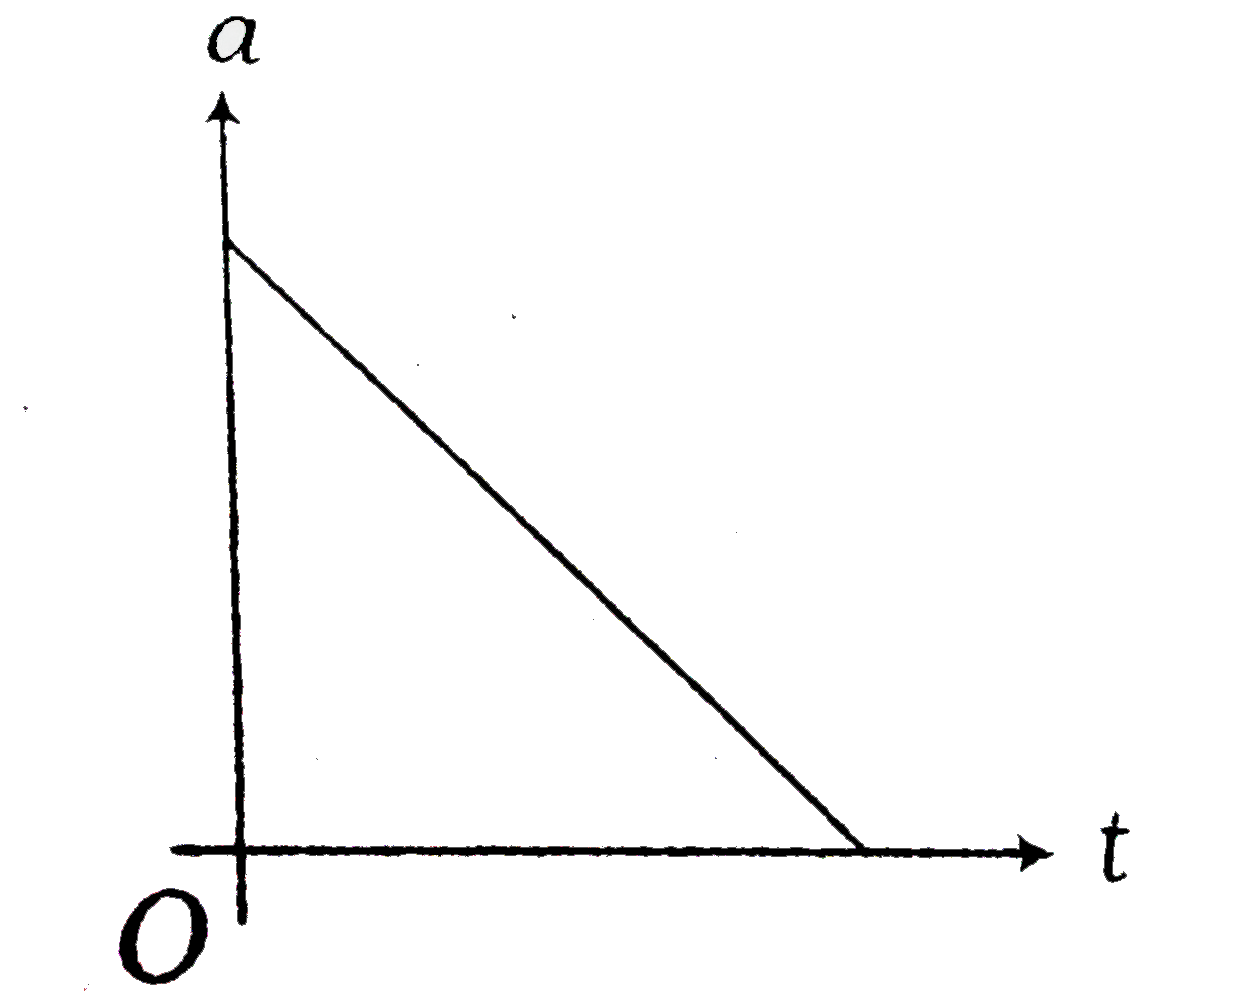
The acceleration (a)-time(t) graph for a particle moving along a straight from rest is shown in figur. Which of the following graph is the best representation of its velocity (v) with time (t) ?
 A
A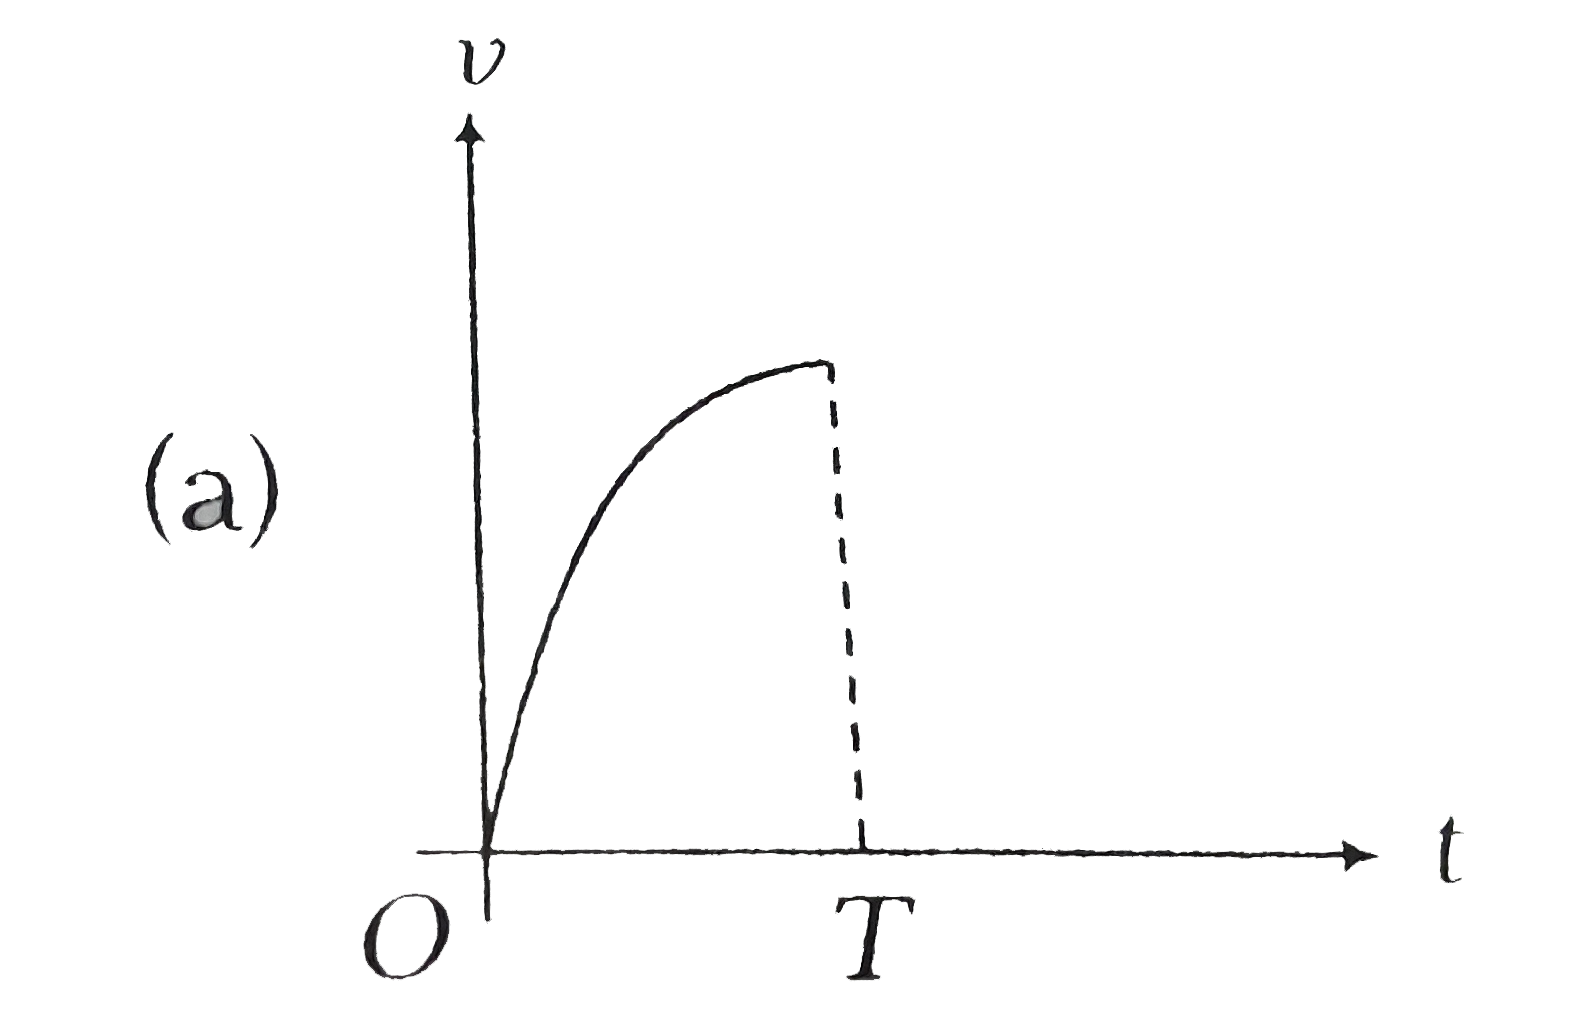 B
B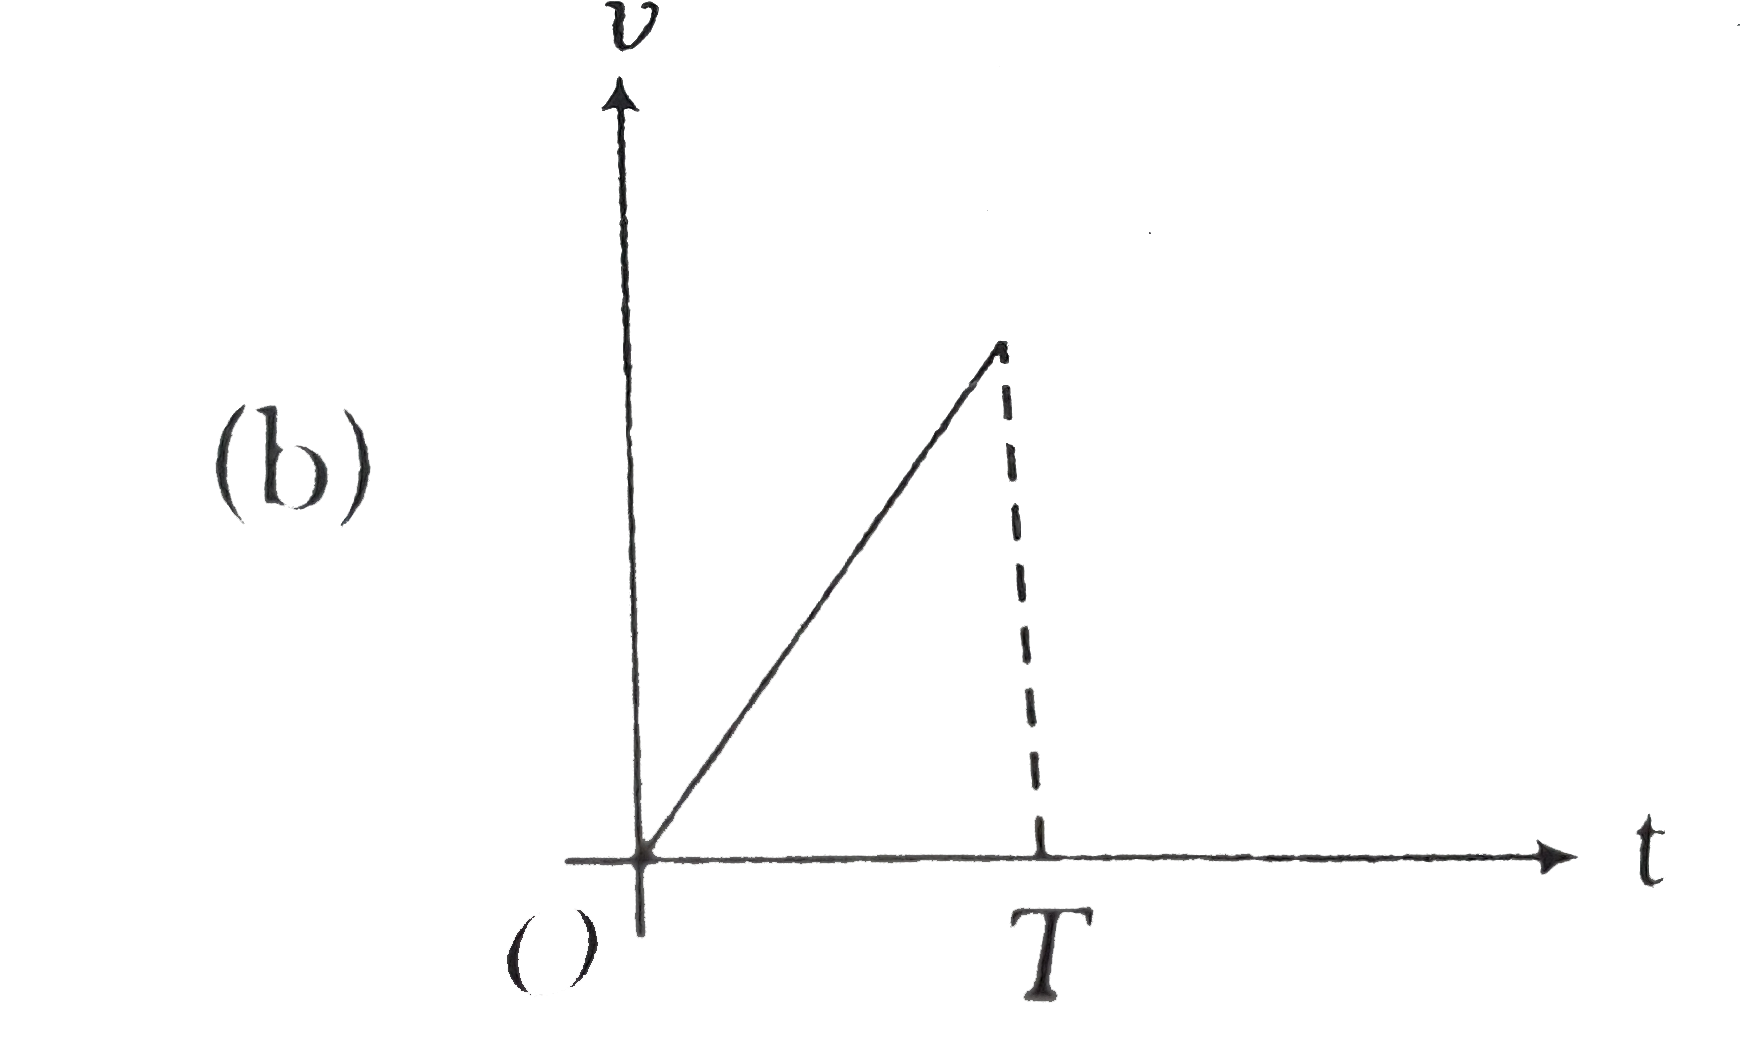 C
C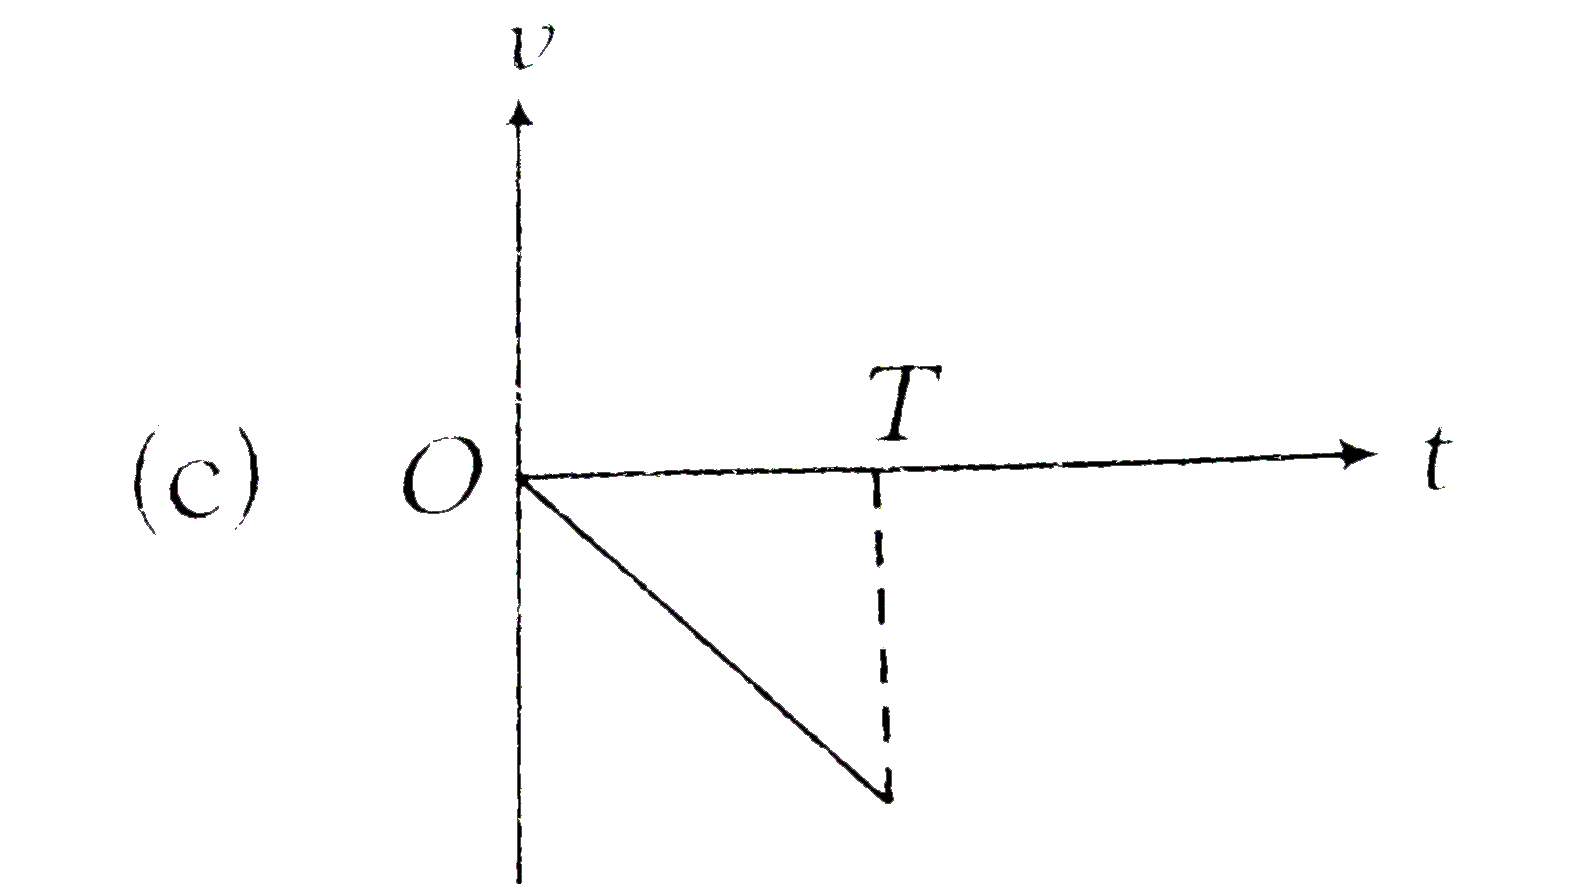 D
D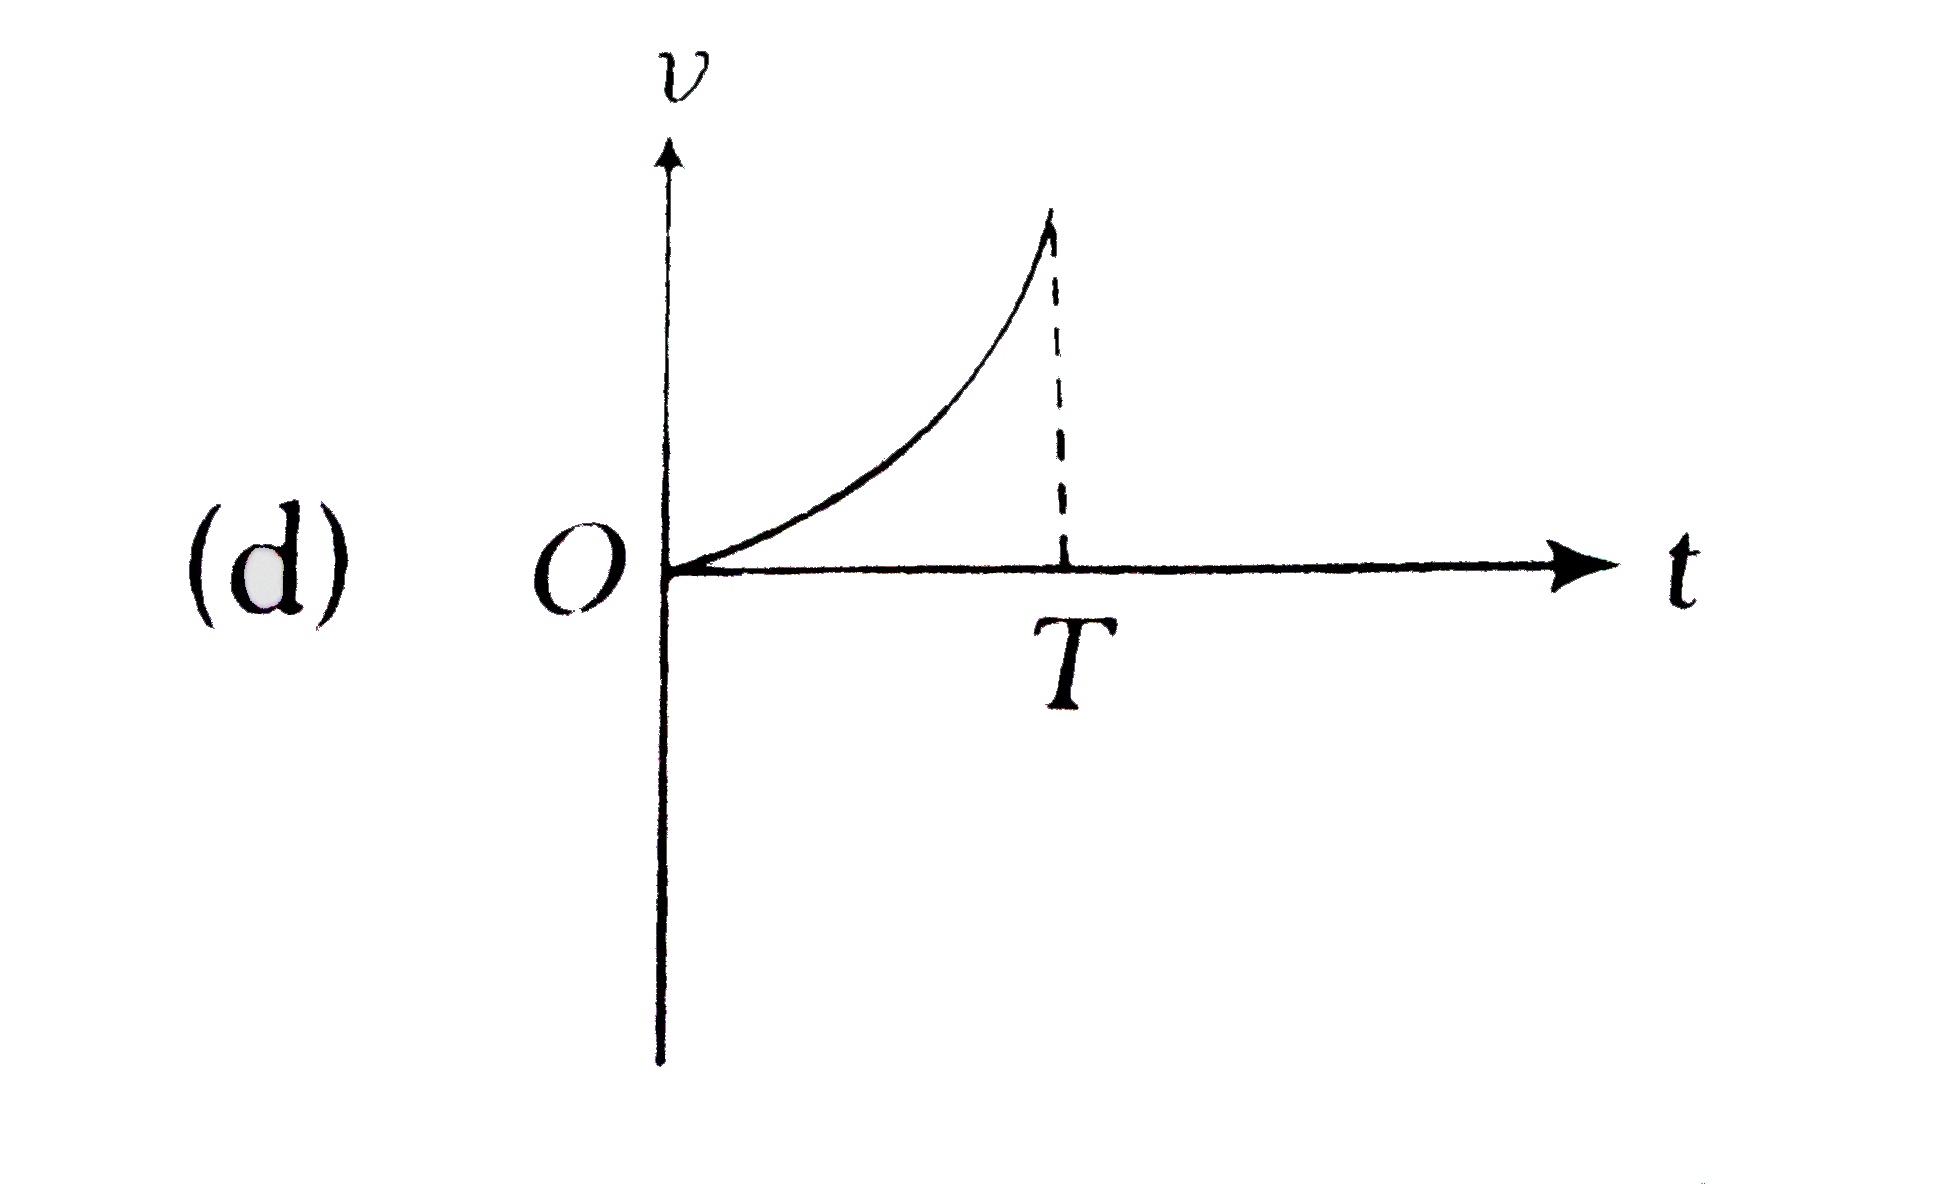
- Question 3 - Select One
A body is projected vertically upward from ground. If we neglect the effect of air, then which one of the following is the best representation of variation of speed (v) with time (t)?
A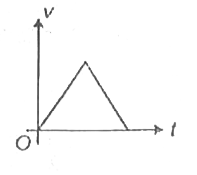 B
B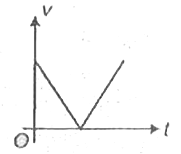 C
C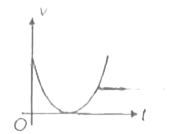 D
D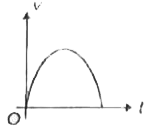
A body starting from the the rest moves along a straight line with constant acceleration. Which one of the following graphs represents the variation of speed(v) and distance(s)?
View SolutionA body starting from the rest moves along a straight line with constant acceleration .Which one of the following graphs represent the variation of speed (v) and distance (s) ?
View SolutionA tennis ball is released so that it falls vertically to the floor and bounces again. Taking velocity upwards as positive, which of the following graphs best represents the variation of its velocity v with time t?
View SolutionThe velocity v of a particle moving along x - axis varies with ist position (x) as v=α√x, where α is a constant. Which of the following graph represents the variation of its acceleration (a) with time (t)?
View SolutionThe net force acting on a particle moving along a straight line varies with time as shown in the diagram. Force is parallel to velocity. Which of the following graph is best representative of its speed with time? (Initial velocity of the particle is zero)
 View Solution

