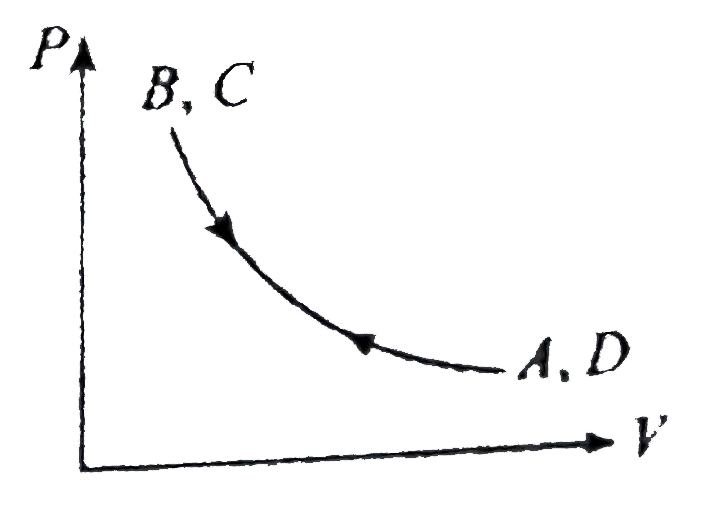
Density vs volume graph is shown in the figure . Find corresponding pressure vs temperature graph :
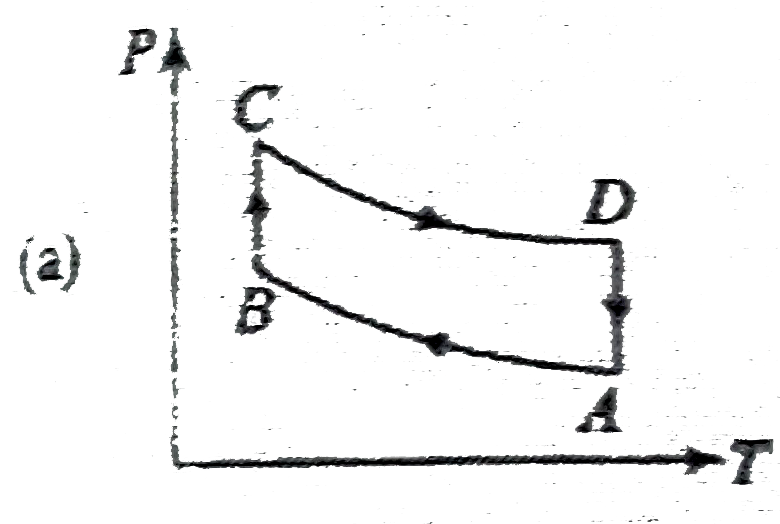
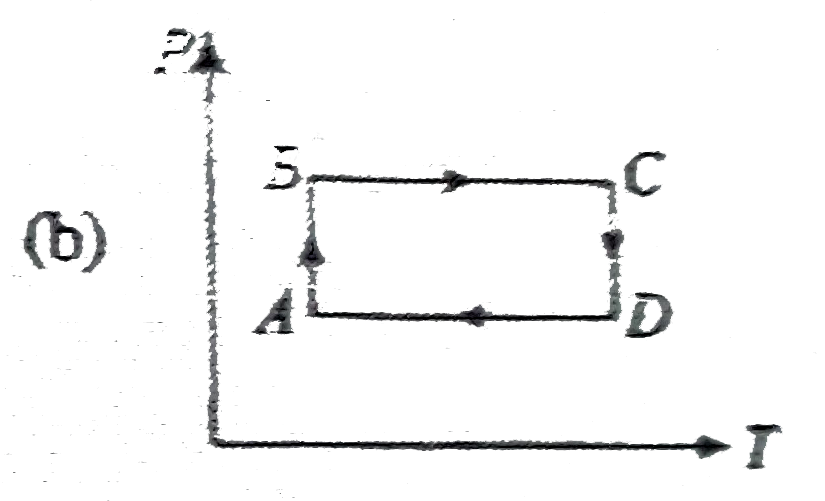
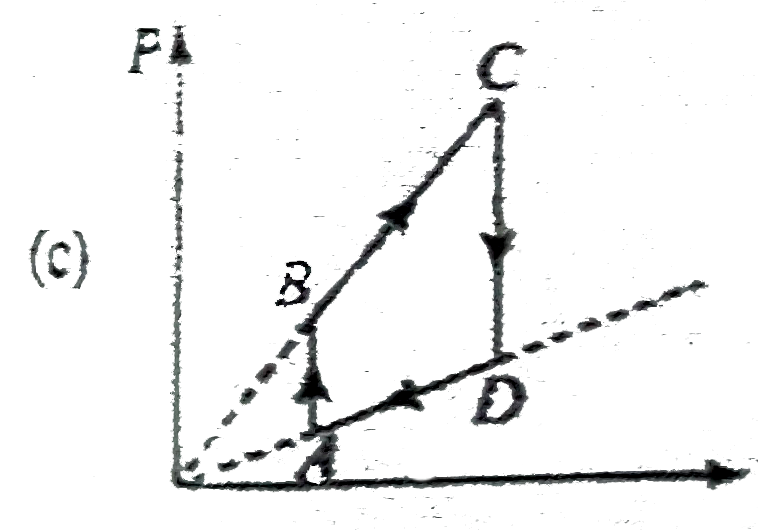
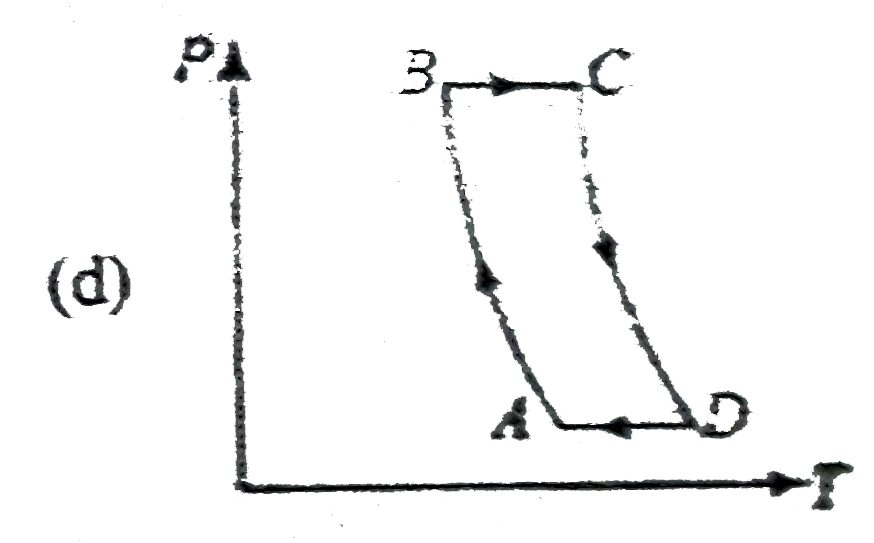
The correct Answer is:C
Step by step video, text & image solution for Density vs volume graph is shown in the figure . Find corresponding pressure vs temperature graph : by Physics experts to help you in doubts & scoring excellent marks in Class 11 exams.
Updated on:21/07/2023Topper's Solved these Questions
- KINETIC THEORY OF GASESBOOK - CENGAGE PHYSICSCHAPTER - KINETIC THEORY OF GASESEXERCISE - Comprehension Type
5 Videos
- KINETIC THEORY OF GASESBOOK - CENGAGE PHYSICSCHAPTER - KINETIC THEORY OF GASESEXERCISE - Fill in the blanks
8 Videos
- KINEMATICS-2BOOK - CENGAGE PHYSICSCHAPTER - KINEMATICS-2EXERCISE - Exercise Integer
9 Videos
- KINETIC THEORY OF GASES AND FIRST LAW OF THERMODYNAMICSBOOK - CENGAGE PHYSICSCHAPTER - KINETIC THEORY OF GASES AND FIRST LAW OF THERMODYNAMICSEXERCISE - Interger
11 Videos
Similar Questions
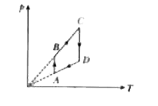
Pressure temperature (p-1) graph of n moles of an ideal gas is shown in the figure. Among the following four graphs, which are the corresponding pressure volume (p-V) and density pressure (p-p) graphs?
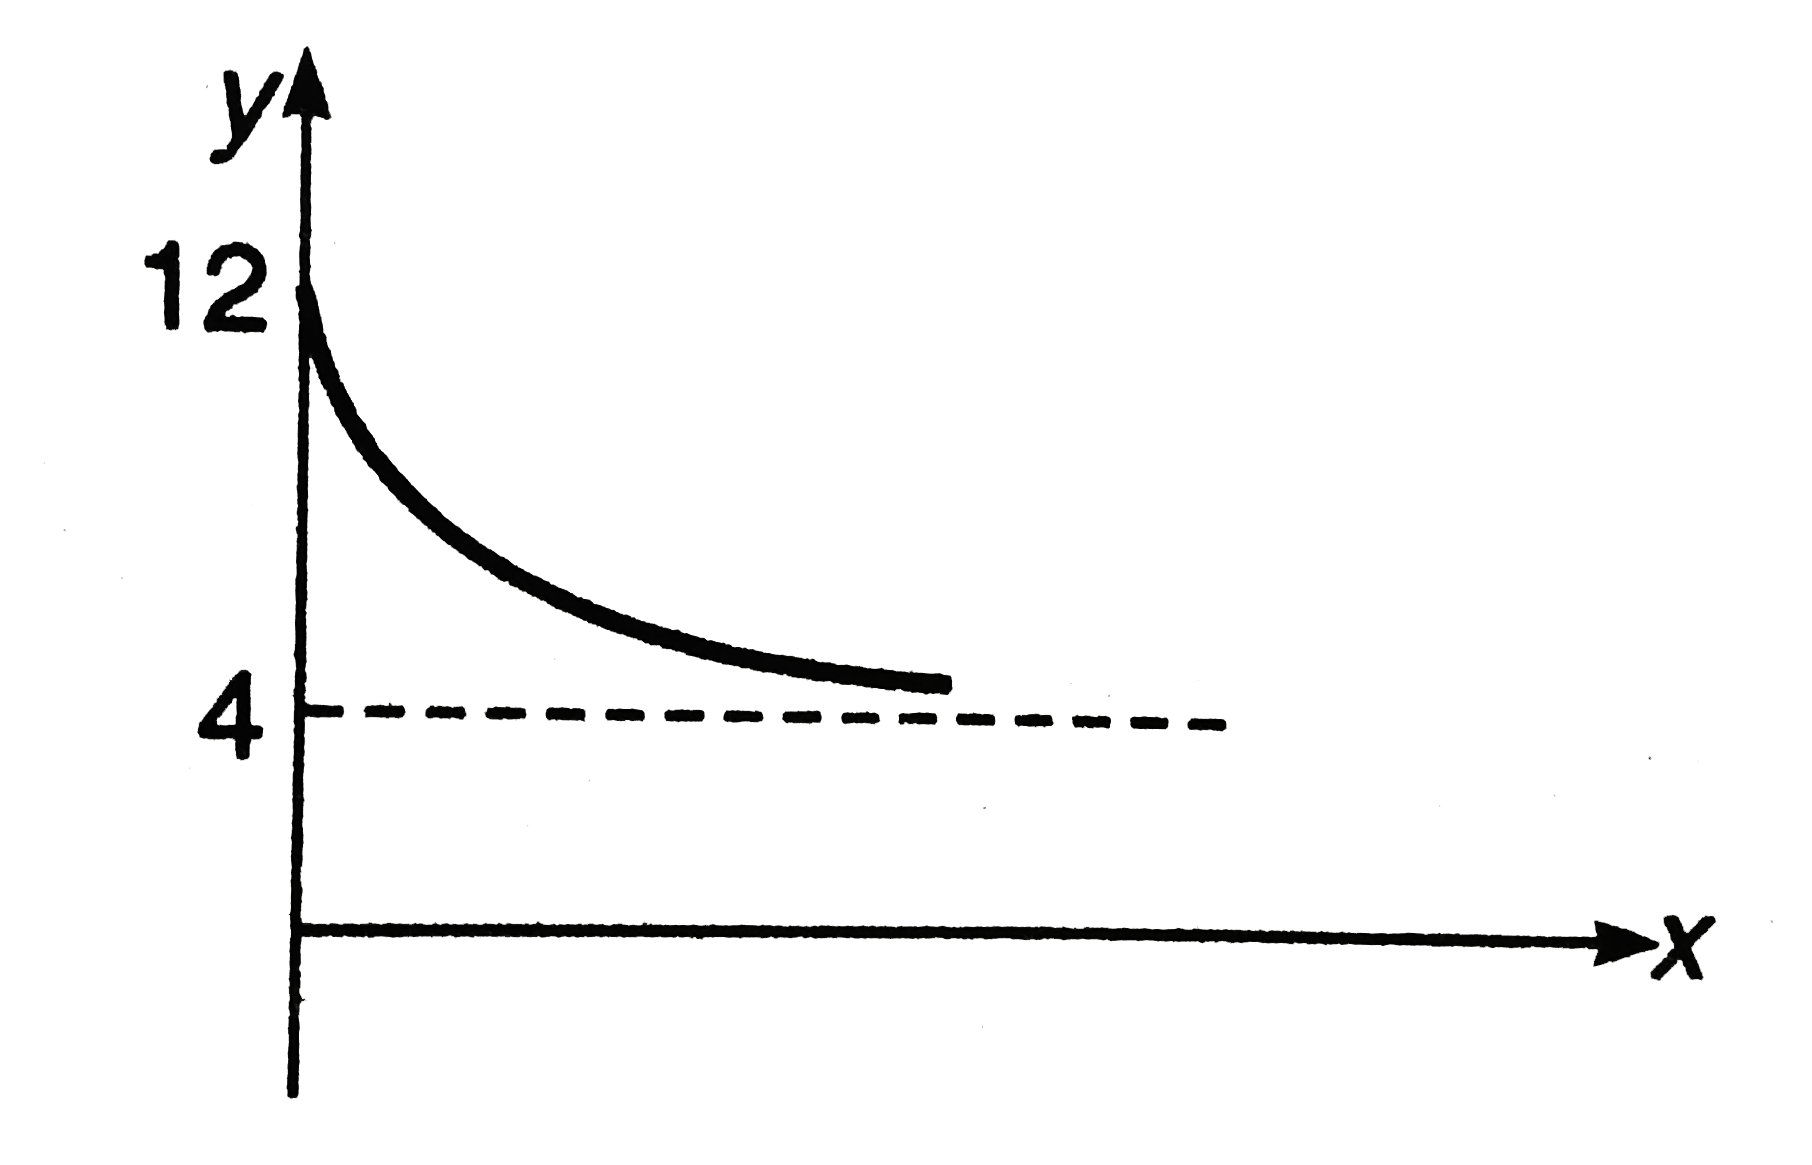
View SolutionThe graph shown in figure is exponential. Write down the equation corresponding to the graph.
View Solution
Knowledge Check
Pressure versus temperature graph of an ideal gas at constant volume V is shown by the straight line A. Now mass of the has is doubled and the volume is halved, then the corresponding pressure versus temperature graph will be shown by the line
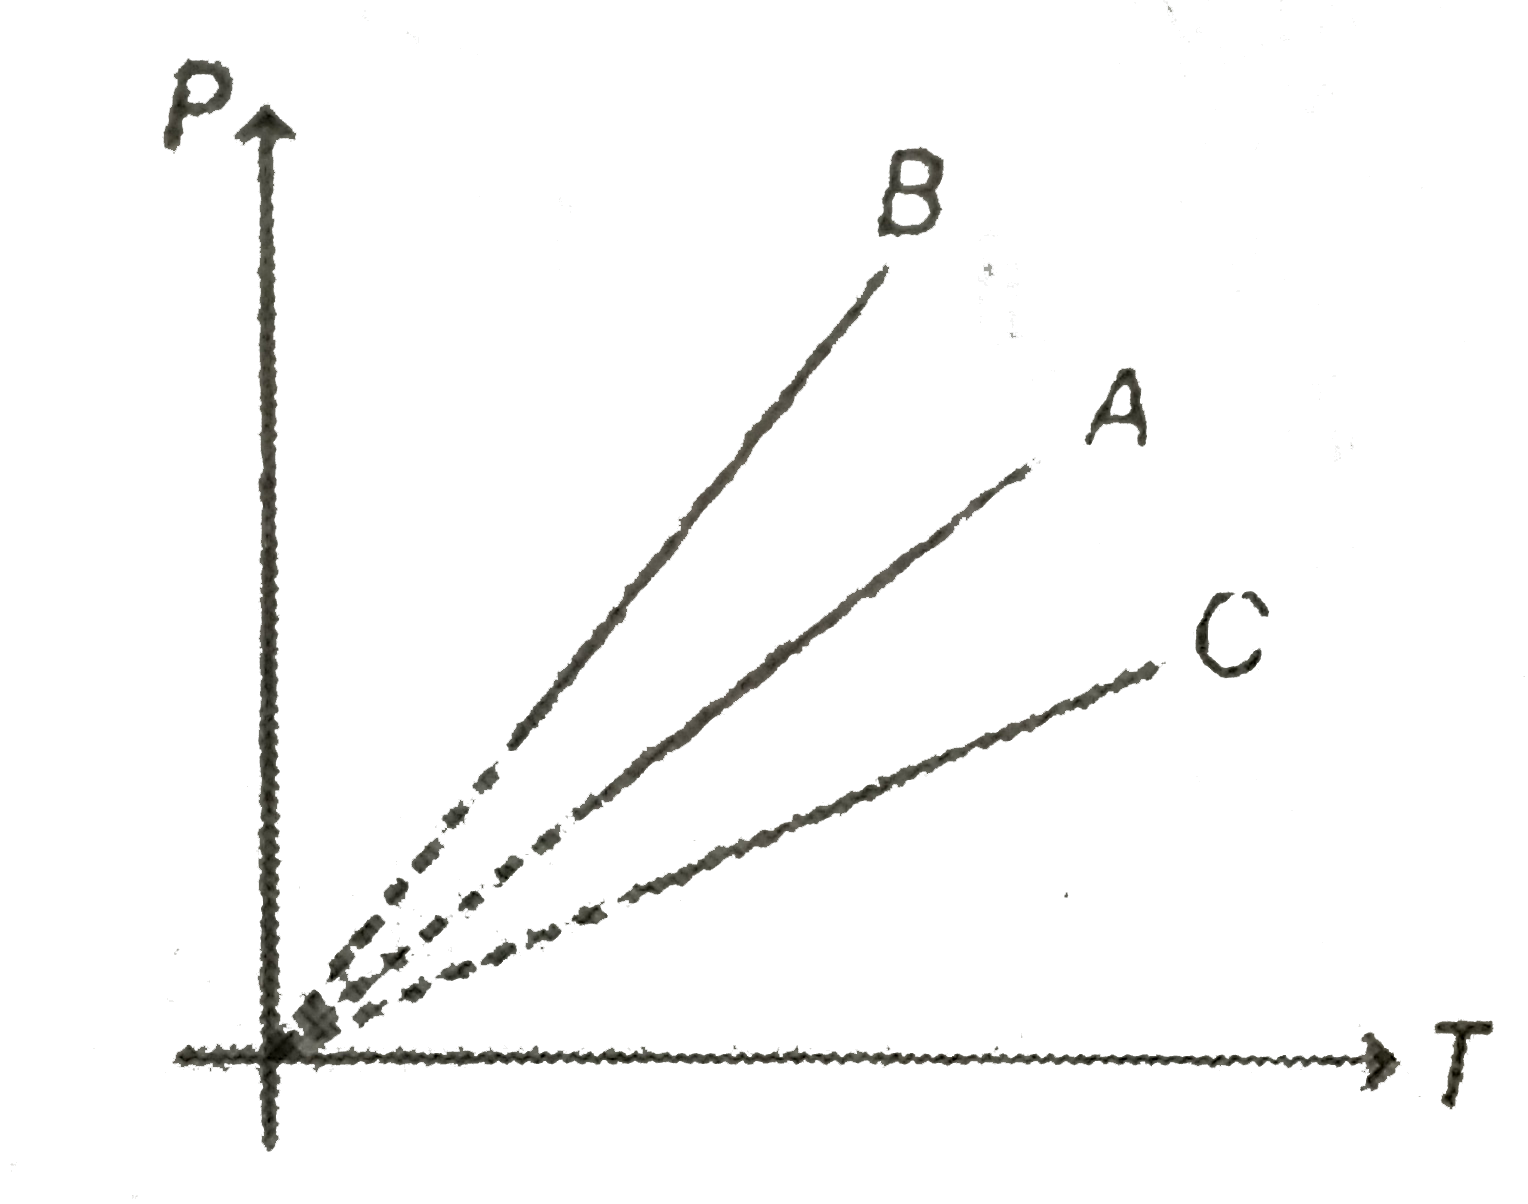 AABBCCDNone of these
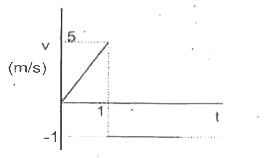
The velocity time graph for a particle moving along X-axis is shown in the figure. The corresponding displacement time graph is correctly shown by
 A
A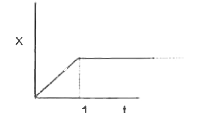 B
B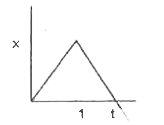 C
C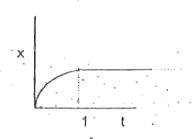 D
D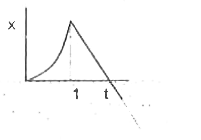
The velocity time graph for a particle moving along x-axis is shown in the figure. The corresponding displacement time graph is correctly shown by
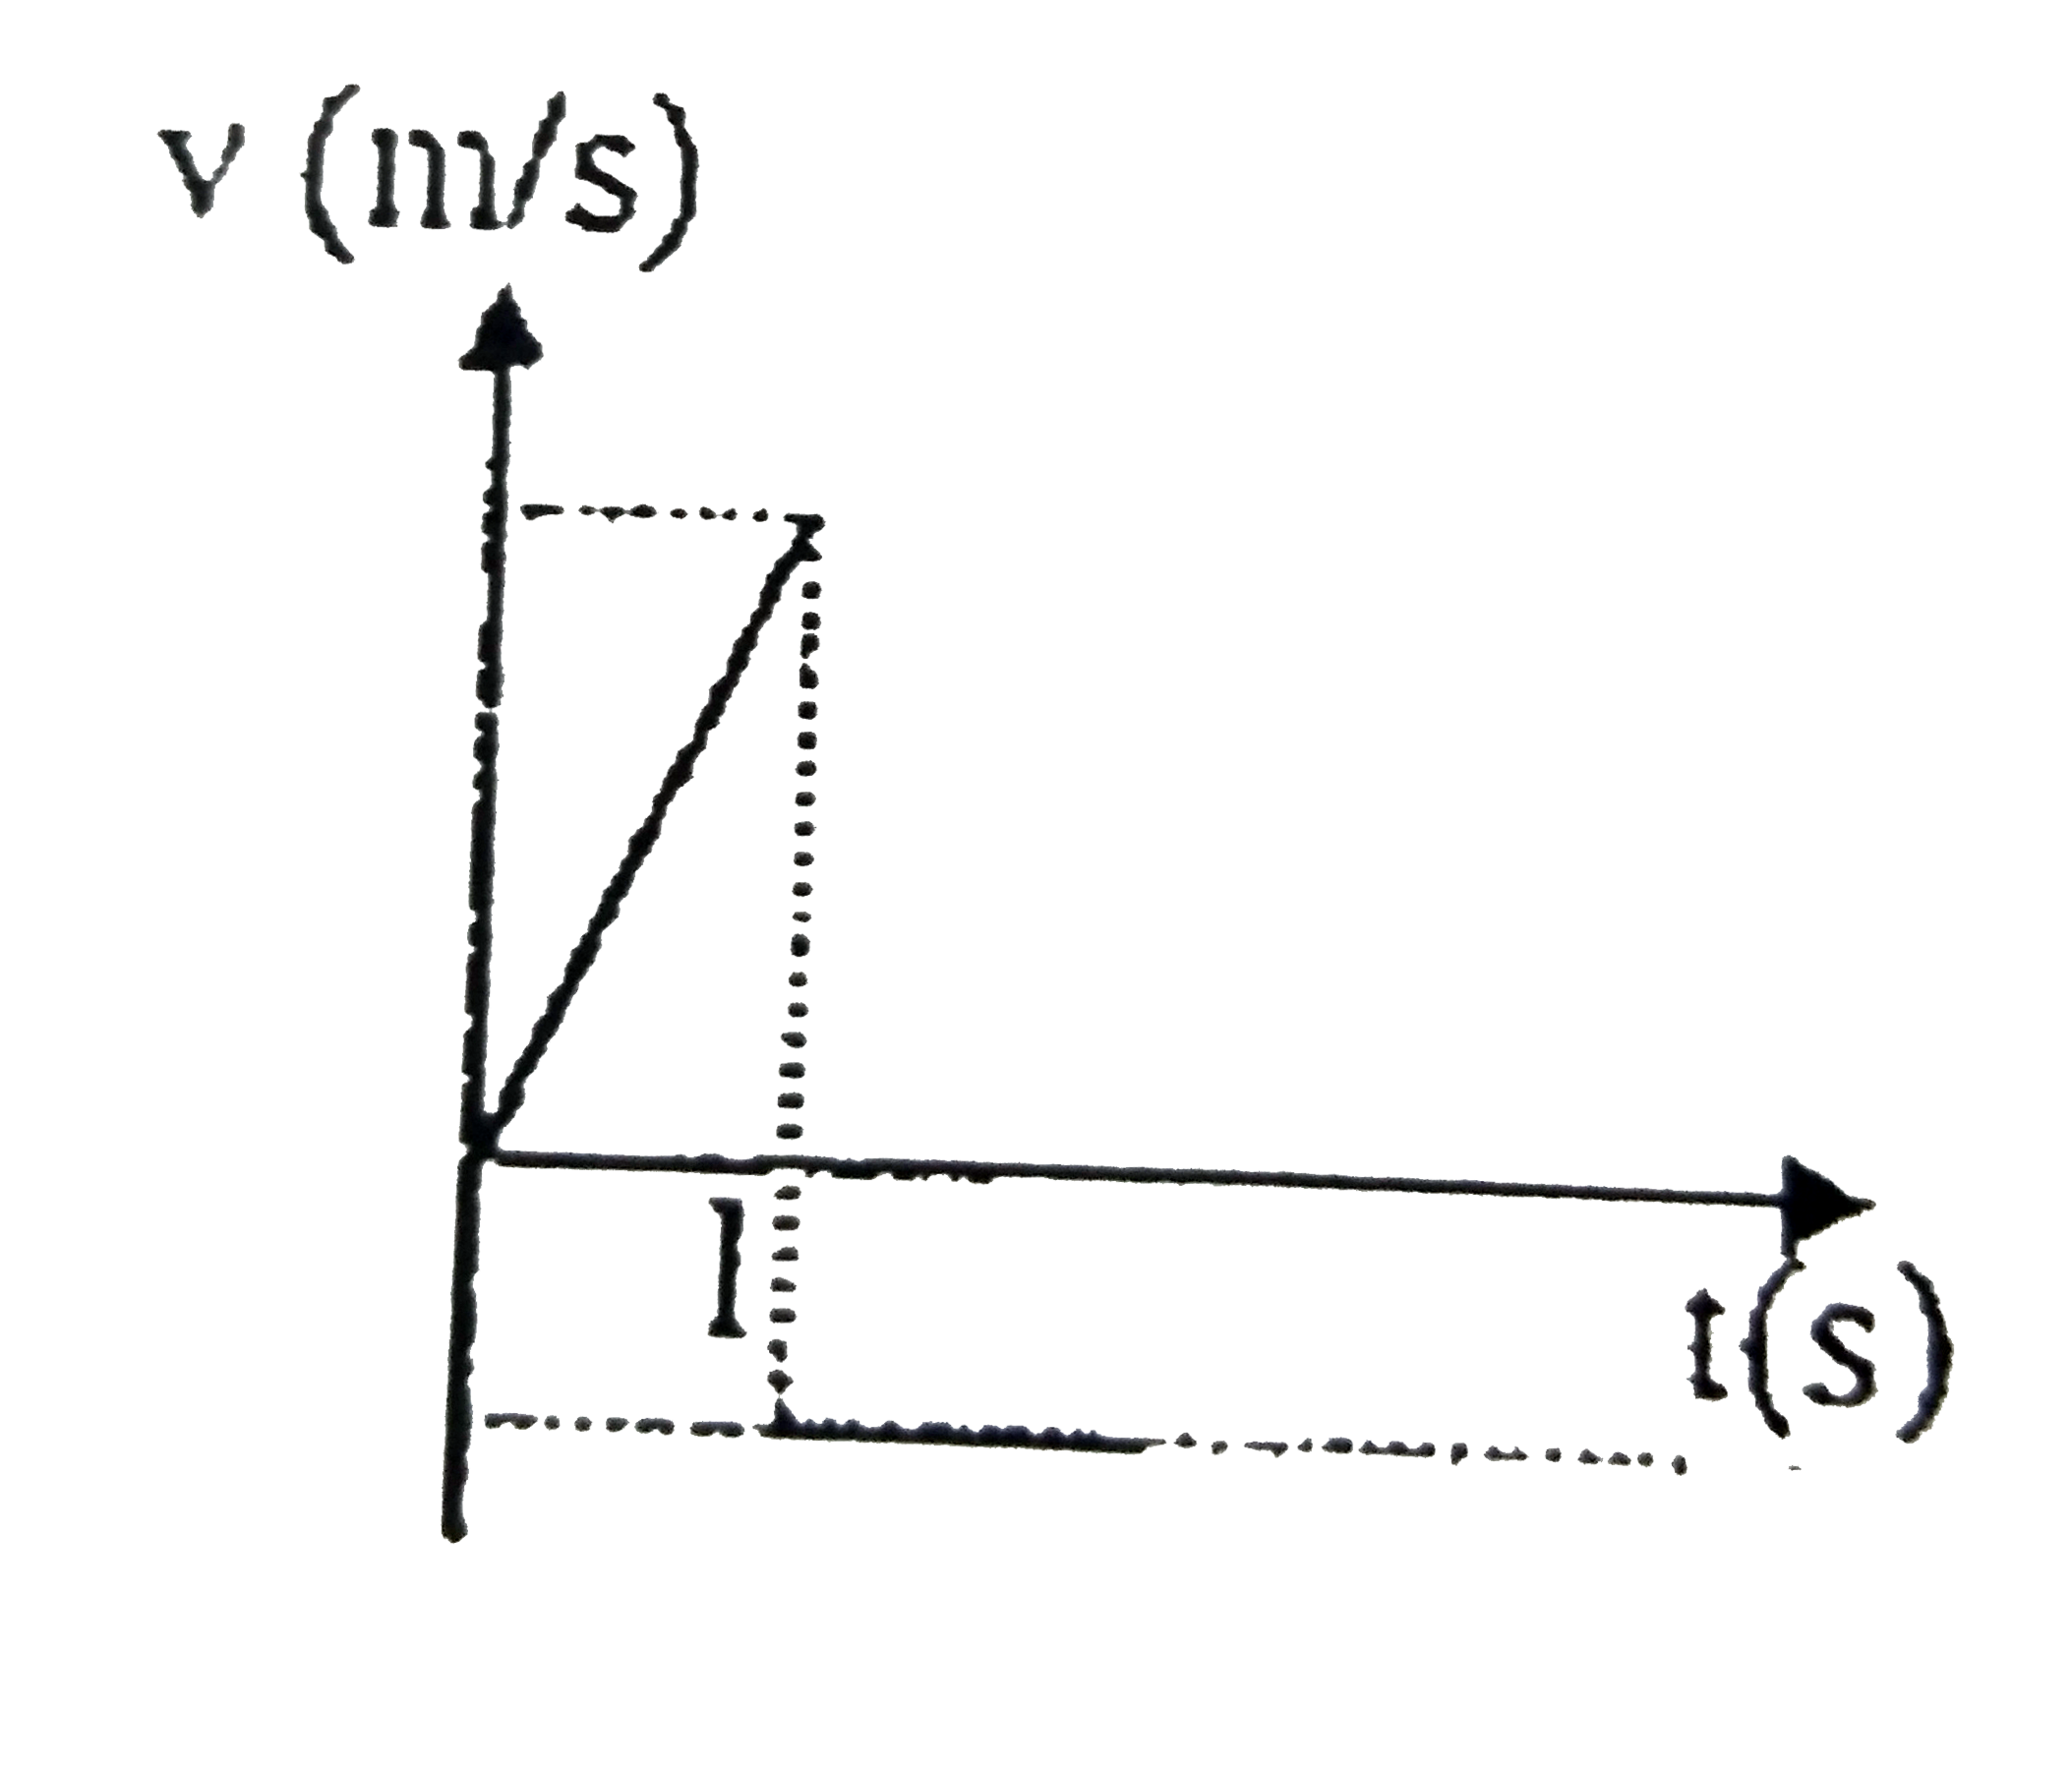 A
A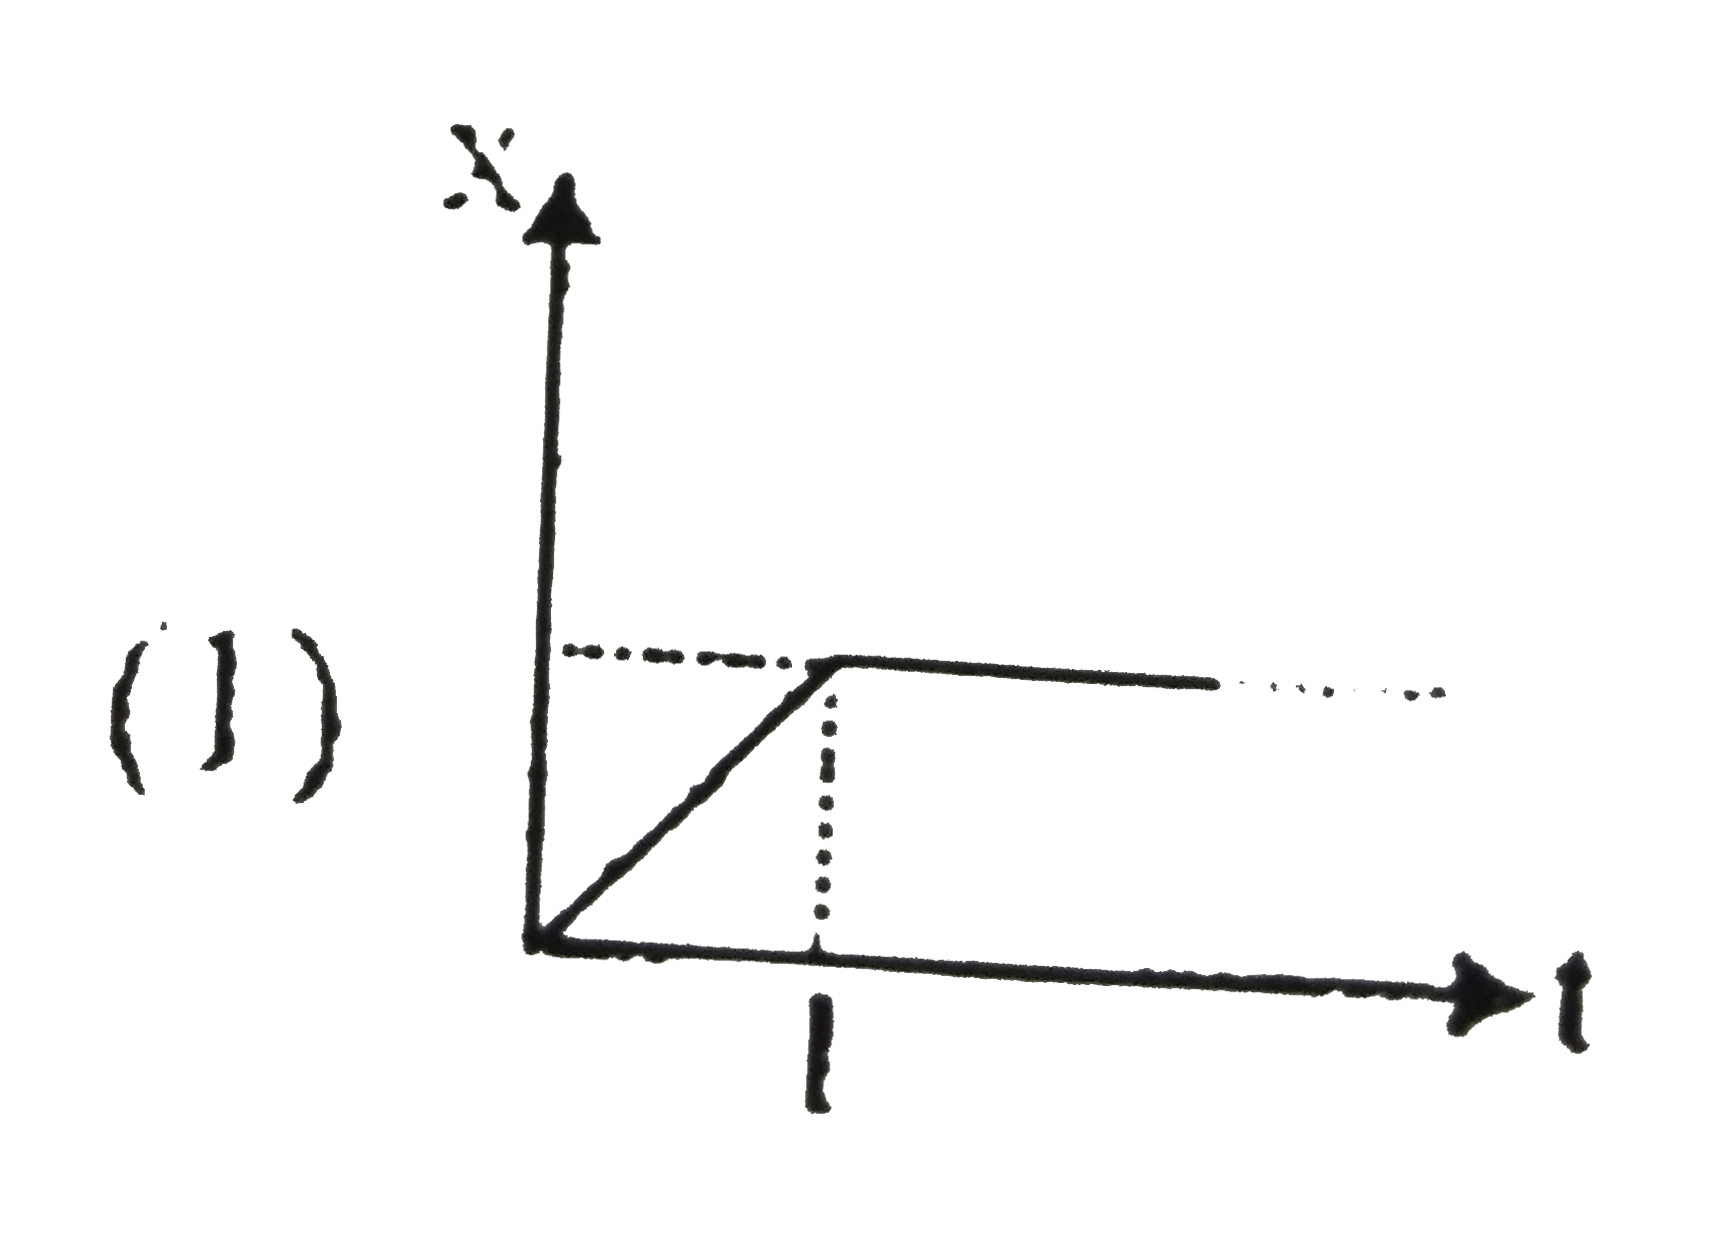 B
B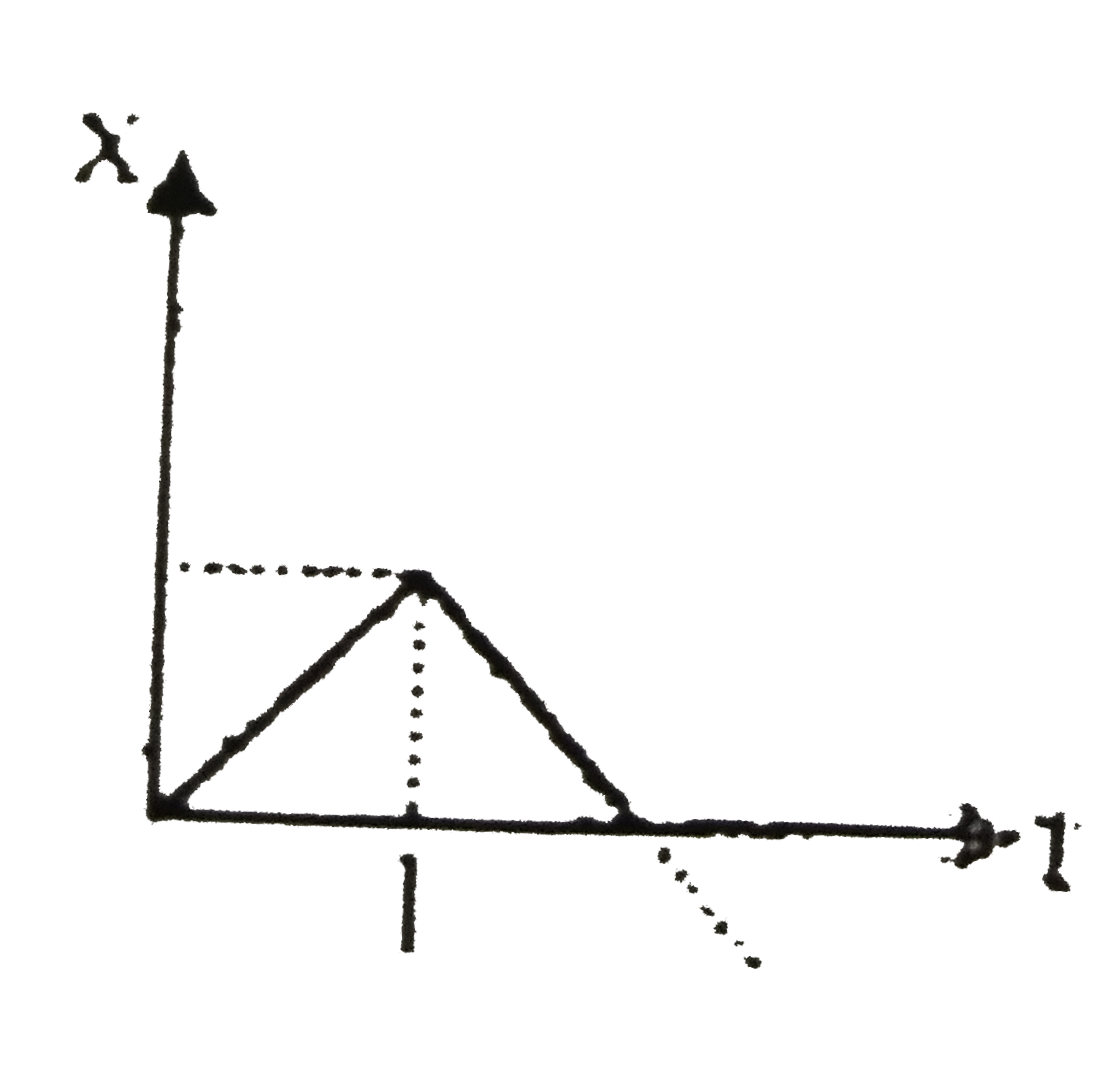 C
C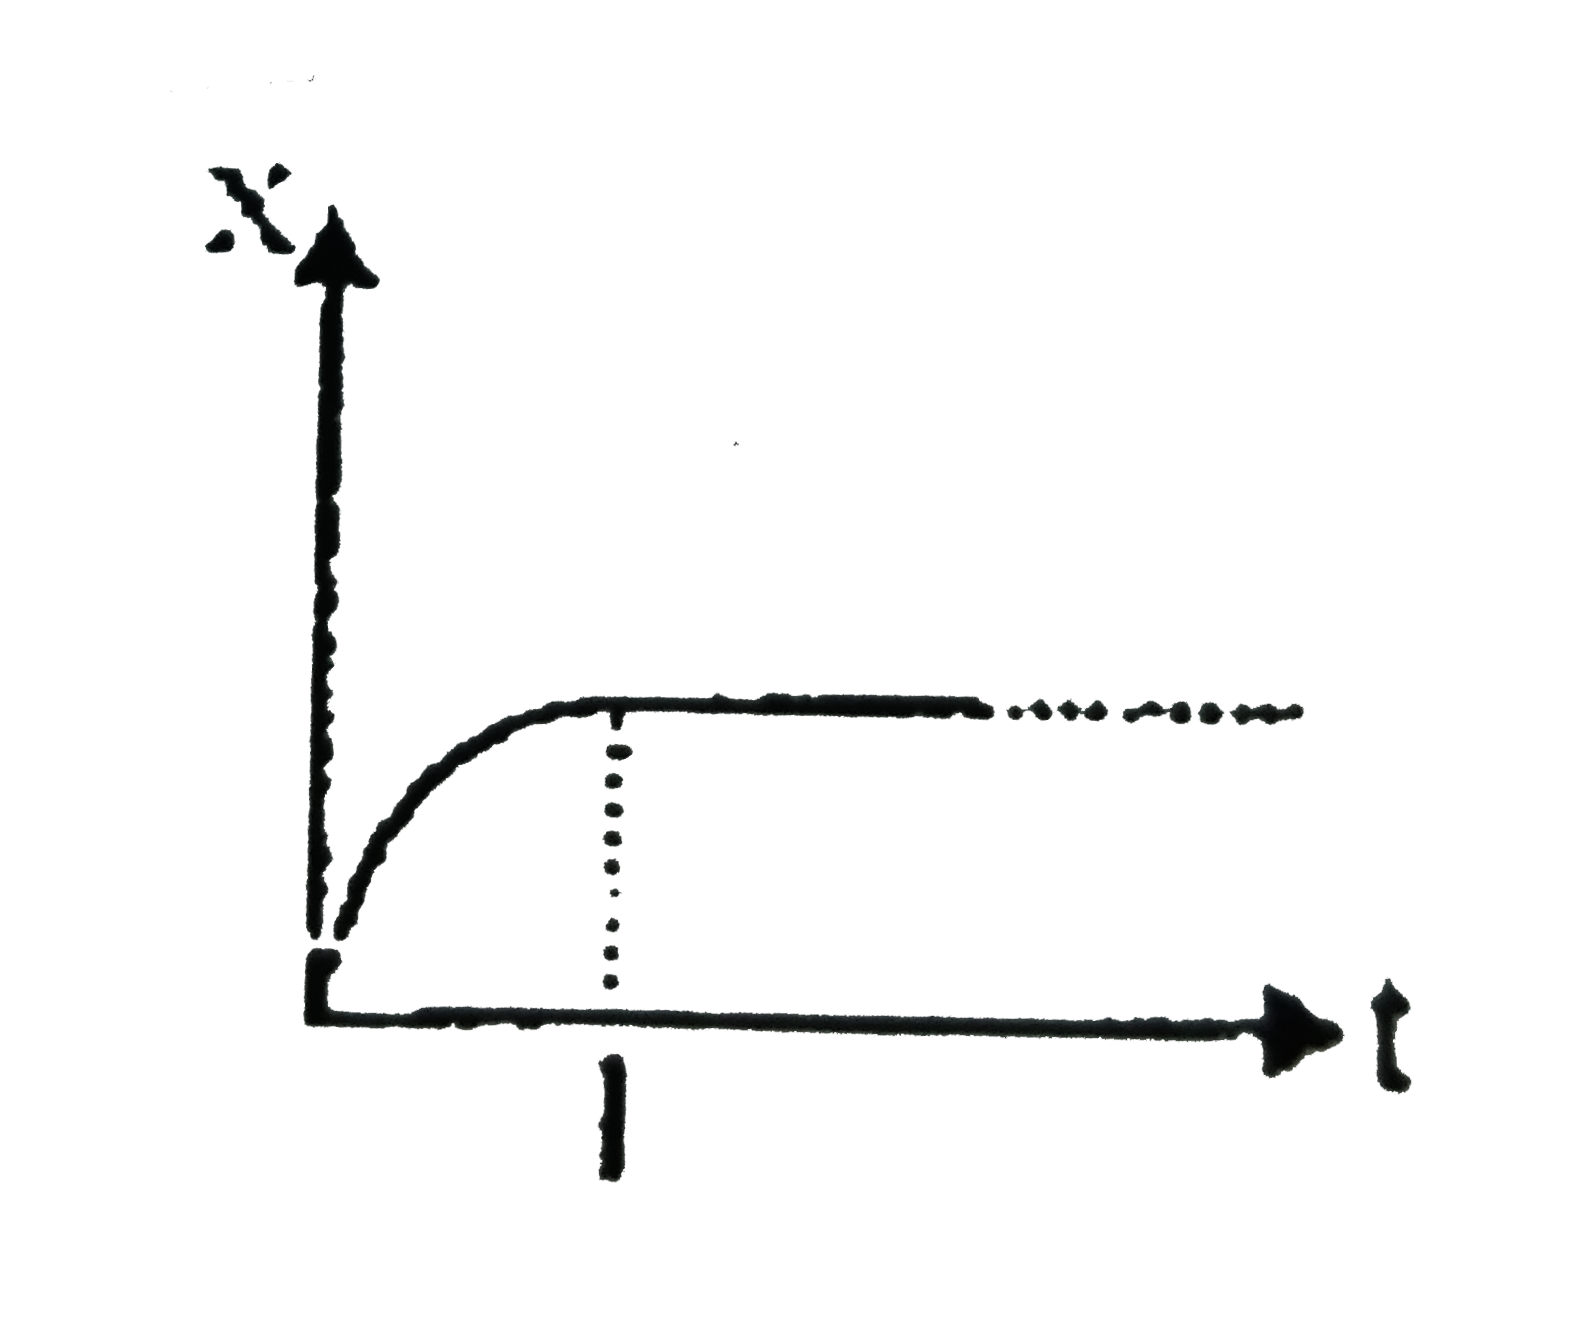 D
D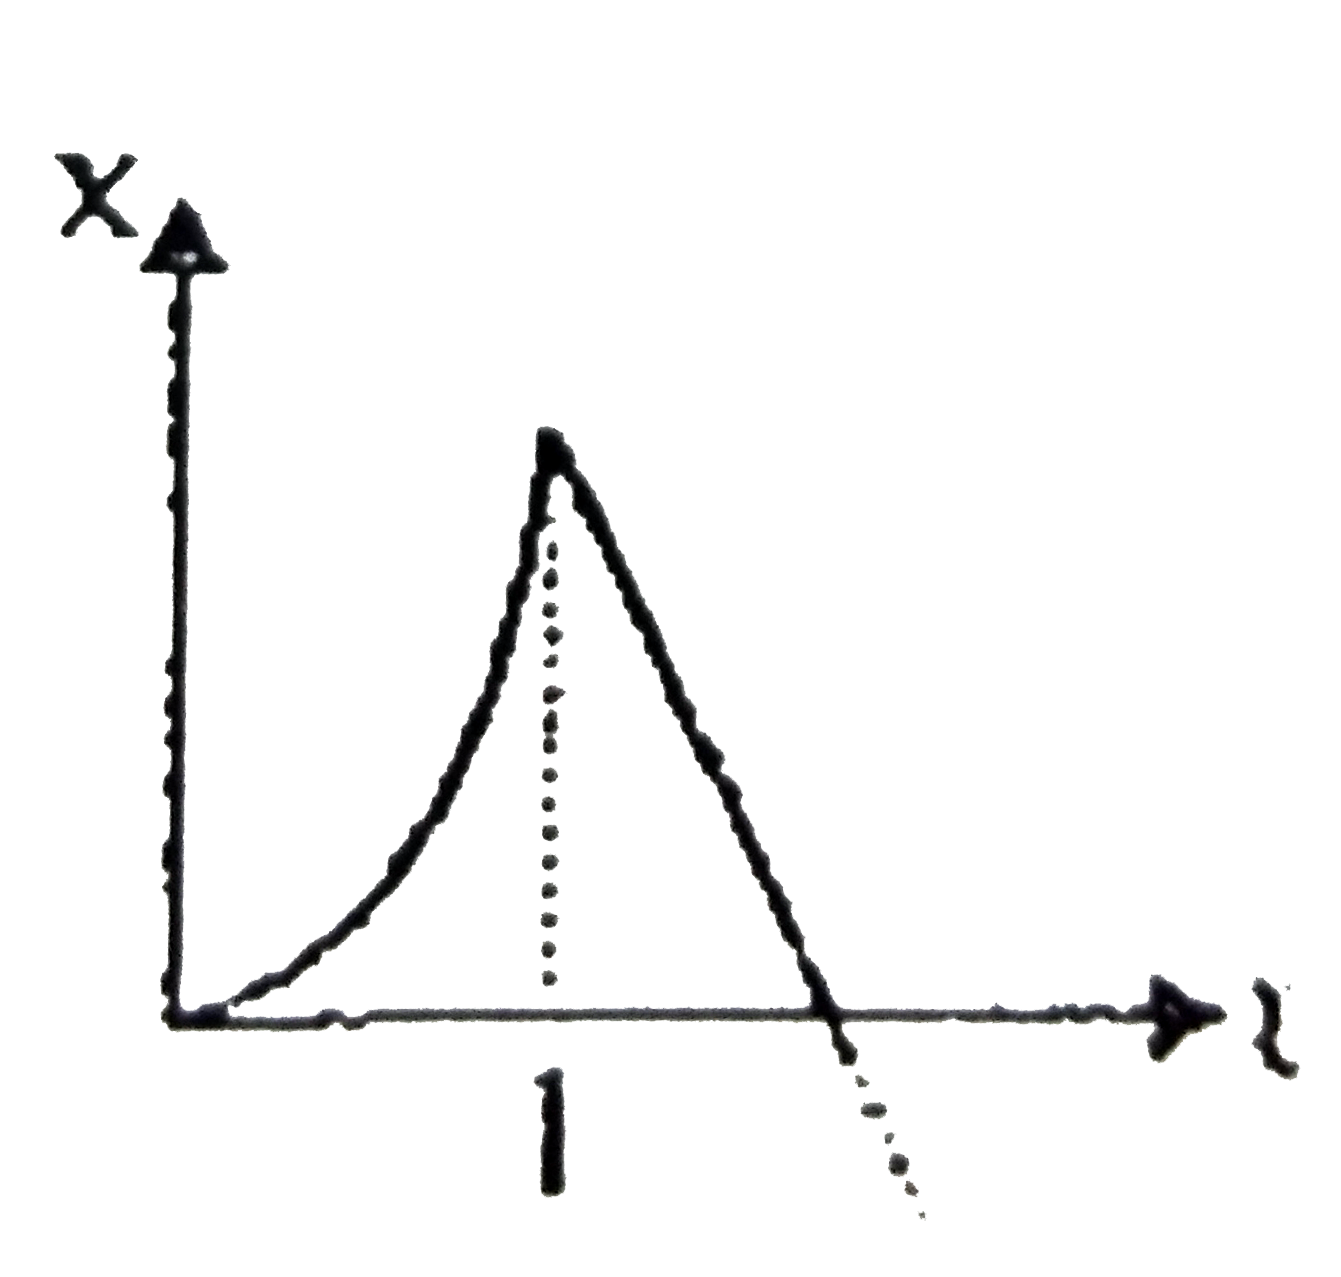
Explain the following temperature Vs. time graph:
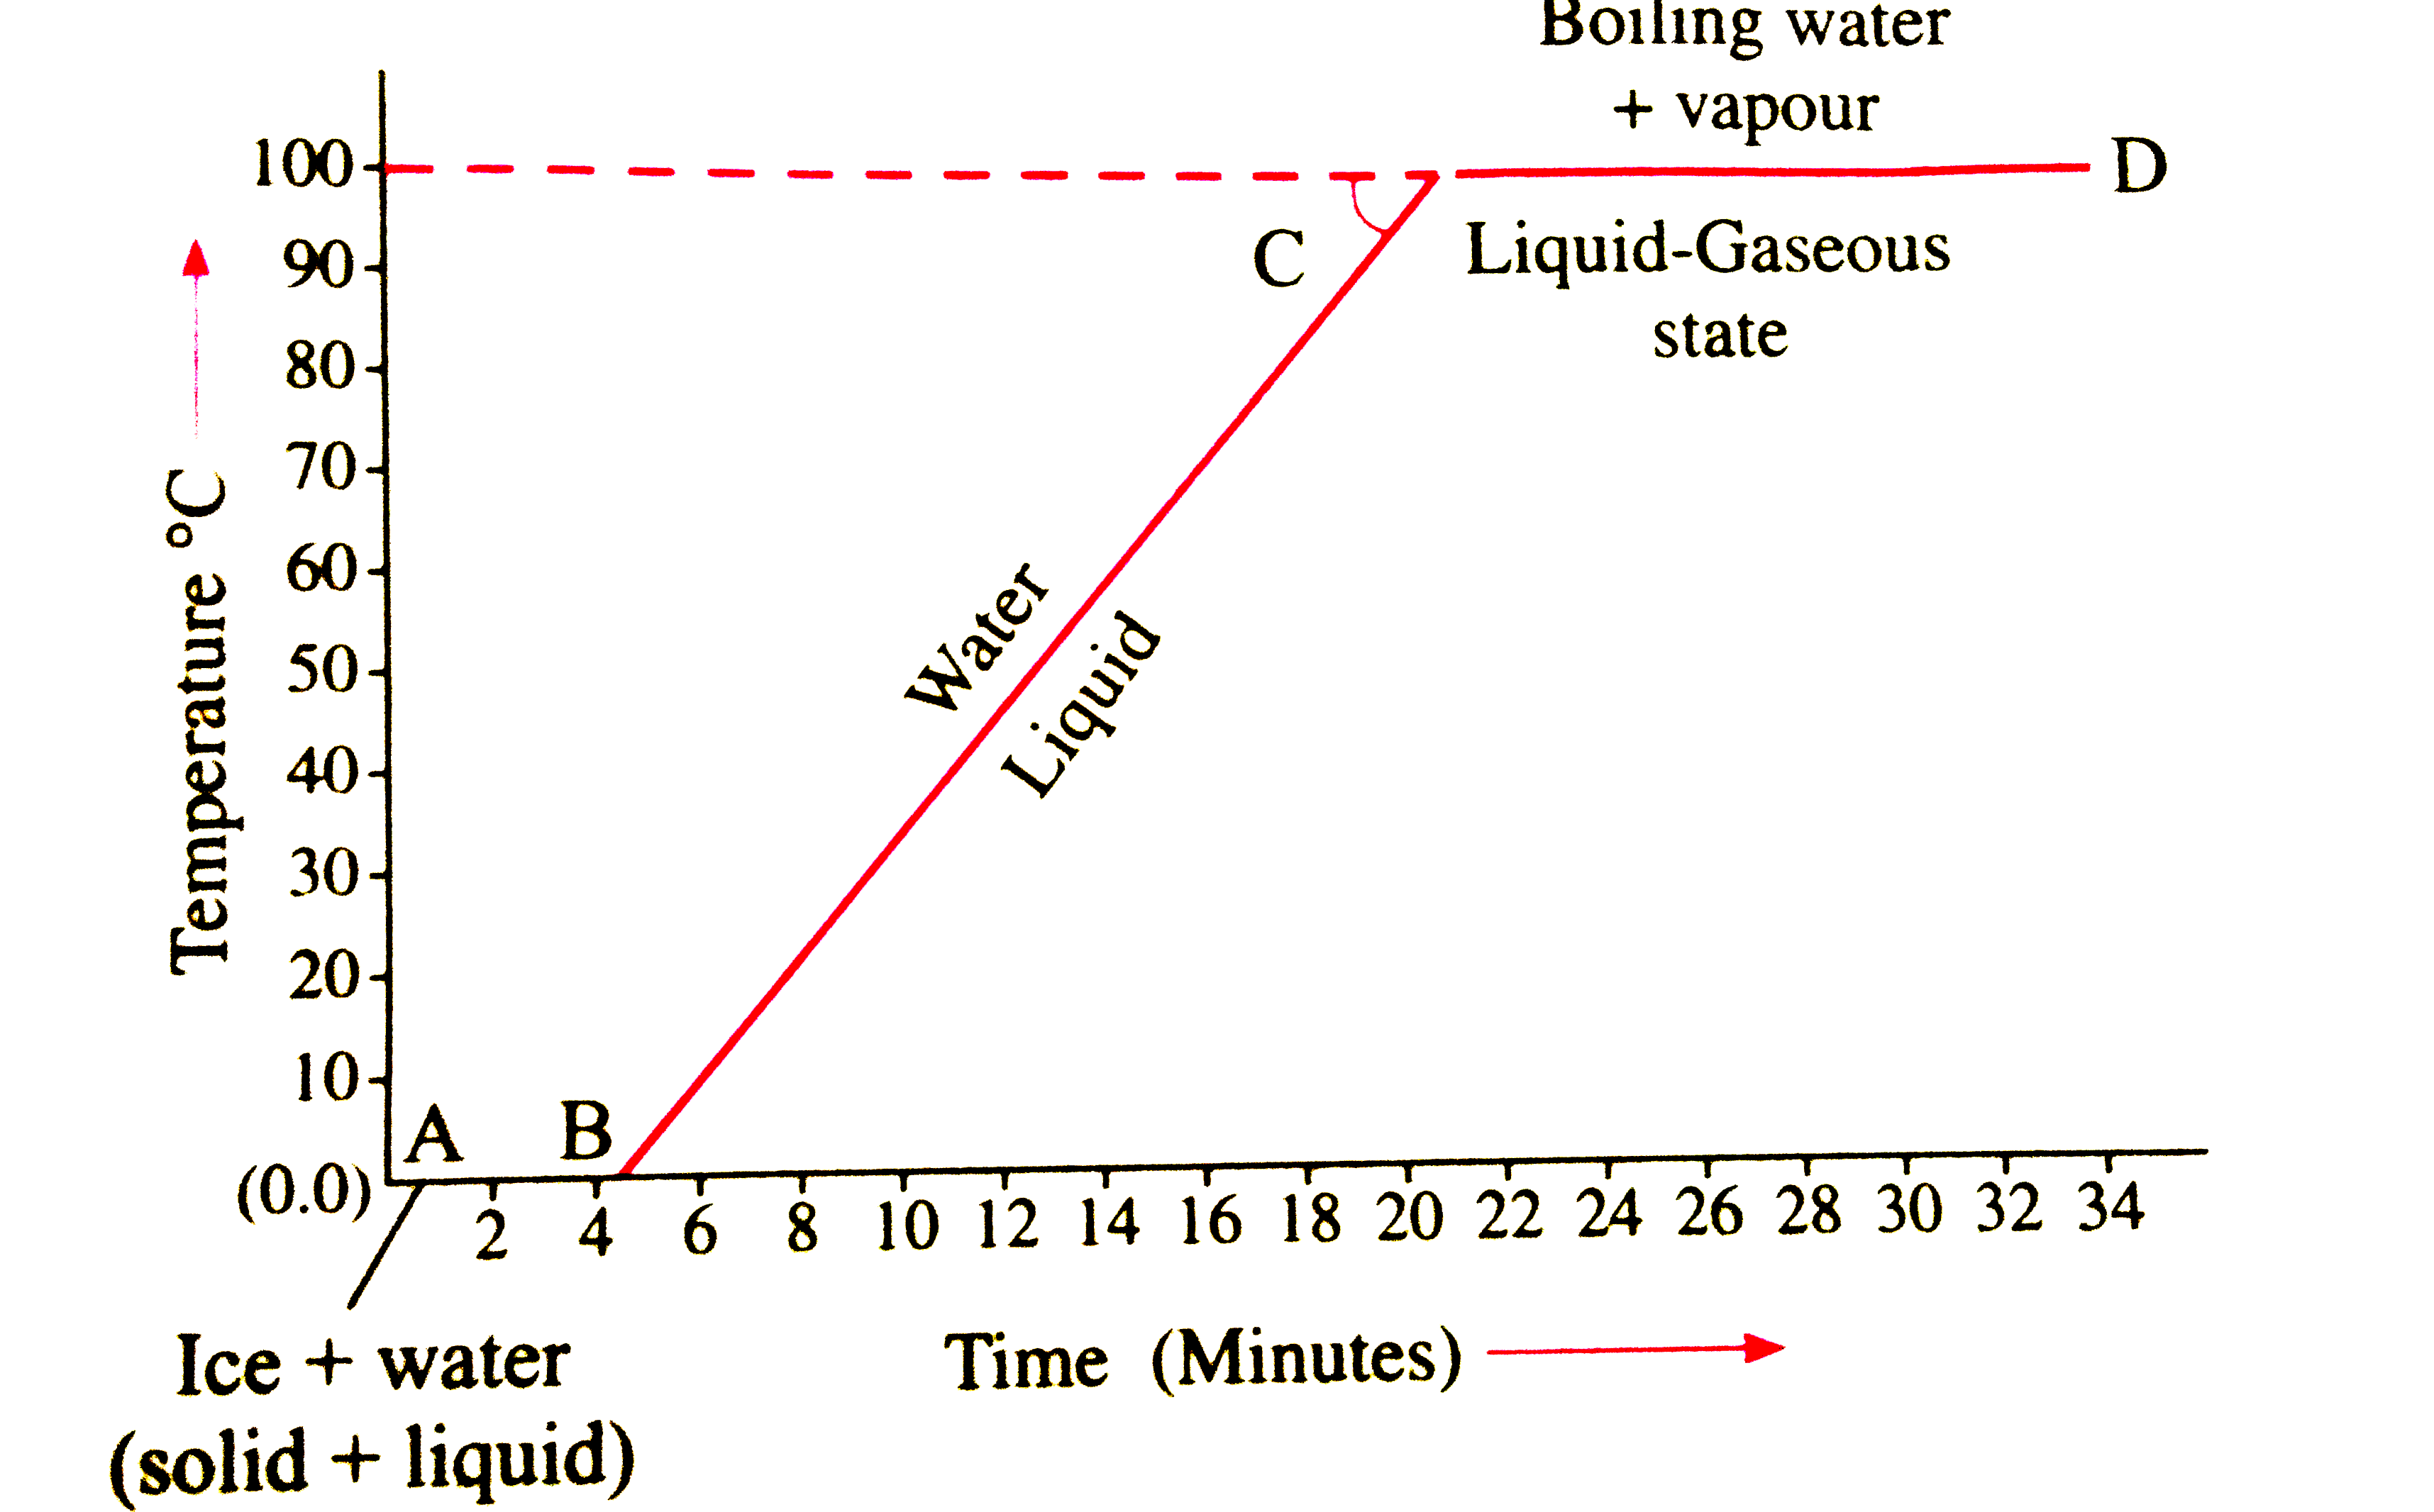
View SolutionThe velocity-time graph for a particle moving along X-axis is shown in the figure. The corresponding displacement-time graph is correctly shown by
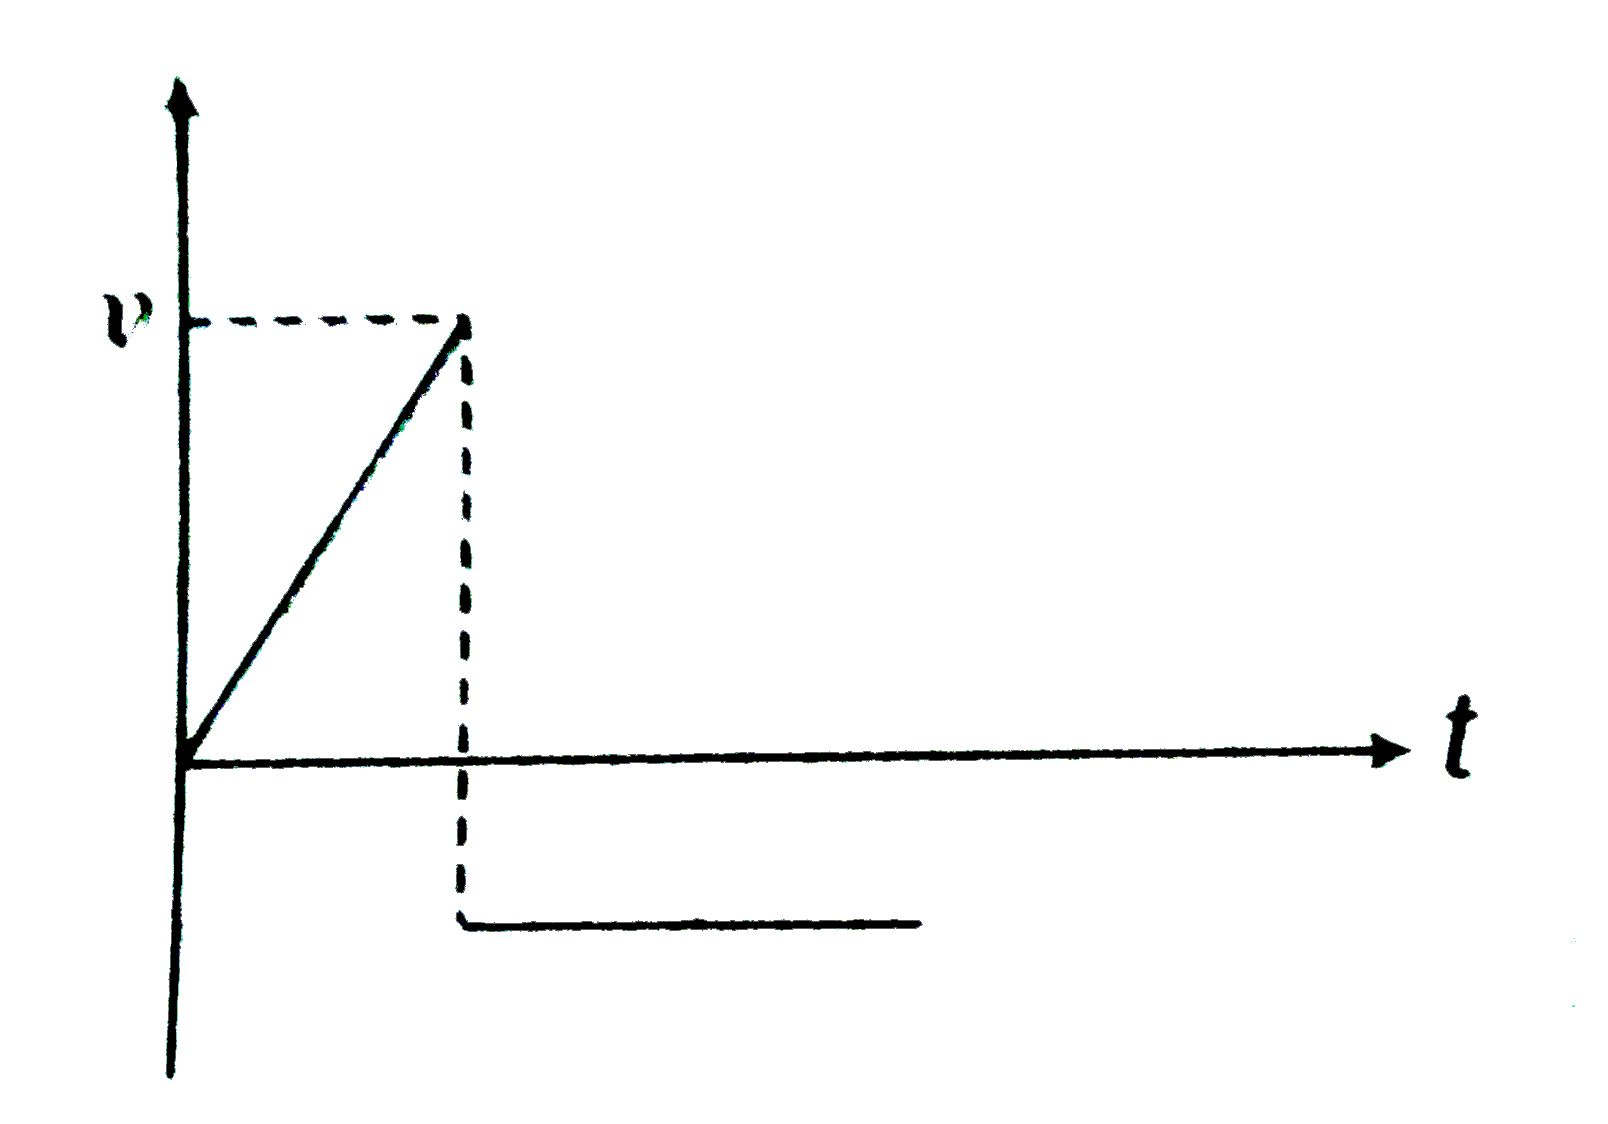
View SolutionAcceleration vs time graph is shown in the figure for a particle moving along a straight line. The particle is initially at rest. Find the time instant(s) when the particle comes to rest?
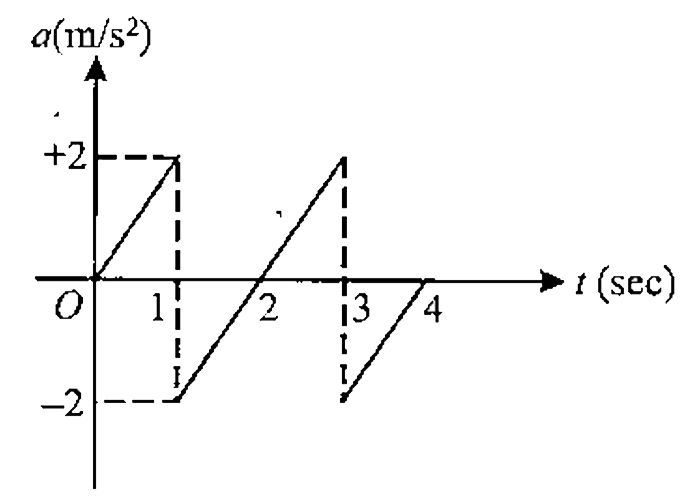
View SolutionAcceleration vs time graph is shown in the figure for a particle moving along a straight line. The particle is initially at rest. Find the time instant(s) when the particle comes to rest?

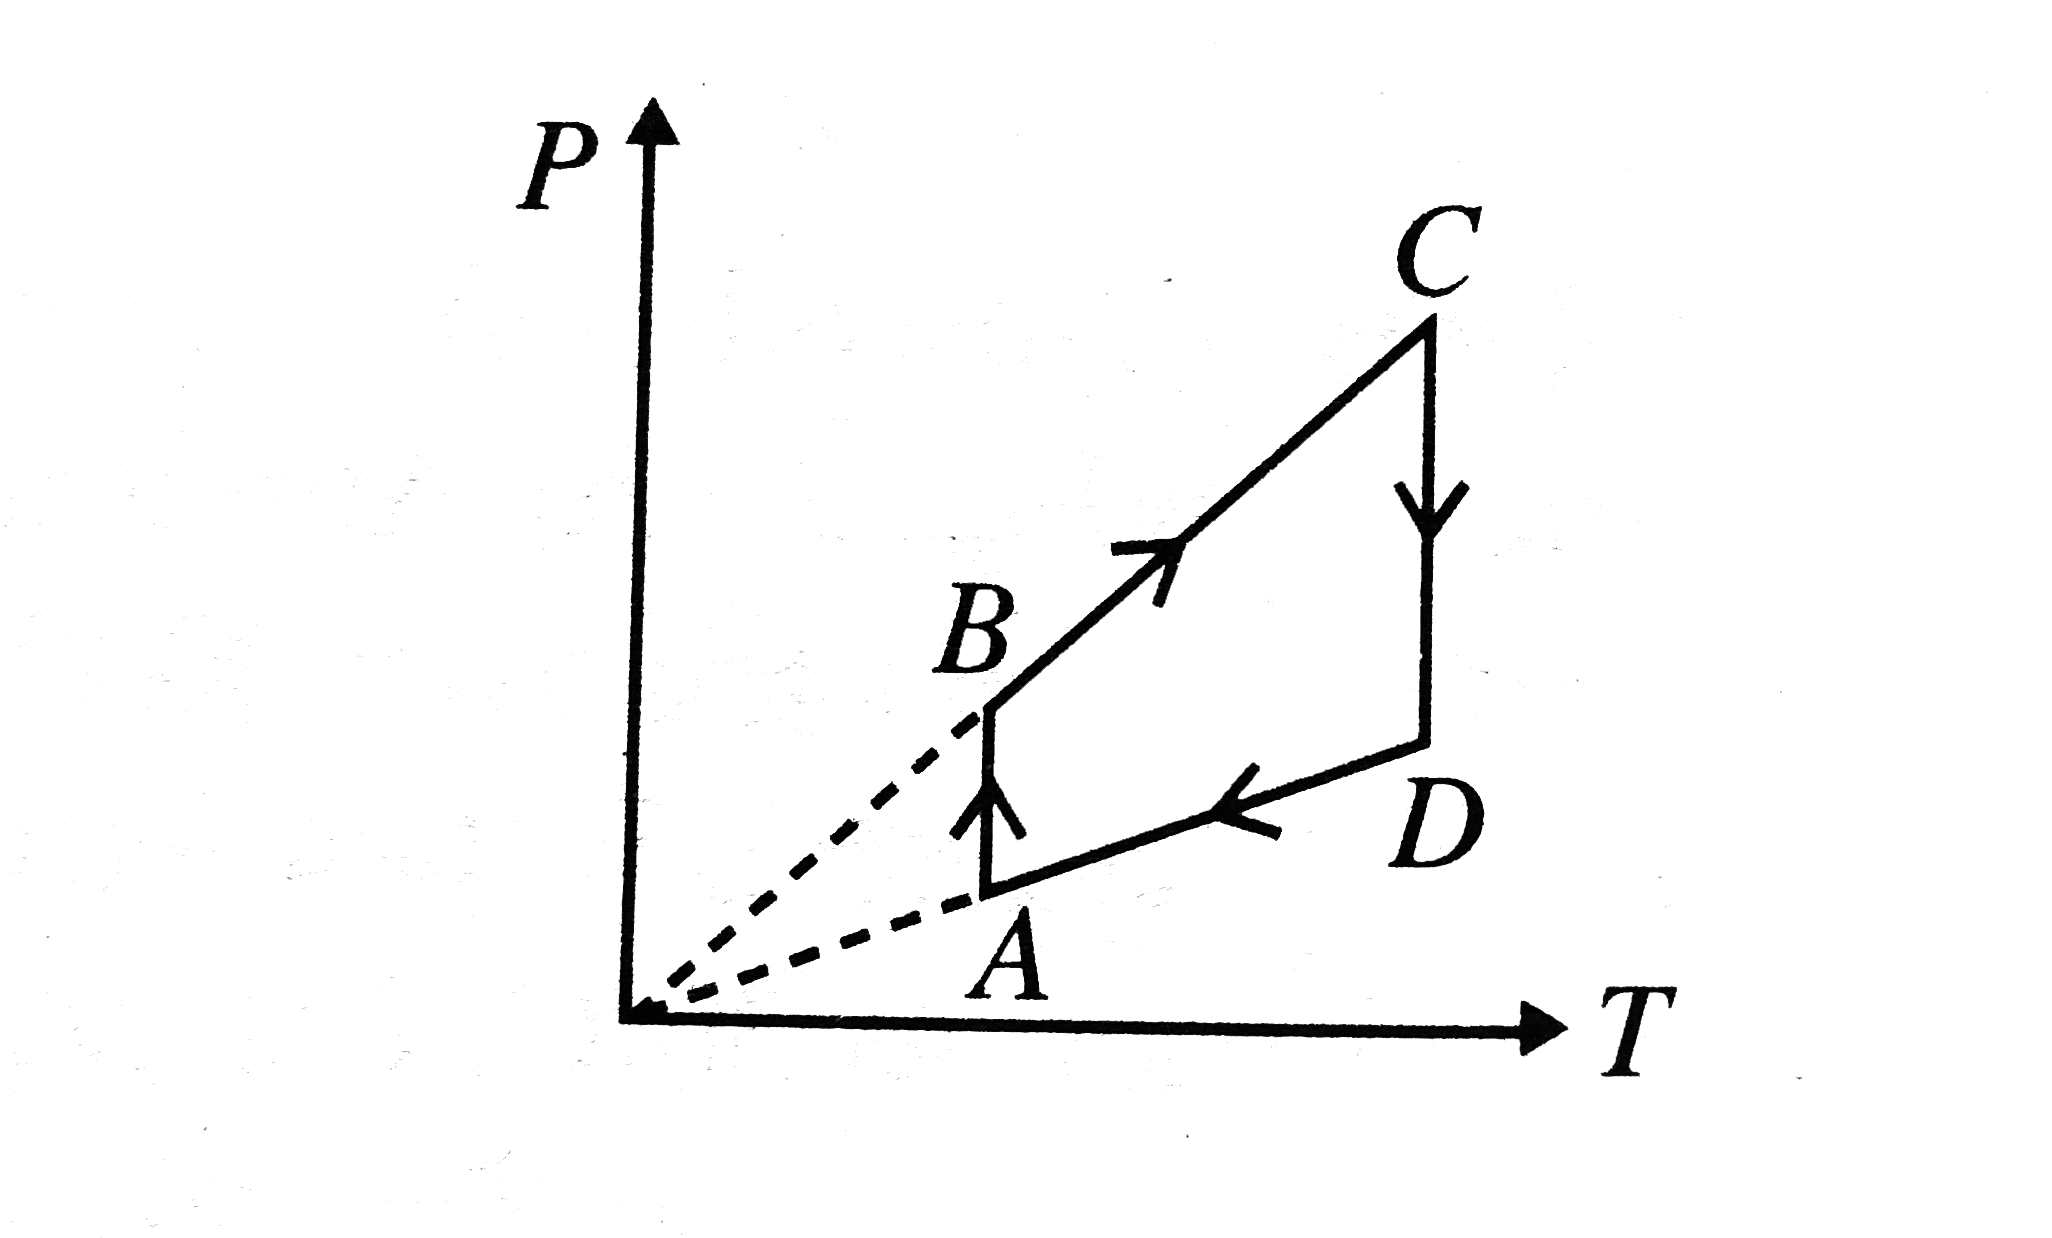
View SolutionPressure versus temperature graph of an ideal gas as shown in Fig.
Corresponding density (ρ) versus volume (V) graph will be
View Solution
