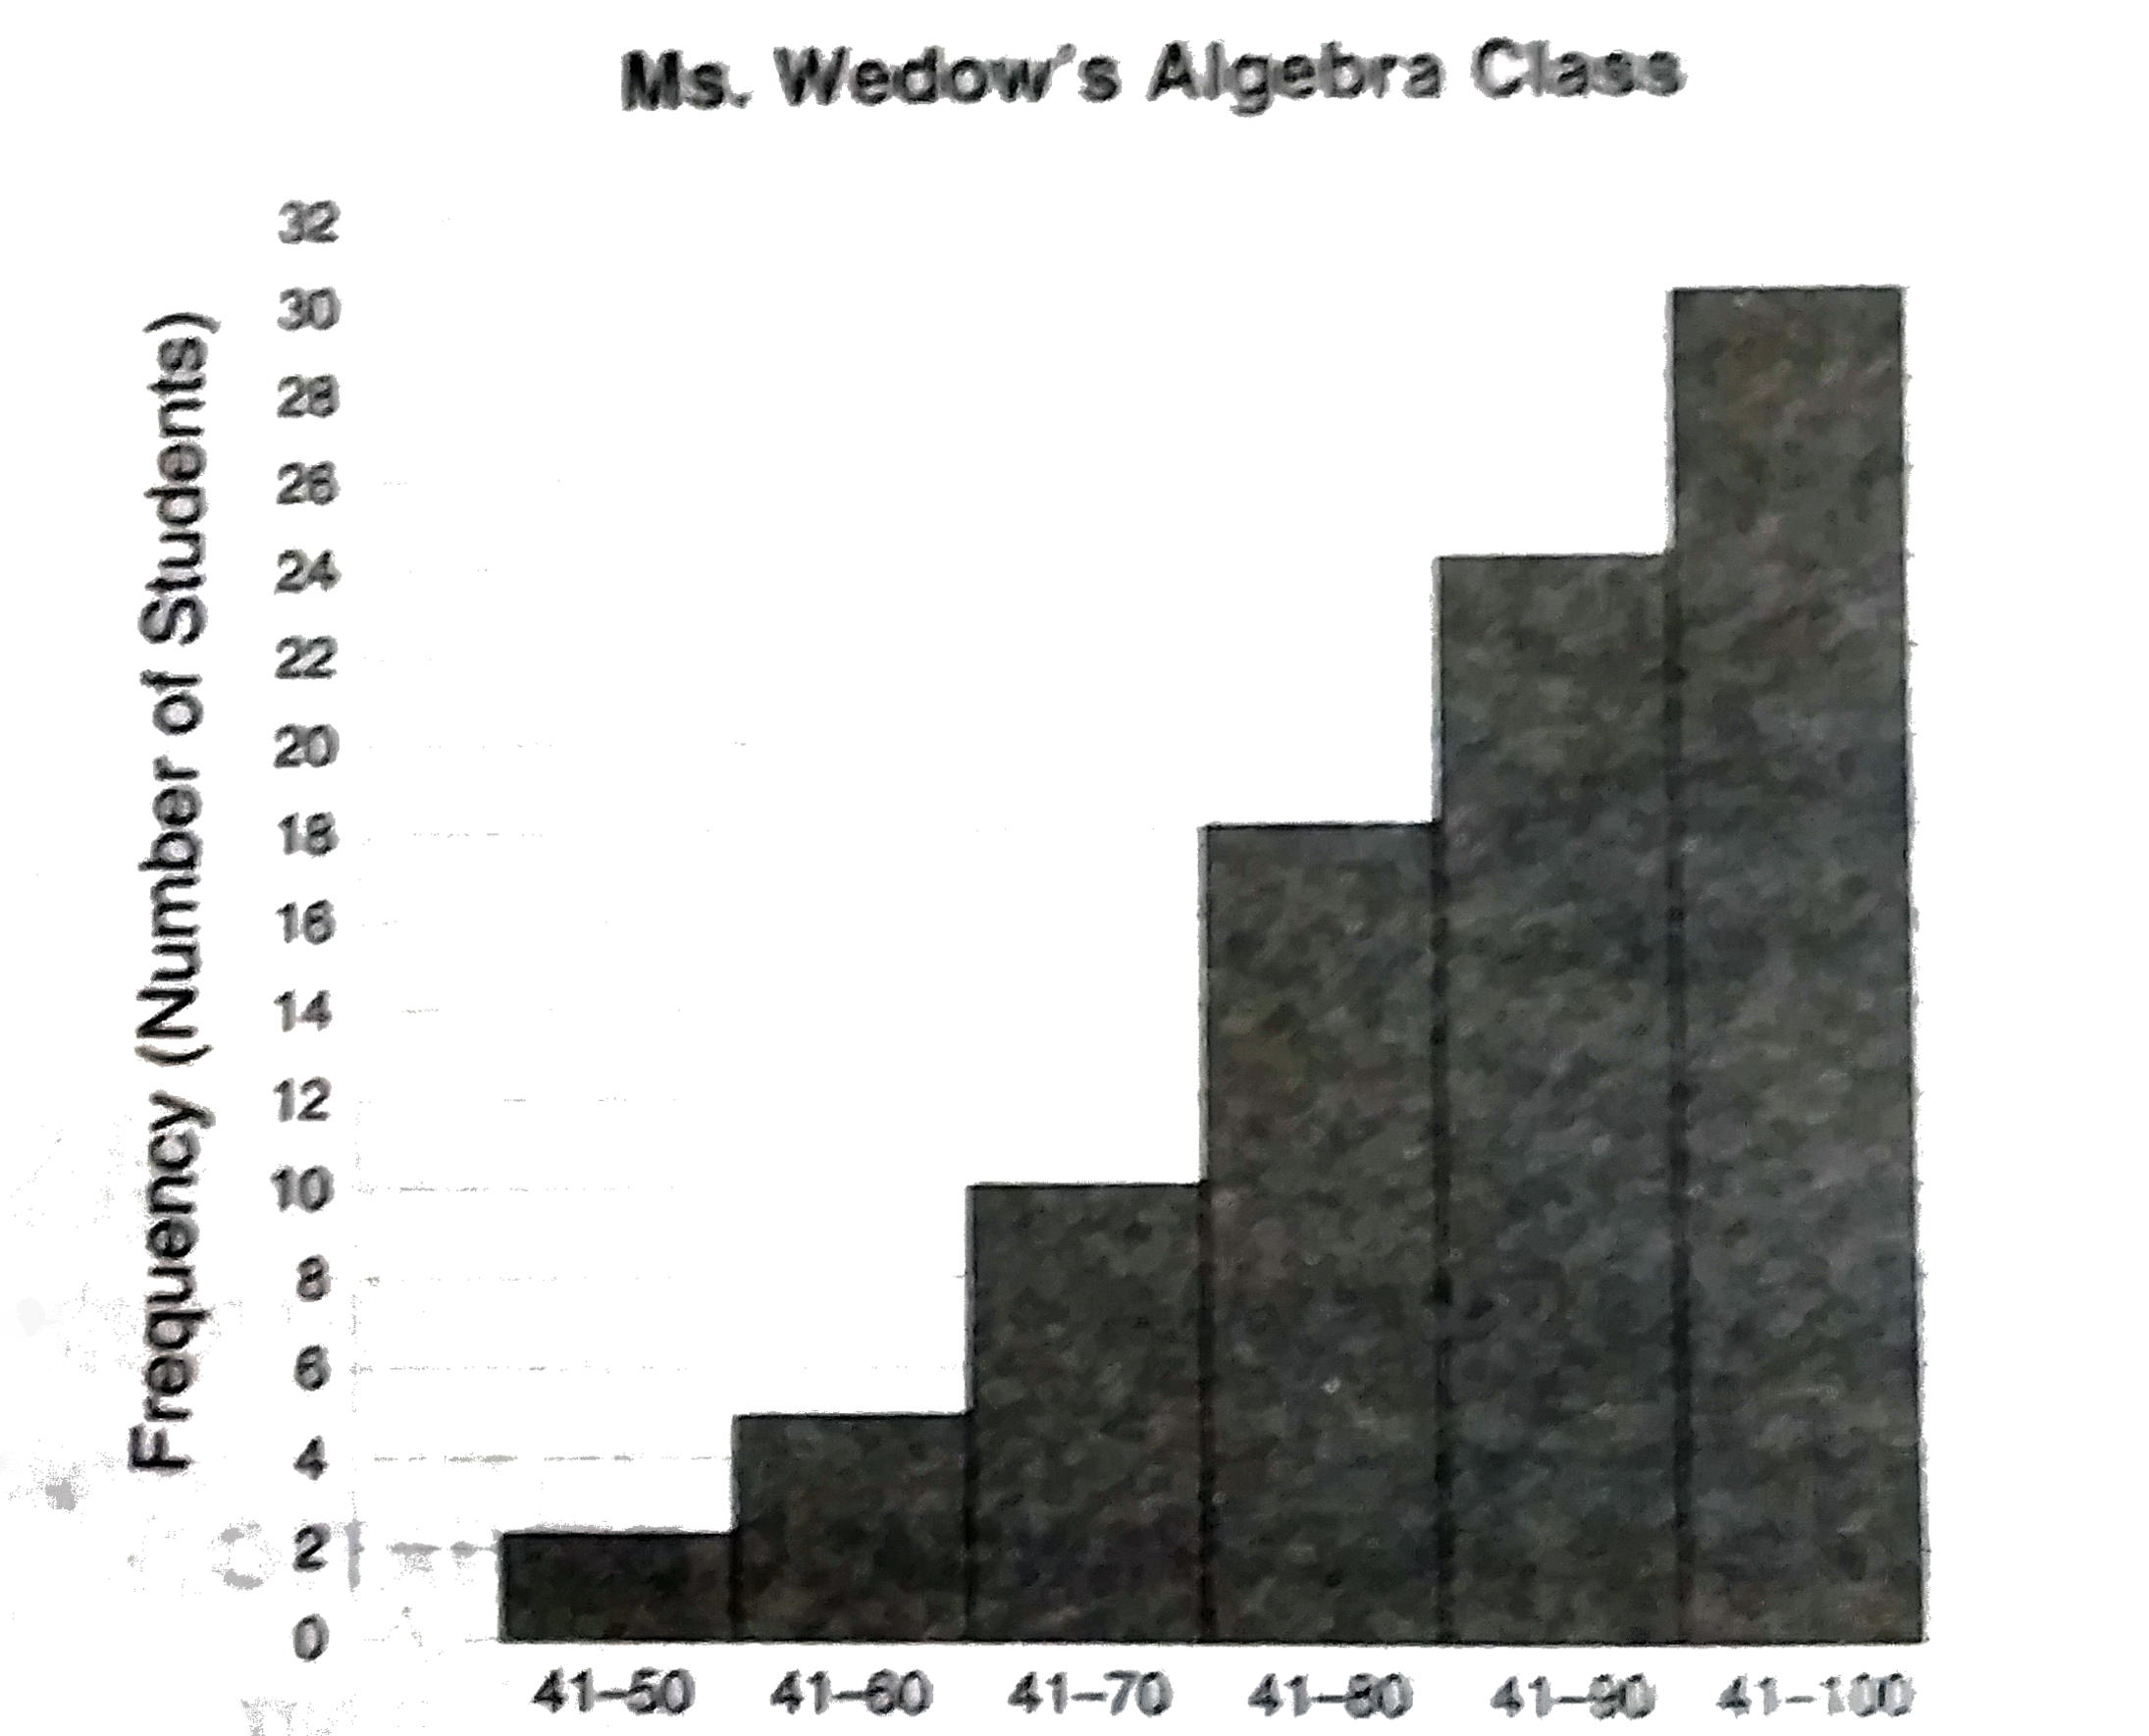
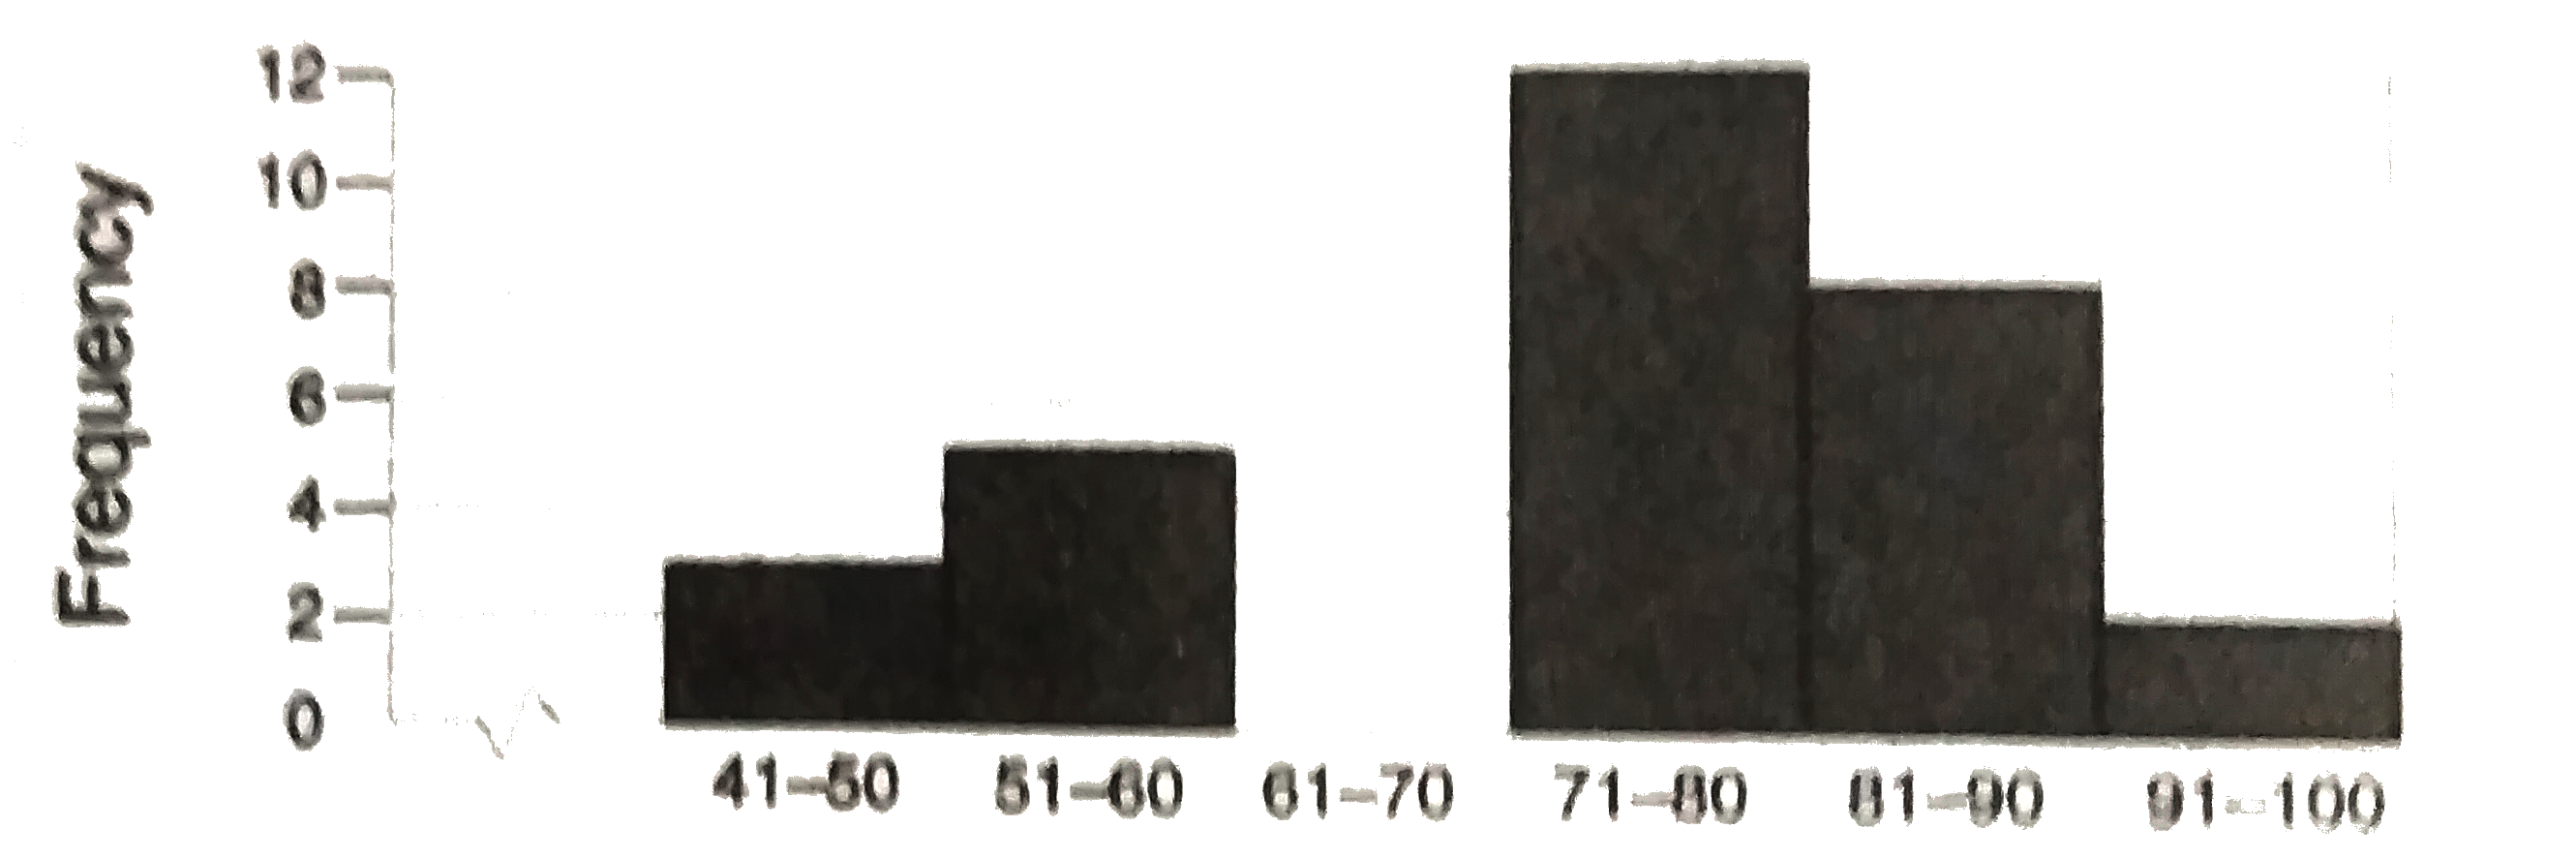
The diagram above shows a graph of the student's test scores in Ms. Wedow's algebra class. Which ten-point interval contains the median?
61−70
71−80
81−90
91−100
The correct Answer is:B
Step by step video, text & image solution for The diagram above shows a graph of the student's test scores in Ms. Wedow's algebra class. Which ten-point interval contains the median? by Maths experts to help you in doubts & scoring excellent marks in Class 12 exams.
Updated on:21/07/2023Topper's Solved these Questions
- PROBLEM SOLVING AND DATA ANALYSISBOOK - ENGLISH SATCHAPTER - PROBLEM SOLVING AND DATA ANALYSISEXERCISE - Grib-In
40 Videos
- PROBLEM SOLVING AND DATA ANALYSISBOOK - ENGLISH SATCHAPTER - PROBLEM SOLVING AND DATA ANALYSISEXERCISE - Grib-In
40 Videos
- PROBLEM SOLVING AND DATA ANALYSISBOOK - ENGLISH SATCHAPTER - PROBLEM SOLVING AND DATA ANALYSISEXERCISE - EXERICSE
80 Videos
- PROBLEMS IN CONTEXT BOOK - ENGLISH SATCHAPTER - PROBLEMS IN CONTEXT EXERCISE - PRACTICE TEST
10 Videos
Similar Questions
Ages of 20 Students Enrolled in a College Class
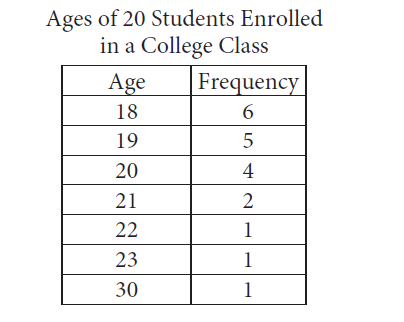
The table above shows the distribution of ages of the 20 students enrolled in a college class. Which of the following gives the correct order of the mean, median, and mode of the ages?
View Solution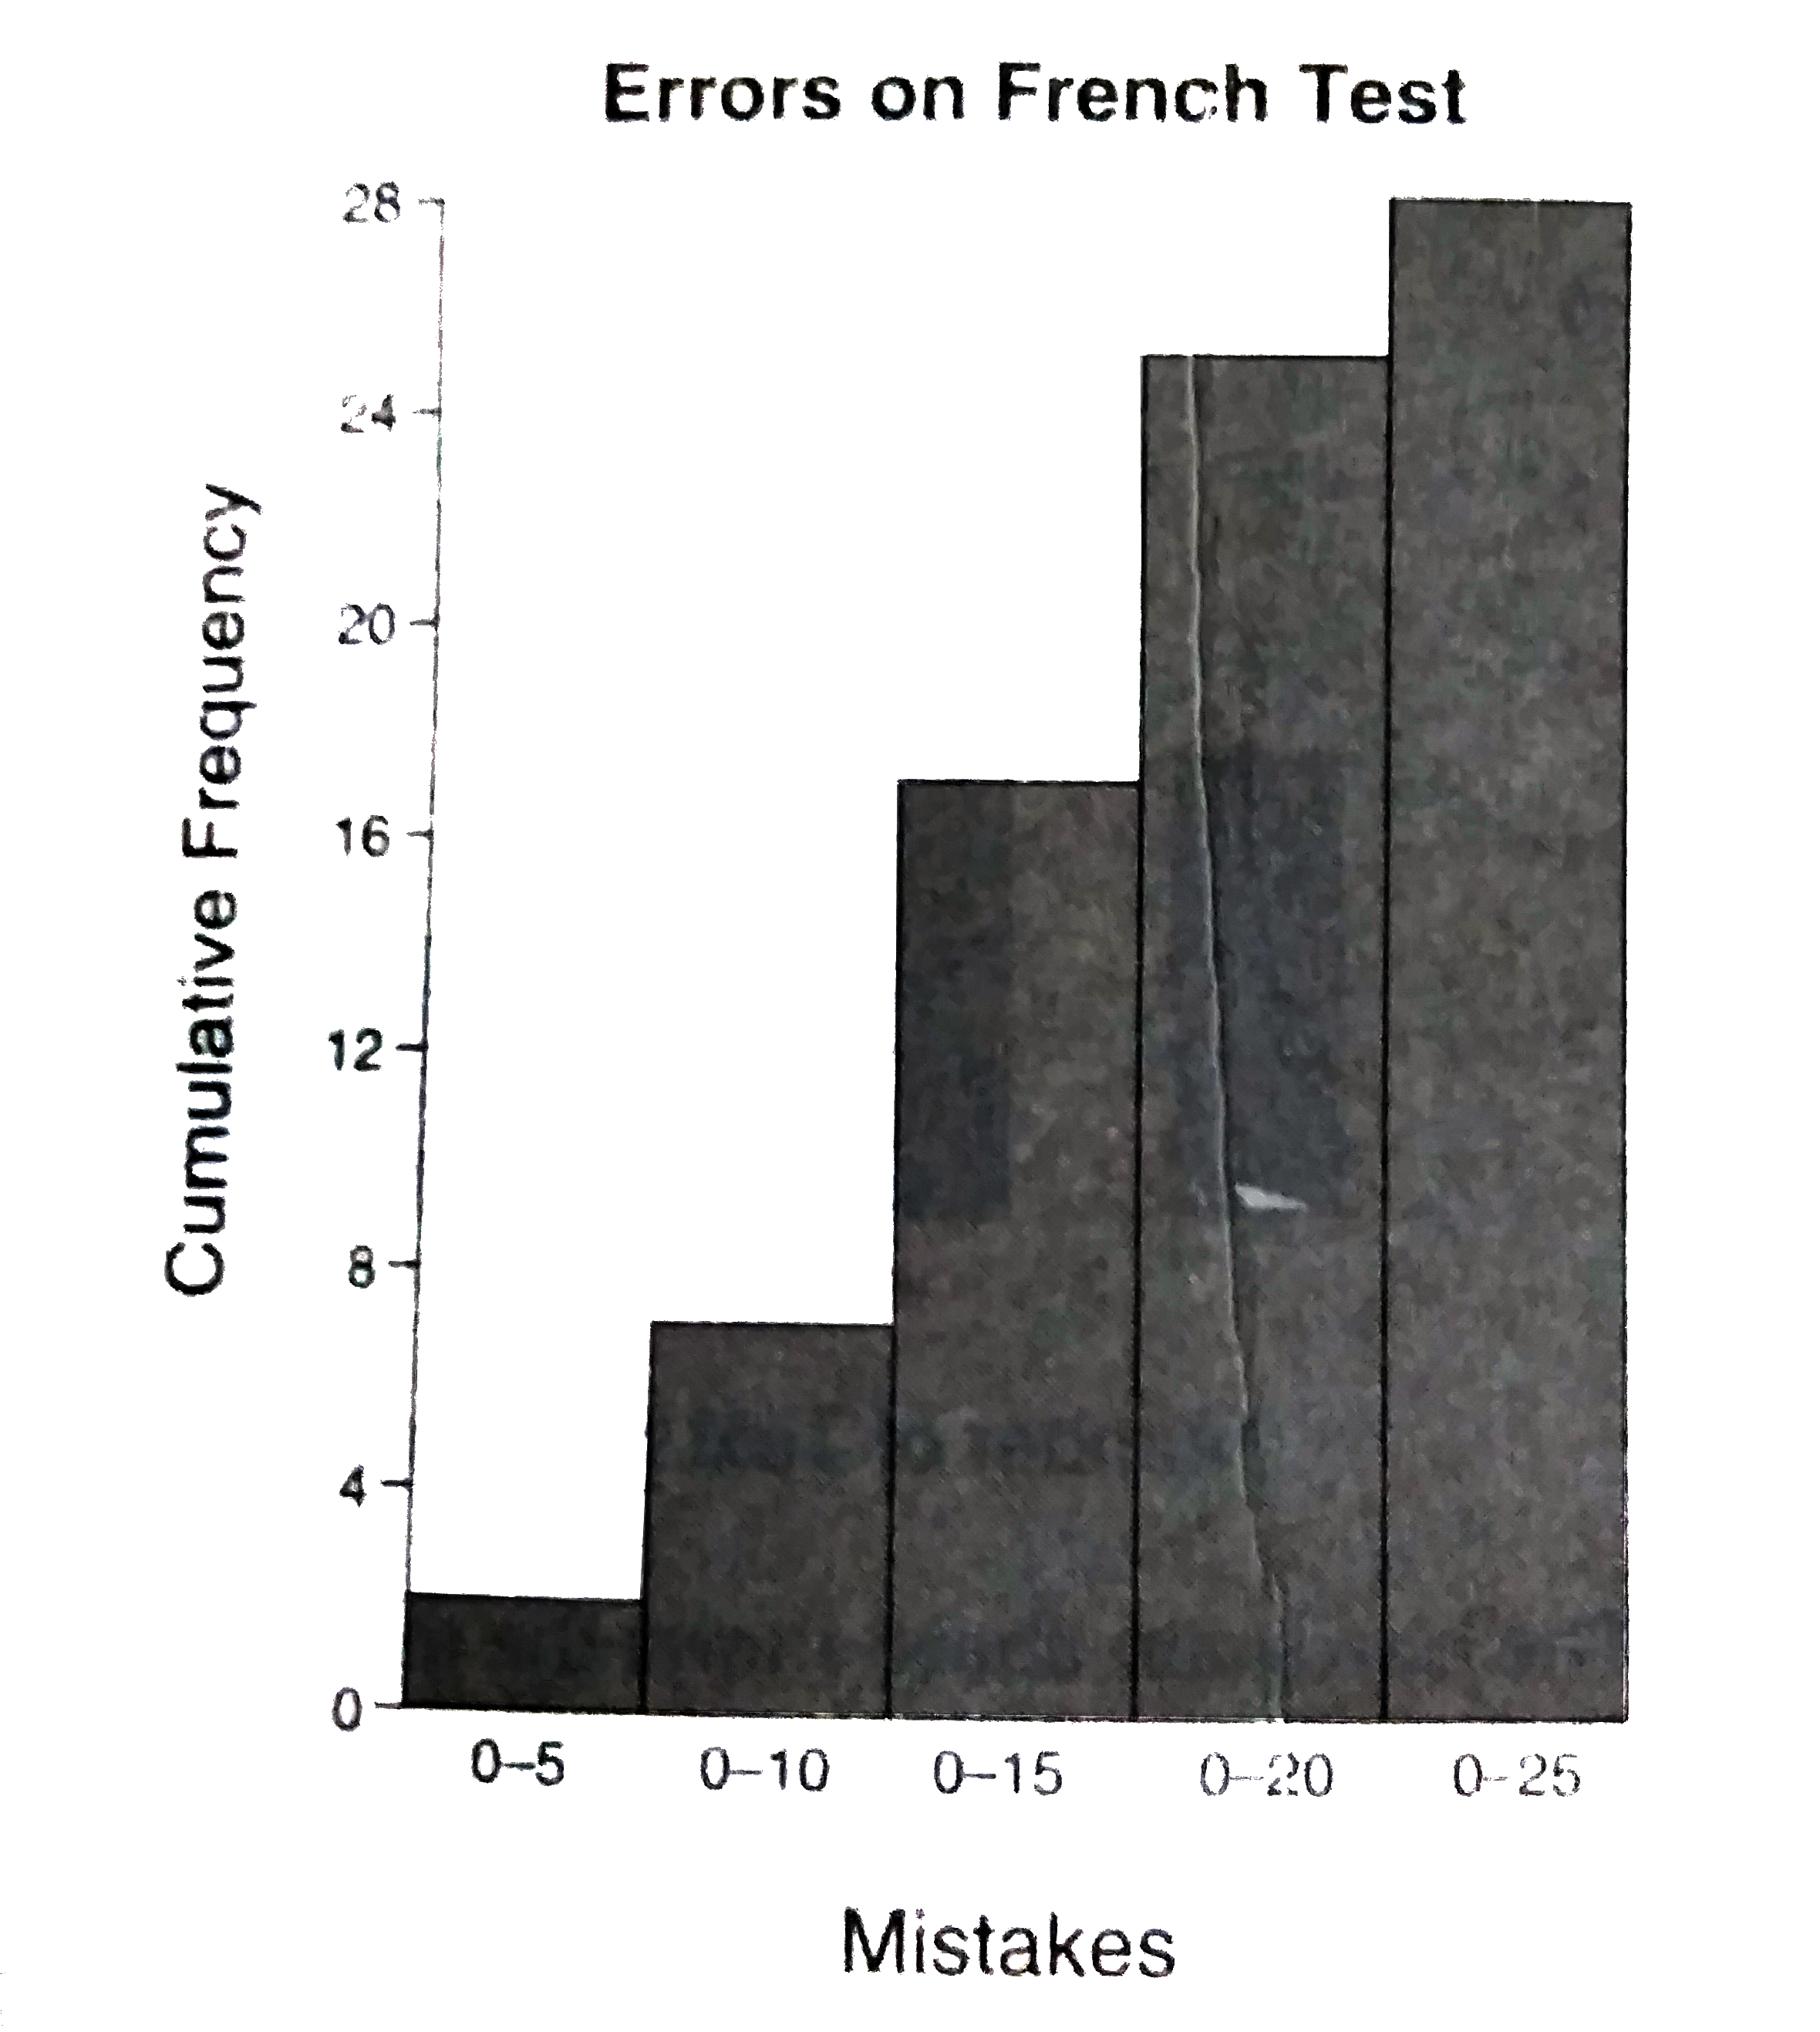
The cumulative histogram above shows the distribution of mistakes 28 students in a French languge class made on a test. What is the probability that a student selected at random made more than 10 mistakes?
View Solution
Knowledge Check
For 20 quiz scores in a typing class, the table below gives the frequency of the scores in each score interval. Which score interval contains the median of the scores?
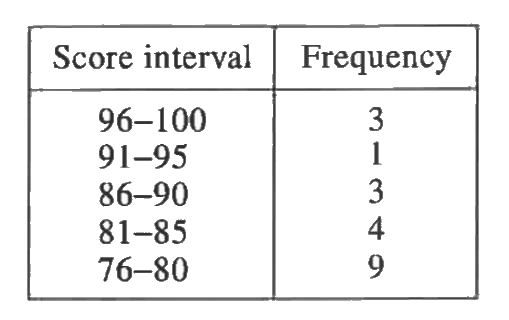 A96-100B91-95C86-90D81-85
The histogram above shows the distribution of 30 test scores. If test score is selected at random, what is the probability that the score falls in the interval that contains the median score?A415B25C12D35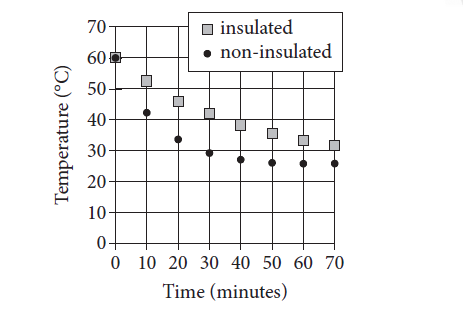
Two samples of water of equal mass are heated to 60 degrees Celsius (°C). One sample is poured into an insulated container, and the other sample is poured into a non-insulated container. The samples are then left for 70 minutes to cool in a room having a temperature of 25°C. The graph above shows the temperature of each sample at 10-minute intervals. Which of the following statements correctly compares the average rates at which the temperatures of the two samples change?AIn every 10-minute interval, the magnitude of the rate of change of temperature of the insulated sample is greater than that of the non-insulated sample.BIn every 10-minute interval, the magnitude of the rate of change of temperature of the non-insulated sample is greater than that of the insulated sample.CIn the intervals from 0 to 10 minutes and from 10 to 20 minutes, the rates of change of temperature of the insulated sample are of greater magnitude, whereas in the intervals from 40 to 50 minutes and from 50 to 60 minutes, the rates of change of temperature of the non-insulated sample are of greater magnitude.DIn the intervals from 0 to 10 minutes and from 10 to 20 minutes, the rates of change of temperature of the non-insulated sample are of greater magnitude, whereas in the intervals from 40 to 50 minutes and from 50 to 60 minutes, the rates of change of temperature of the insulated sample are of greater magnitude.

The test grades of the 26 students in a math class are shown in the chart above. What is the median test grade for the clsss?
View Solution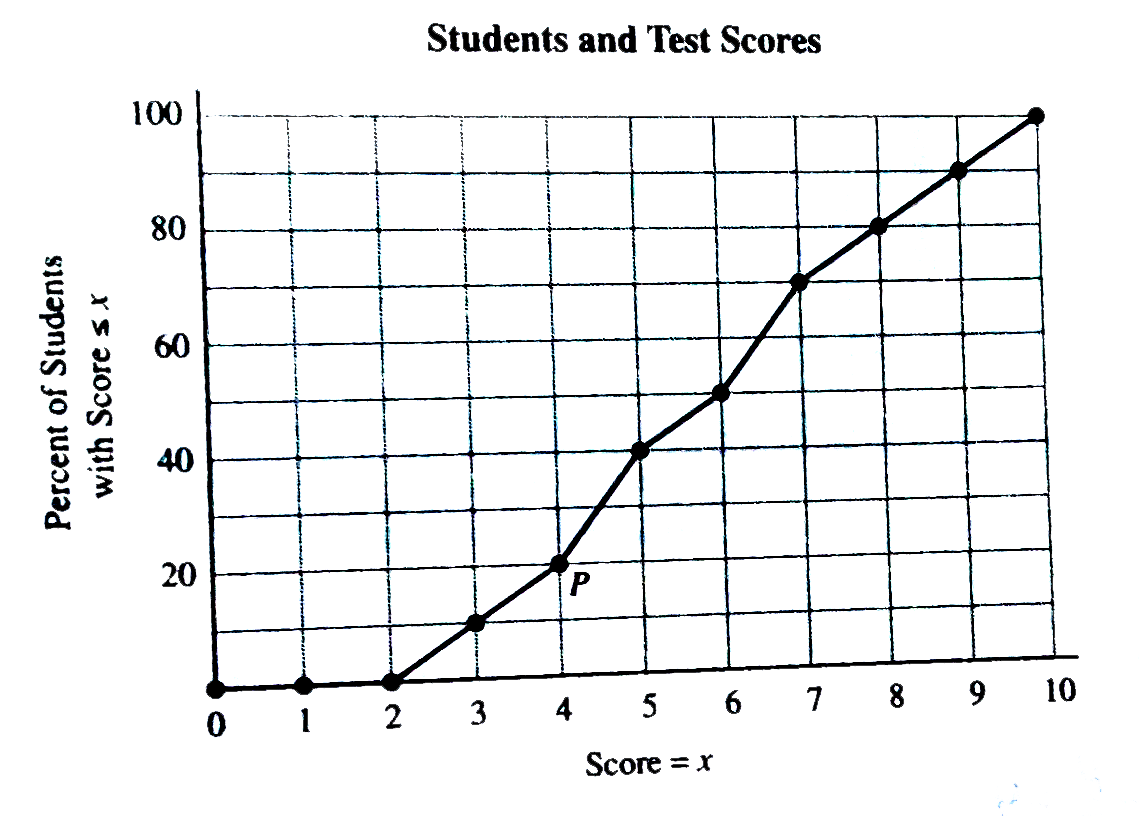
When a 10-question true -false quiz was given to 50 students , the number of correct answer ranged from 3 to 10 , as shown on the graph above . Each point on the graph shows the percent of students who earned scores less than or equal to x . For example , point P shows that 20 percent of the students received scores of 4 or less. According to the graph , how many students got scores of 6 ?
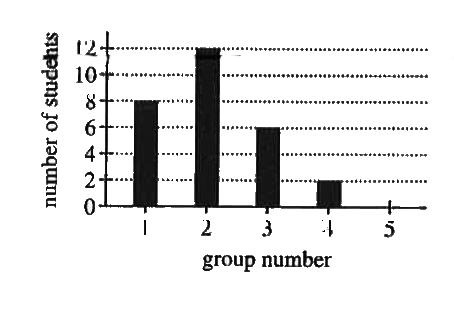
View SolutionThe graph below shows the number of students who were present on Thursday from each of the 5 groups in Ms. Meagan's class. What is the probability that a student selected at random from the class on Thrusday is in Group 4?
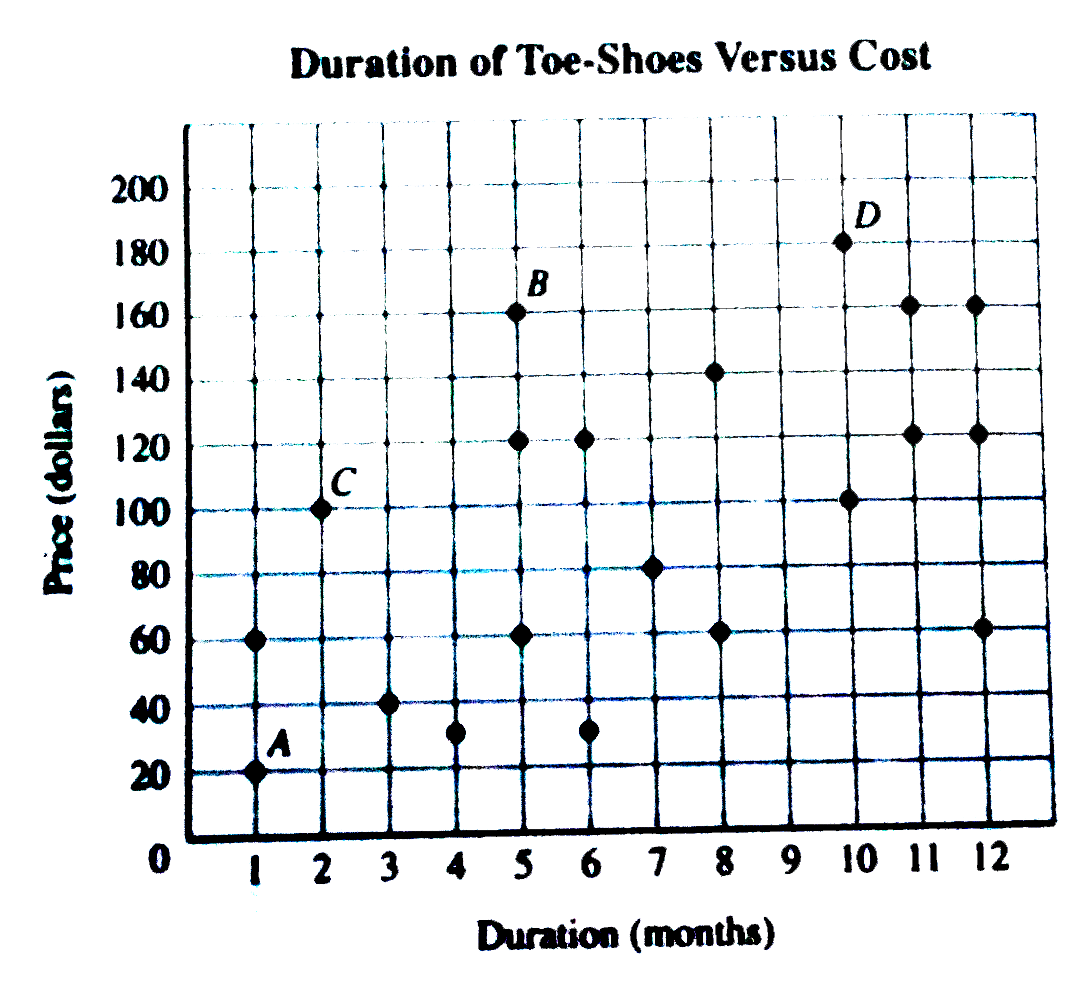
View SolutionThe toe shoes of professional ballerinas often wear out in less than a year . At a ballet school there are 20 students , all of whom bought new toe shoes of different brands and at varying prices. They kept track of how long their shoes lasted. Each point on the graph below shows the duration of a ballet student's toe shoes plotted against their price . Of the five labeled points , which one corresponds to the toe shoes that cost the greatest amount per month of use ?
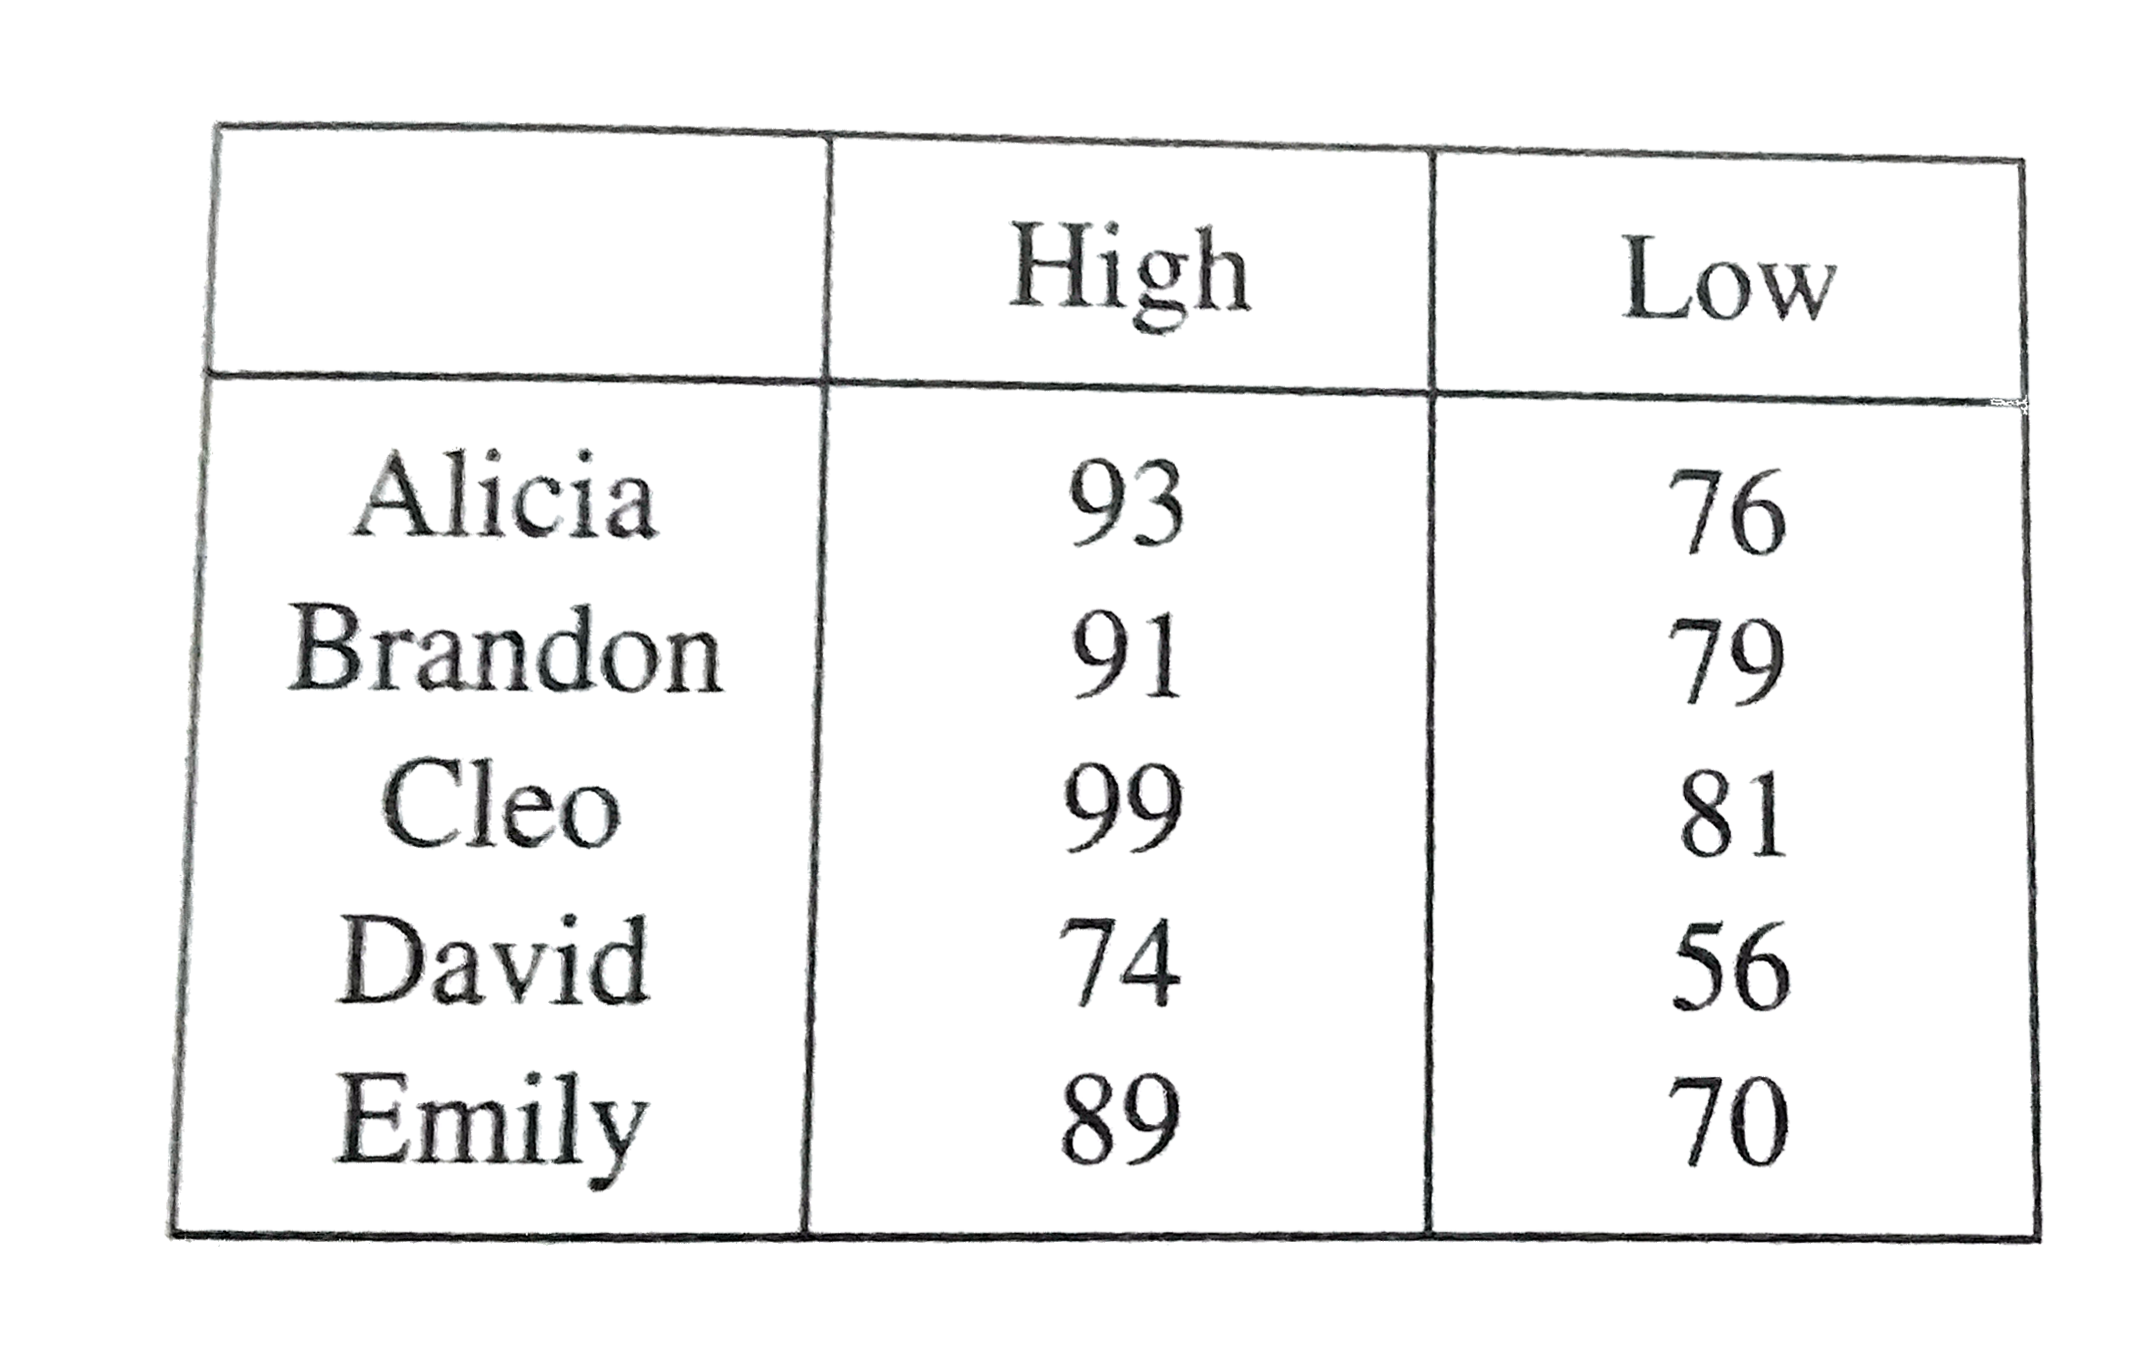
View SolutionThe highest and lowest test scores of five students in Mr . Canyon's science class are listed below . Which students had the greatest range of scores ?
View Solution
