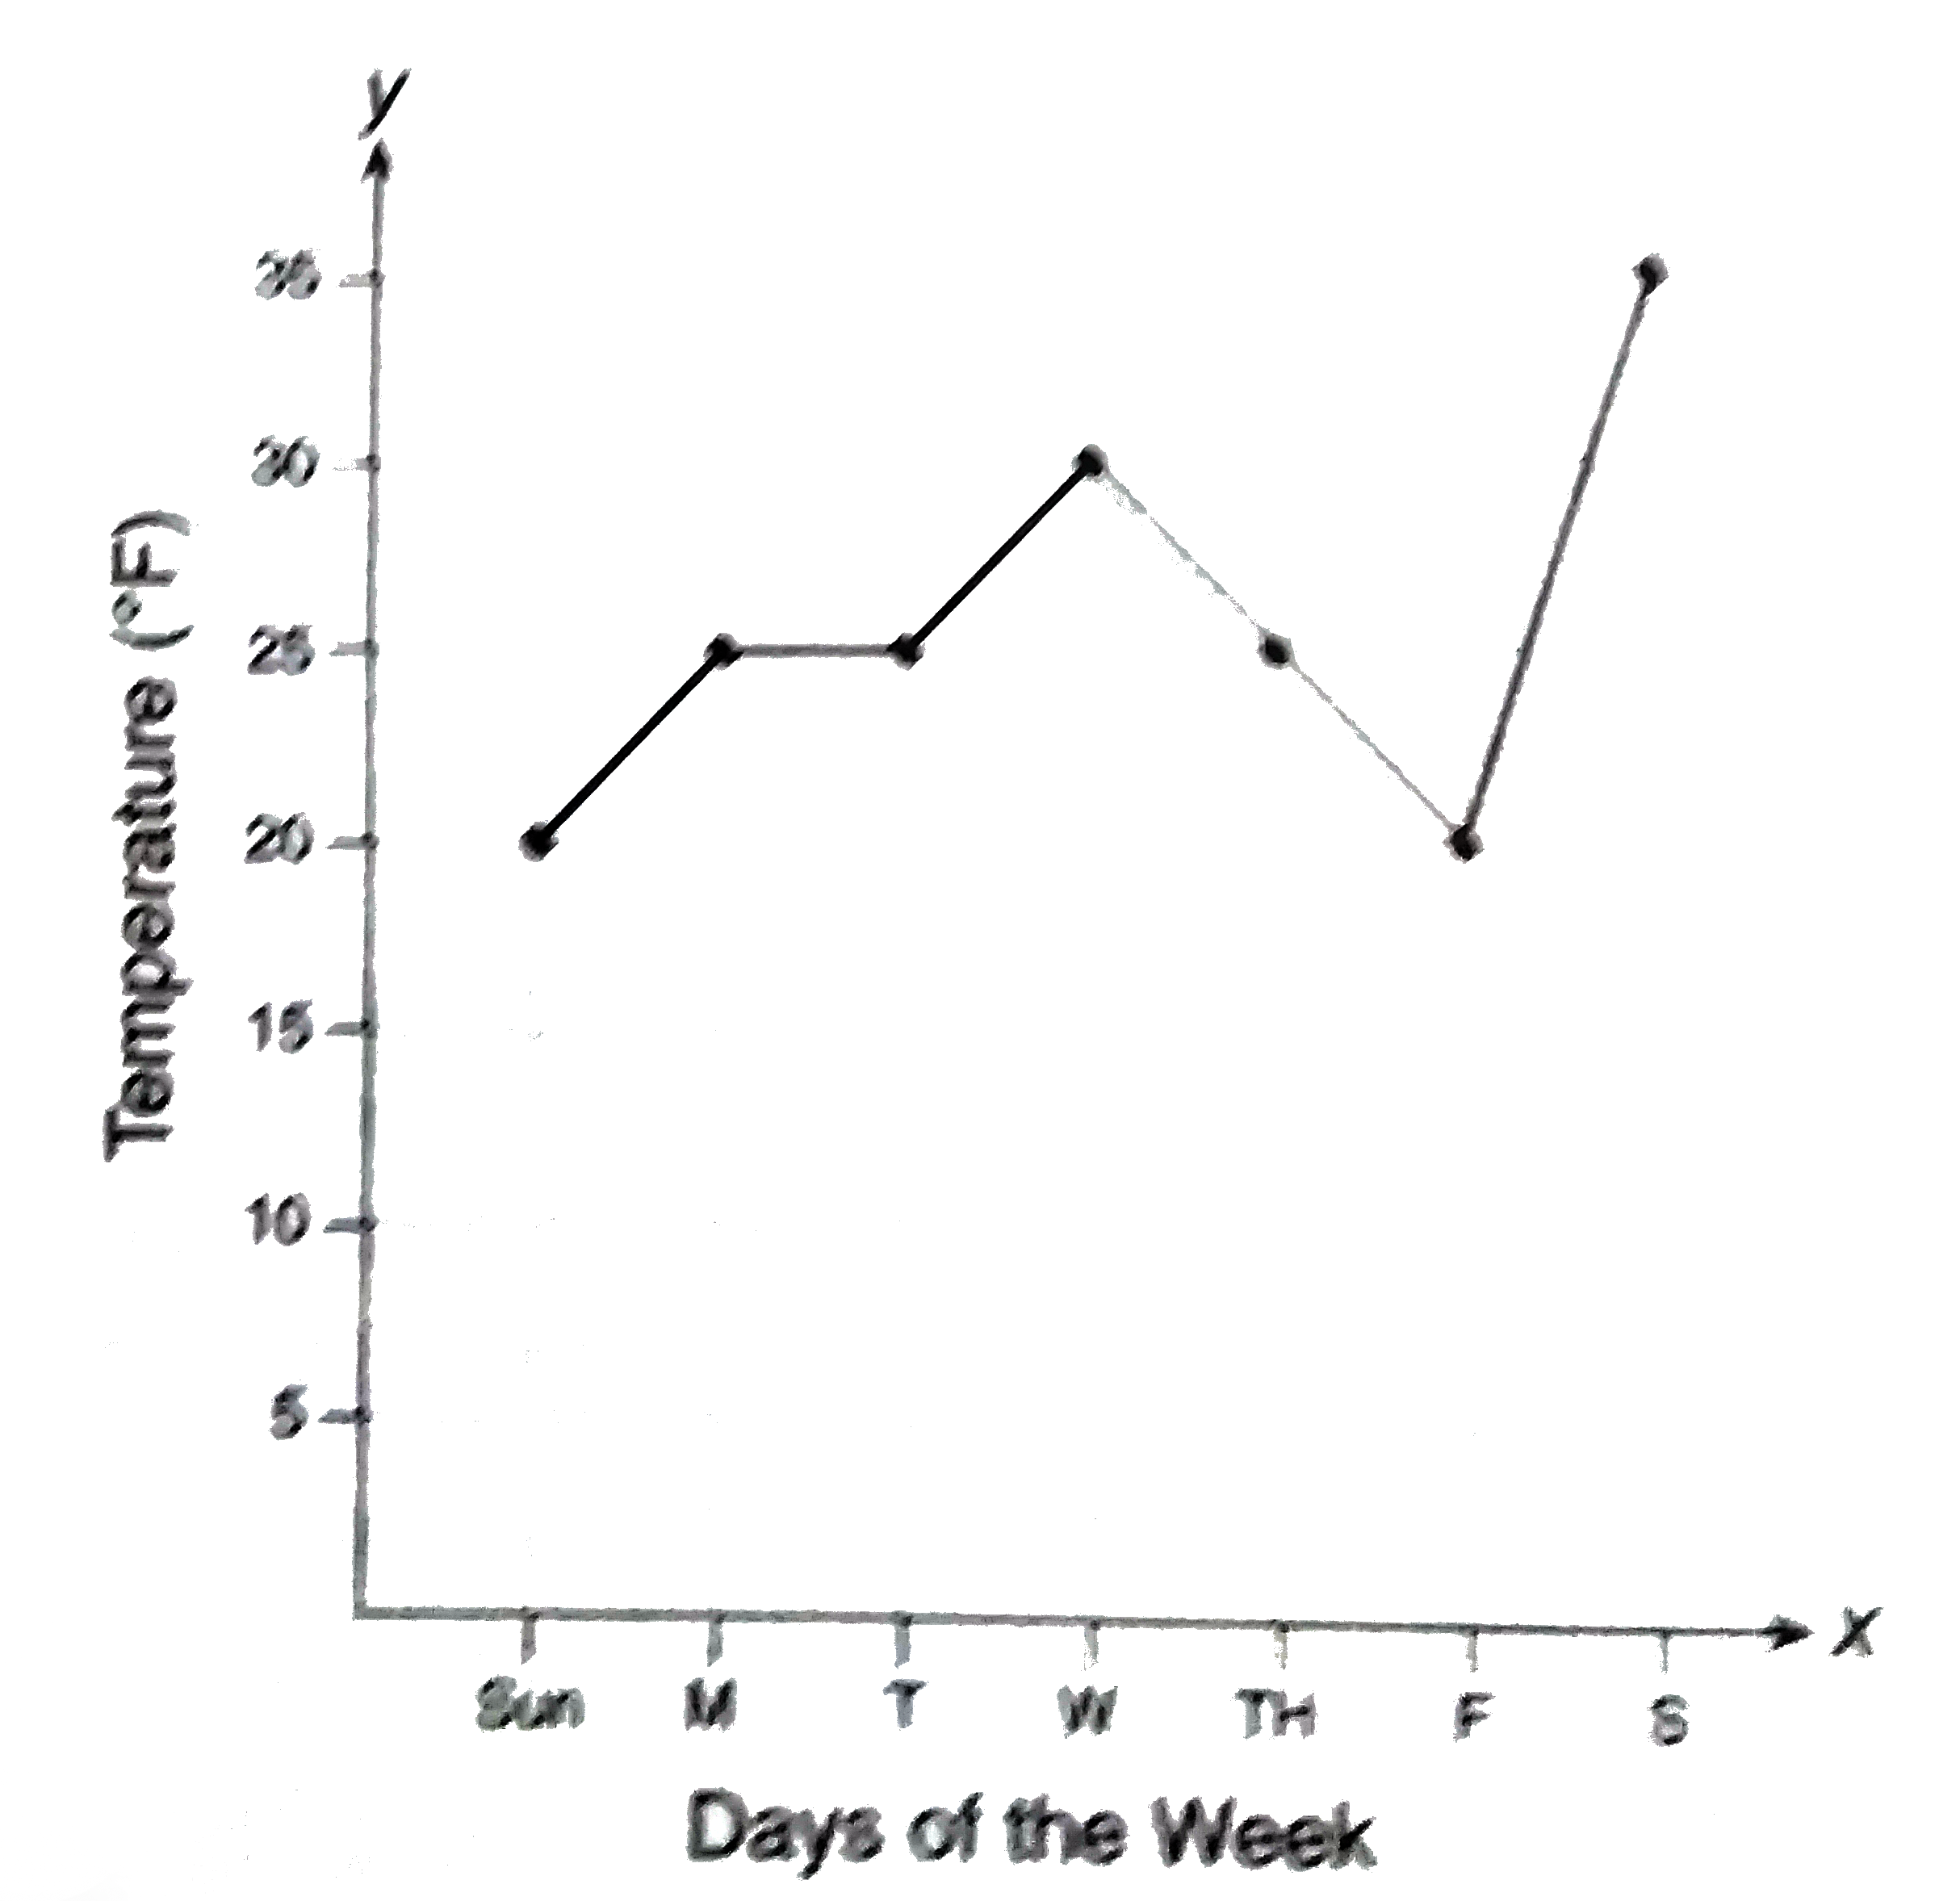
The graph above shows the average daily temperature during a particular week in January in certain city. Which statement best describes the temperature date in the graph above?
Median=mean
meas< mode
median =mode
mean=mode
The correct Answer is:C
Step by step video, text & image solution for The graph above shows the average daily temperature during a particular week in January in certain city. Which statement best describes the temperature date in the graph above? by Maths experts to help you in doubts & scoring excellent marks in Class 12 exams.
Updated on:21/07/2023Topper's Solved these Questions
- PROBLEM SOLVING AND DATA ANALYSISBOOK - ENGLISH SATCHAPTER - PROBLEM SOLVING AND DATA ANALYSISEXERCISE - Grib-In
40 Videos
- PROBLEM SOLVING AND DATA ANALYSISBOOK - ENGLISH SATCHAPTER - PROBLEM SOLVING AND DATA ANALYSISEXERCISE - Grib-In
40 Videos
- PROBLEM SOLVING AND DATA ANALYSISBOOK - ENGLISH SATCHAPTER - PROBLEM SOLVING AND DATA ANALYSISEXERCISE - EXERICSE
80 Videos
- PROBLEMS IN CONTEXT BOOK - ENGLISH SATCHAPTER - PROBLEMS IN CONTEXT EXERCISE - PRACTICE TEST
10 Videos
Similar Questions
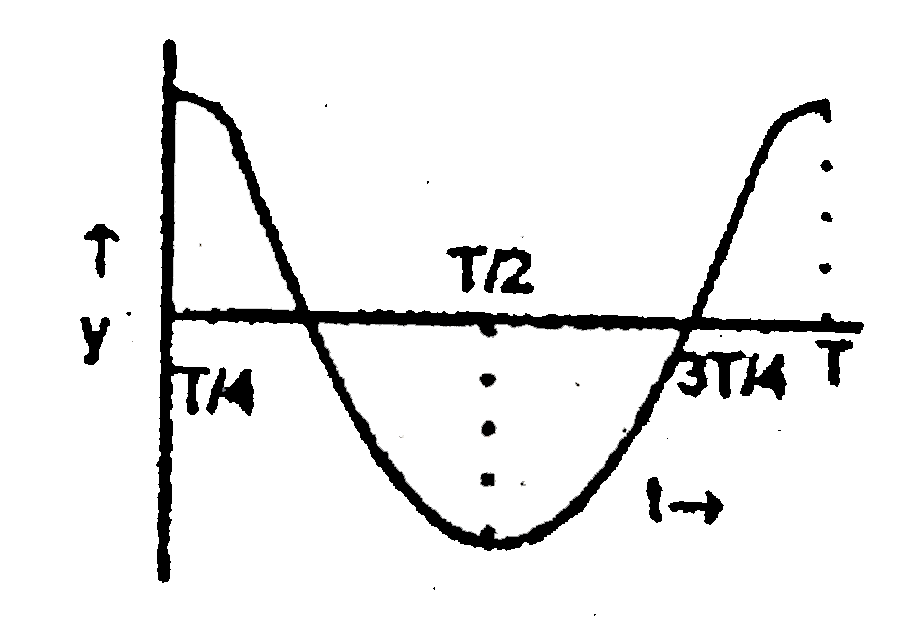
The graph in the figure shows how the displacement of a particle describing S.H.M. varies with time. Which one of the following statements is not true ?
View SolutionThe following graph shows the temperature forecast and the actual temperature for each day of a week.(a) On which days was the forecast temperature the same as the actual temperature? (b) What was the maximum forecast temperature during the week?(c) What was the minimum actual temperature during the week?(d) On which day did the actual temperature differ the most from the forecast temperature?
View Solution
Knowledge Check
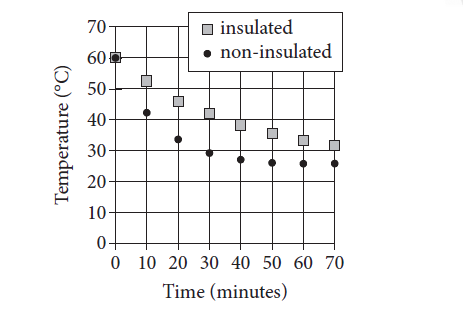
Two samples of water of equal mass are heated to 60 degrees Celsius (°C). One sample is poured into an insulated container, and the other sample is poured into a non-insulated container. The samples are then left for 70 minutes to cool in a room having a temperature of 25°C. The graph above shows the temperature of each sample at 10-minute intervals. Which of the following statements correctly compares the average rates at which the temperatures of the two samples change?AIn every 10-minute interval, the magnitude of the rate of change of temperature of the insulated sample is greater than that of the non-insulated sample.BIn every 10-minute interval, the magnitude of the rate of change of temperature of the non-insulated sample is greater than that of the insulated sample.CIn the intervals from 0 to 10 minutes and from 10 to 20 minutes, the rates of change of temperature of the insulated sample are of greater magnitude, whereas in the intervals from 40 to 50 minutes and from 50 to 60 minutes, the rates of change of temperature of the non-insulated sample are of greater magnitude.DIn the intervals from 0 to 10 minutes and from 10 to 20 minutes, the rates of change of temperature of the non-insulated sample are of greater magnitude, whereas in the intervals from 40 to 50 minutes and from 50 to 60 minutes, the rates of change of temperature of the insulated sample are of greater magnitude.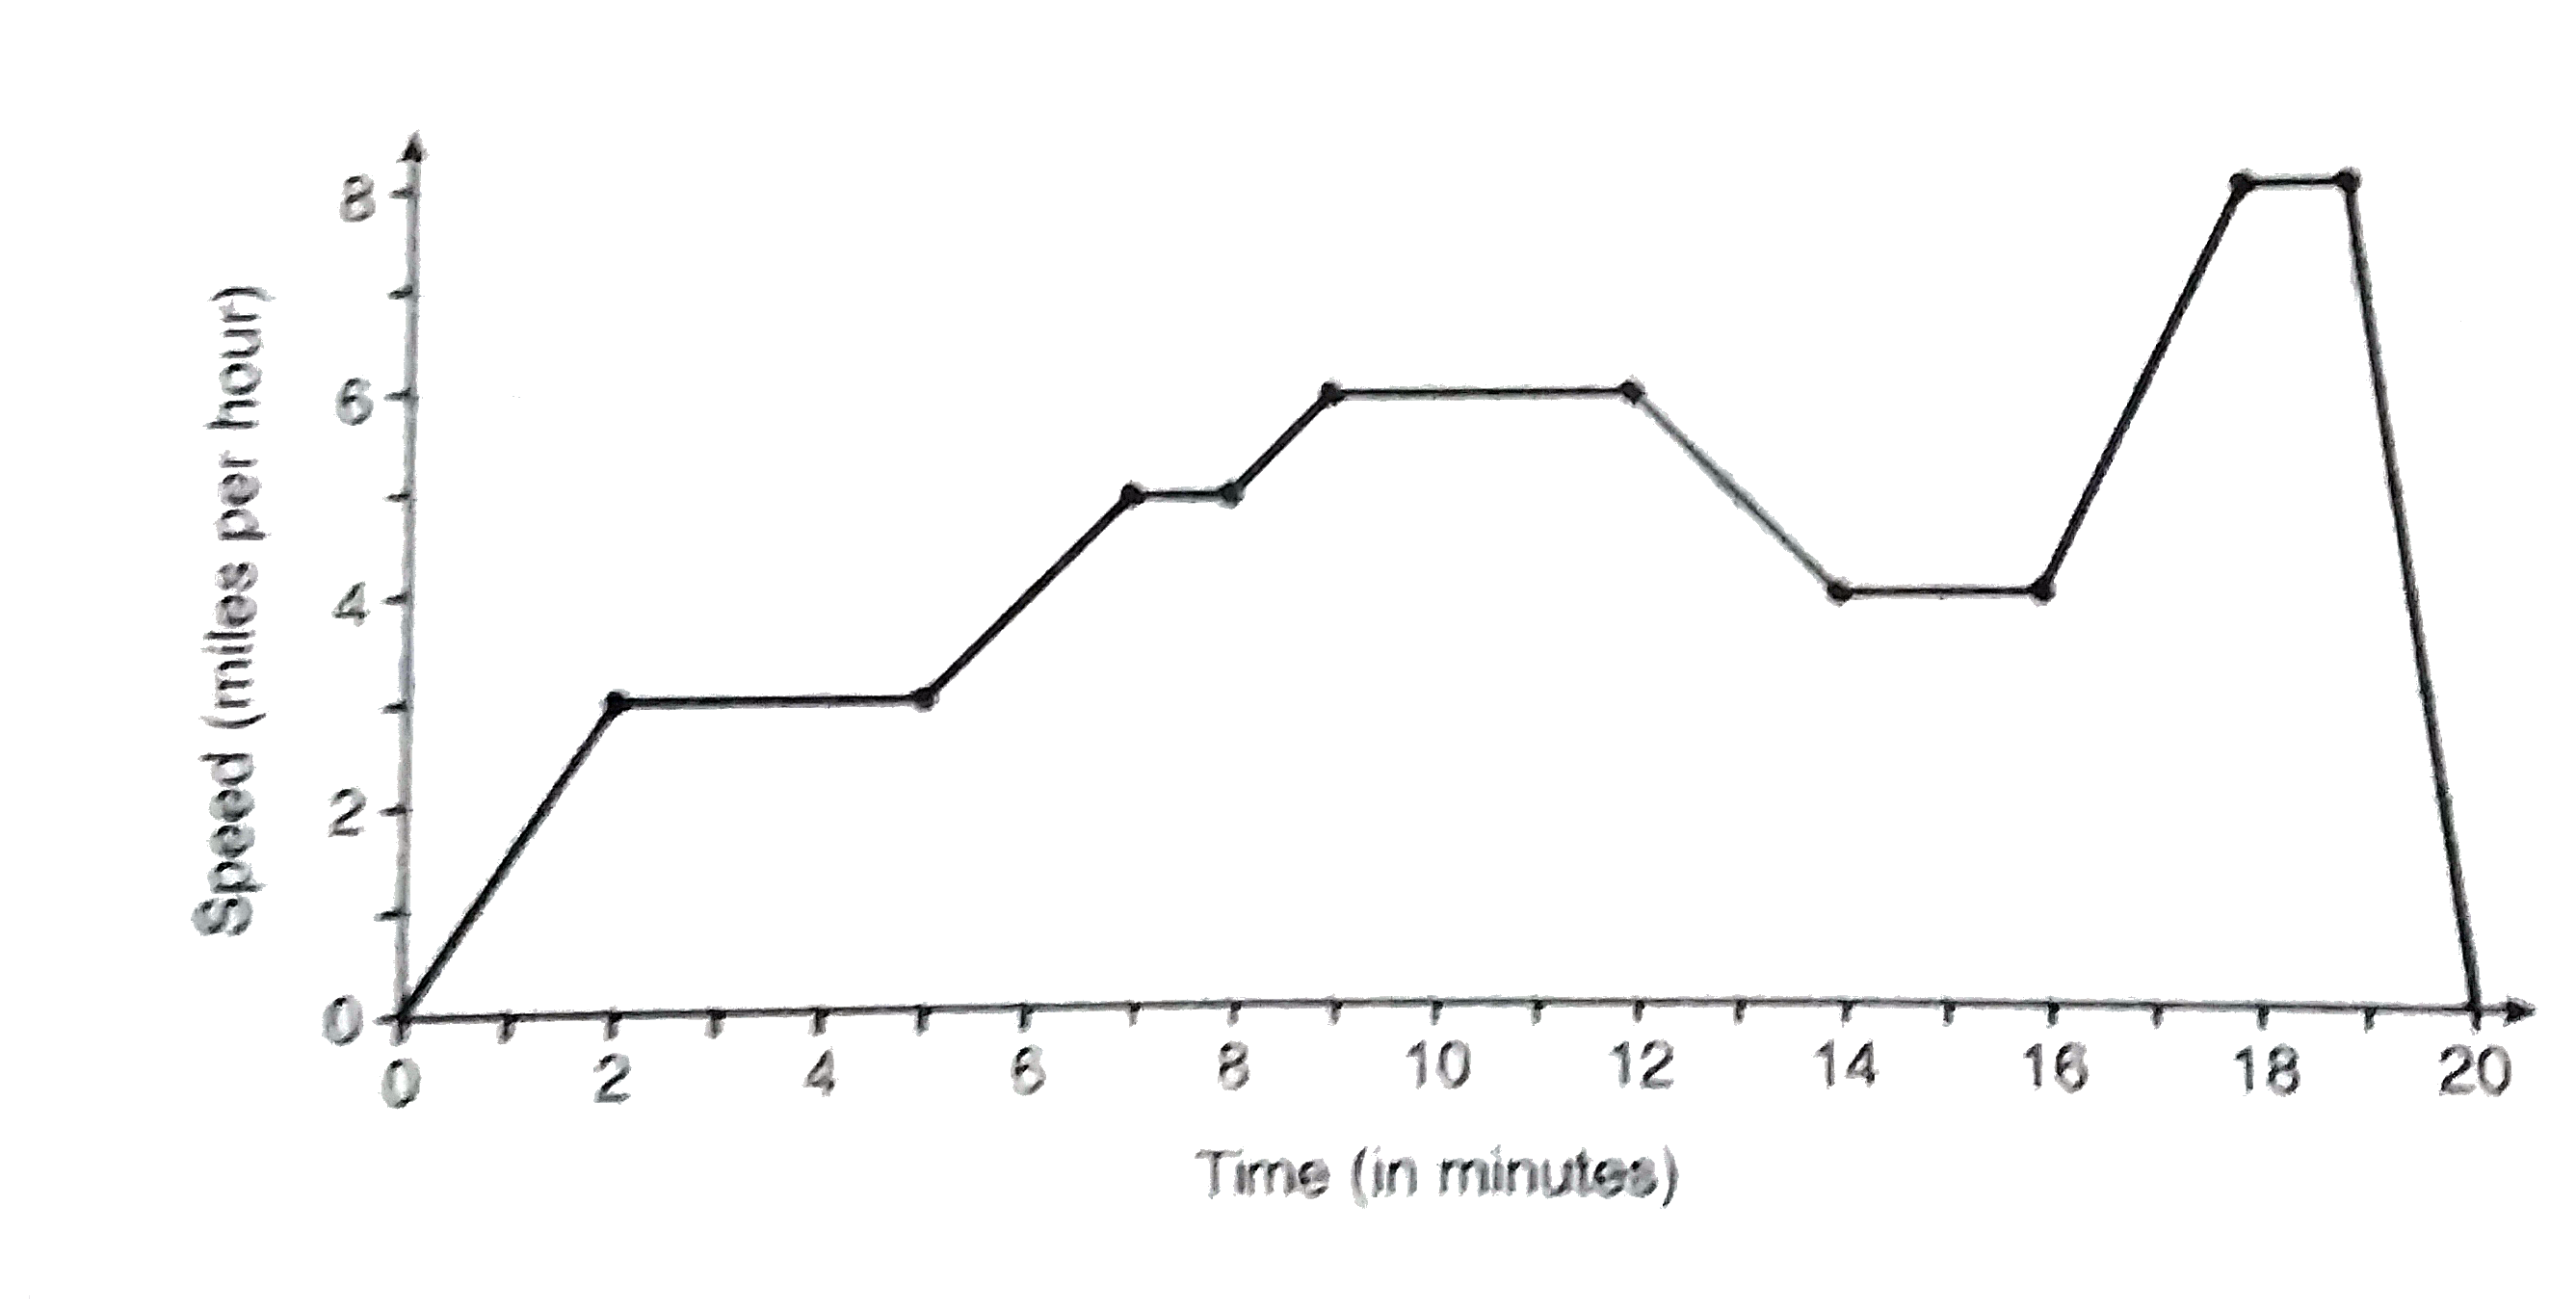
The graph above represents a jogger's speed during her 20-minutes jog around her neighbourhood. Which statement best describes what the jogger was doing during the 9-12 minutes interval of her jog?AShe was standing stillBShe was increasing her speedCShe was decreasing her speedDShe was jogging at a constant rateThe inequality |1.5C−24|≤30 represents the range of monthly average temperature, C, in degrees Celsius, during the winter month for a certain city. What was the lowest monthly average temperature, in degrees Celsius, for for this city?
A−4B0C6D9
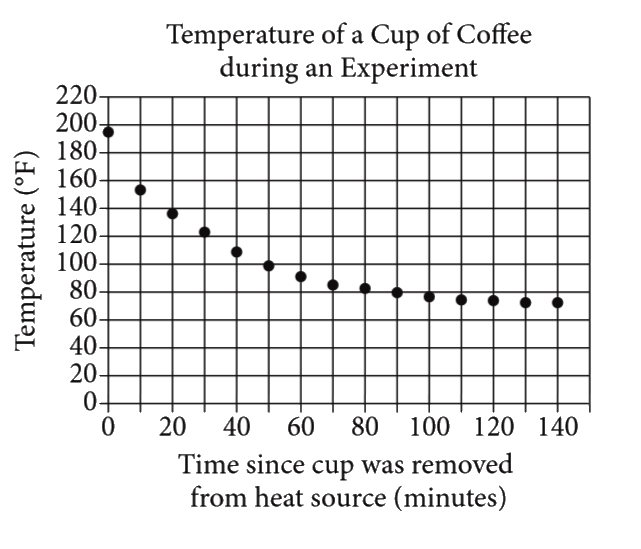
In an experiment, a heated cup of coffee is removed from a heat source, and the cup of coffee is then left in a room that is kept at a constant temperature. The graph above shows the temperature, in degrees Fahrenheit (.∘F), of the coffee immediately after being removed from the heat source and at 10-minute intervals thereafter.
During which of the following 10-minute intervals does the temperature of the coffee decrease at the greatest average rate?
View SolutionA sample of an ideal gas is heated doubling its absolute temperature . Which of the following statements best describes the result of heating the gas?
View Solution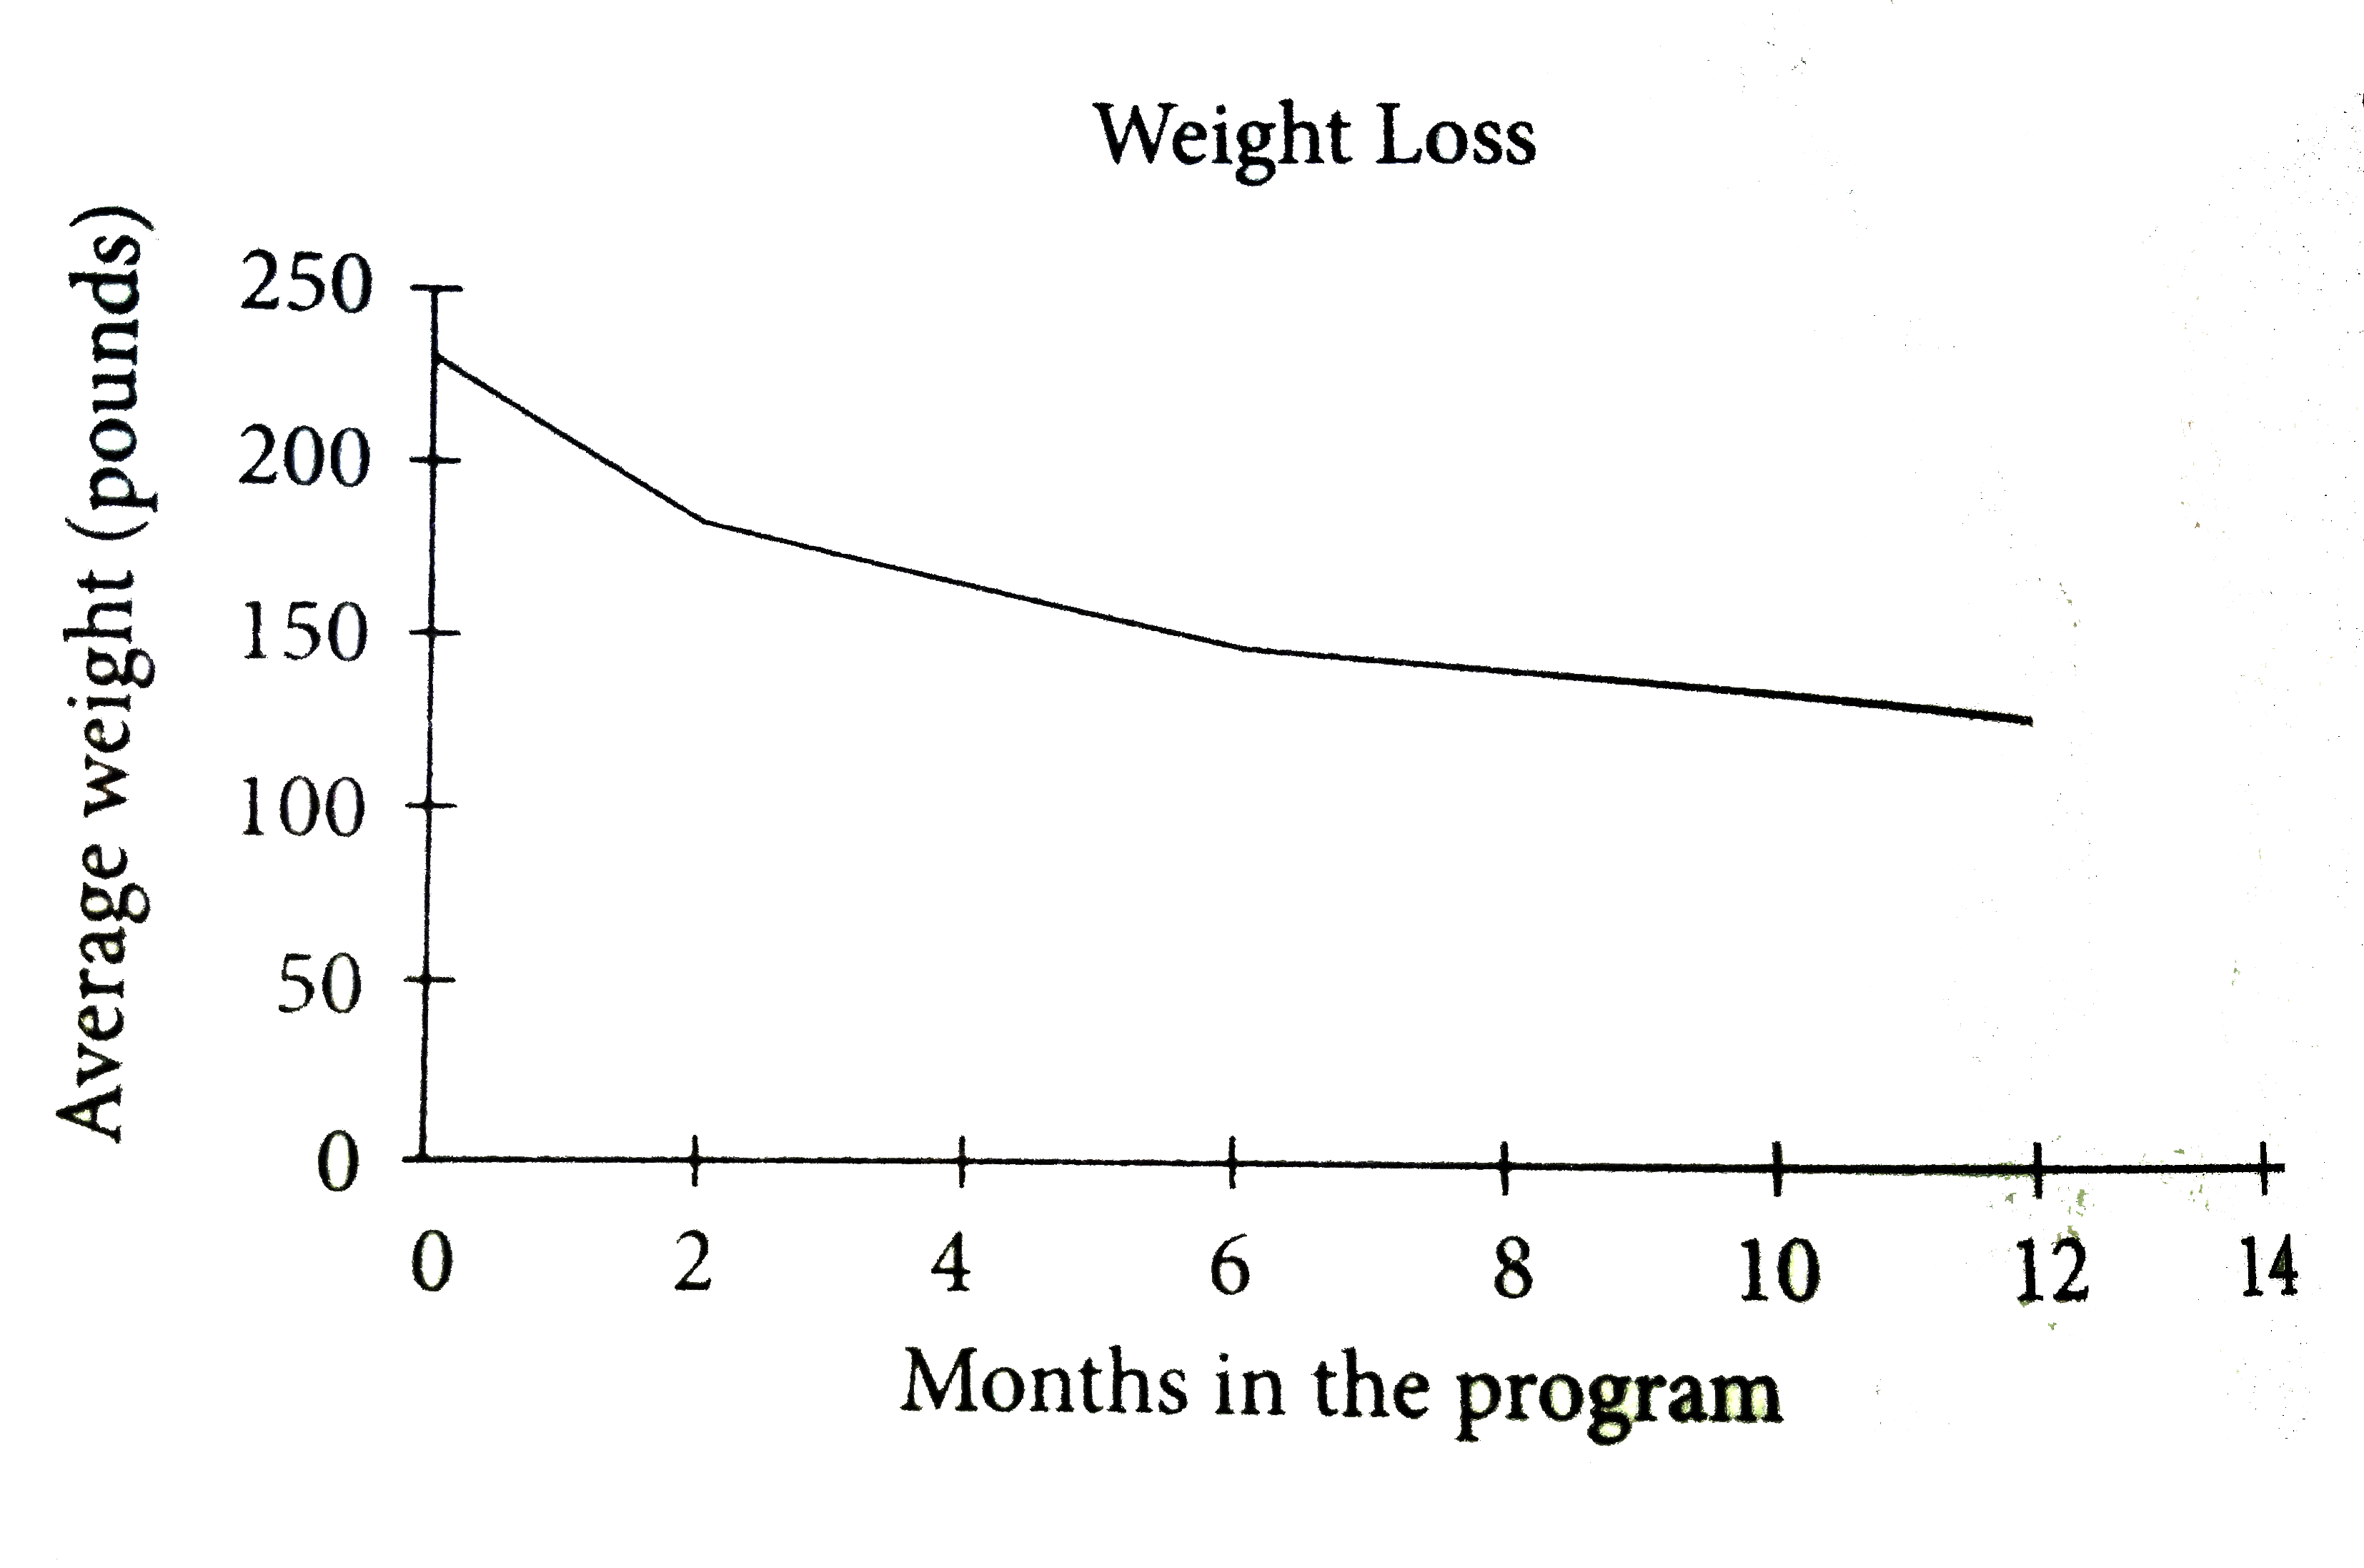
The graph above shows the average weight for the members of a weight loss program,for each month a member is in the program. According to the information in the graph, which of the following must be true?
View Solution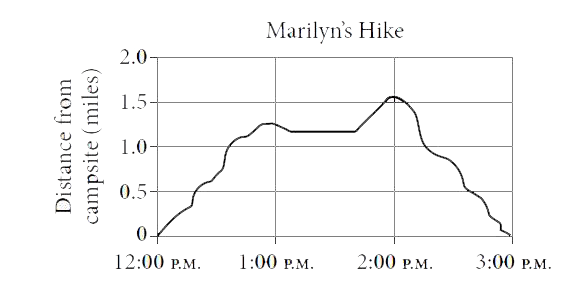
The graph above shows Marilyn’s distance from her campsite during a 3‑hour hike. She stopped for 30 minutes during her hike to have lunch. Based of the graph, which of the following is closest to the time she finished lunch and continued her hike?
View SolutionAs dry air moves upward , it expands and cools. If the temperature on the ground is 20∘ C and the temperature at a height of 1 km is 10∘ C, which of the following linear models best describes the temperature t in degrees C at a height of h km above the ground ?
View Solution
